
 ?Mathematical formulae have been encoded as MathML and are displayed in this HTML version using MathJax in order to improve their display. Uncheck the box to turn MathJax off. This feature requires Javascript. Click on a formula to zoom.
Abstract
Fluid seepage into rock pores not only generates poroelastic stress but also exerts seepage force on the rock skeleton. However, since the mechanism of the effect of seepage force on the stress field around the wellbore is not clear, conventional methods calculate the stress field only taking into account the poroelastic stress without the coupled effects of seepage force and rock deformation. Based on the theory of porous medium, this paper presents an analytical solution of the circumferential stress field formed by the seepage force around the wellbore and introduces the solution into traditional calculation models to overcome these issues. The numerical study by MATLAB® was used to simulate the stress field around the wellbore. Numerical simulation results show that the seepage force generates a circumferential tensile action and reduces in-situ circumferential compressive stress around the wellbore. Under the effect of seepage force, the effective circumferential stress around the wellbore becomes smaller. When considering seepage force, effective circumferential stress along the θ = 0 direction at the wellbore wall is reduced by about 32% compared with traditional numerical results. In addition, the circumferential stress field formed by the seepage force increases the possibility of rock failure at the well wall. The analytical results indicate that the seepage force should be considered in the stress field calculation around the wellbore, especially in reservoirs with low permeability.
1. Introduction
There has been increasing attention regarding the stress fields around the wellbore in the large-scale use of hydraulic fracturing technology to develop unconventional reservoirs. The evaluation of the stress fields around the wellbore is significant because it is a prerequisite for analyzing wellbore stability and predicting the initiation and propagation of hydraulic fractures.
The traditional calculation models of Haimson and Hubbert proposed that when fluid is injected into the wellbore, three kinds of stress fields around the wellbore work together to cause the well wall to fracture. These three stress fields are in-situ stress, wellbore pressure and poroelastic stress caused by pore pressure variations at various points after the fluid flows into the pore (Haimson, Citation1968; Haimson & Fairhurst, Citation1967, Citation1969a, Citation1969b; Hubbert & Willis, Citation1972). Subsequently, many scholars (Aadnoy & Belayneh, Citation2009; Chatterjee & Mukhopadhyay, Citation2003; Ito & Hayashi, Citation1991; Ito, Citation2008; Kiss et al., Citation2018; Medlin & Masse, Citation1979; Muqtadir et al., Citation2018; Rummel, Citation1987; Song et al., Citation2017; Wang et al., Citation2018) have contributed their efforts to study the fracture initiation mechanism of hydraulic fracturing and wellbore stability based on Haimson and Hubbert’s theoretical models. By comparing laboratory experiments with theoretical predictions, Medlin and Masse (Citation1979) proposed that the theoretical prediction results could only be partially verified when the fracturing fluid is permeable. Ito and Hayashi (Citation1991) investigated the effects of wellbore diameter and pressurization rate on the initiation of hydraulic fractures. By comparison with the prediction results of traditional models, they found that the initiation of fractures may be inside the rock and not on the wellbore surface. Based on the traditional calculation theory, Song et al. (Citation2017) analyzed the effect of nanoparticle drilling fluid on the wellbore stability of shale reservoirs using the two-dimensional fluid–solid coupling module in FLAC3D software. Muqtadir et al. (Citation2018) investigated the effect of the type of fracturing fluid on the fracture pressure of tight sandstone rocks. Do et al. (Citation2019) investigated the stability of wellbores drilled in anisotropic permeable rocks, taking into account the transient effect of fluid flow.
The situation around the wellbore is becoming more and more complicated as the oil industry moves toward more challenging jobs in unconventional reservoirs. Therefore, a number of authors have tried to improve the traditional stress field calculation model around the wellbore. Qi et al. (Citation2018) proposed an analytical solution for stresses near an inclined elliptical wellbore drilled in anisotropic formation, based on linear elasticity theory combined with the complex function method. Lanzoni et al. (Citation2018) investigated the pressure and stress fields around two parallel boreholes of different sizes in a poroelastic material. Yang et al. (Citation2019) added the thermal stress term caused by the temperature change in the drilling fluid to the traditional calculation model and analyzed the effects of temperature on wellbore stability.
However, when fluid flows into reservoir pores it not only increases pore pressure and creates poroelastic stress, but also forms a seepage zone with a certain pore pressure gradient around the wellbore. Under the effect of the pore pressure gradient, the fluid exerts seepage force on the rock skeleton, which affects the equilibrium state of the stress field (Taylor, Citation1948; Terazaghi et al., Citation1996). Mourgues, Cobbold, and Rodrigues (Mourgues & Cobbold, Citation2003; Cobbold & Rodrigues, Citation2007) verified the existence of seepage force based on sandbox simulations and evaluated the influence of seepage force on reservoir structures under local ultrahigh pore fluid pressures. Rozhko (Rozhko, Citation2007, Citation2008; Rozhko et al., Citation2007) investigated the influence of seepage force on the failure of porous elastic media and developed a code for calculating the stress field of seepage force in porous elastic media. Liu and Chiew (Citation2012) analyzed how the additional seepage force acts to modify the critical shear stress for sediment entrainment. Perazzelli et al. (Citation2014) investigated the problem of the stability of the tunnel face under seepage force based upon the method of slices. Pan et al. (Citation2017) studied the effect of seepage forces on the stability of three-dimensional slopes in light of the kinematic approach of limit analysis. AlKhafaji et al. (Citation2020) studied the bearing capacity problem of shallow rigid foundations on rock masses subjected to horizontal seepage force.
Despite seepage forces playing a crucial role in the failure of the poroelastic medium, they have been overlooked in previous studies of petroleum engineering. When considering fluid flows into the pores, neither the traditional model nor the modified models take into account the stress field formed by the seepage force around the wellbore. There have been few reports on the analysis of the stress field around the wellbore under the influence of seepage force.
In this work, we established a seepage force stress field calculation model of the vertical wellbore for the first time and introduced this model into the traditional stress field calculation model. Then, we compared the circumferential stress field formed by the seepage force with that formed by poroelastic stress around the wellbore and analyzed the mechanism of seepage force on the stress field. Lastly, we analyzed the effect of seepage force on the effective stress field of reservoirs with different permeabilities.
2. Calculation of stress field around the wellbore
2.1. Traditional computational model
Figure shows a vertical wellbore physical model with radius and initial reservoir pore pressure
, assuming an isotropic and permeable reservoir. To calculate and simulate the stress field in the range
around the wellbore, we assume the wellbore pressure as
and horizontal total principal stresses as S11 and S22 (|S11| > |S22|). Note that tensile stresses are assumed to be negative in this paper.
Figure 1. Physical model of vertical wellbore.
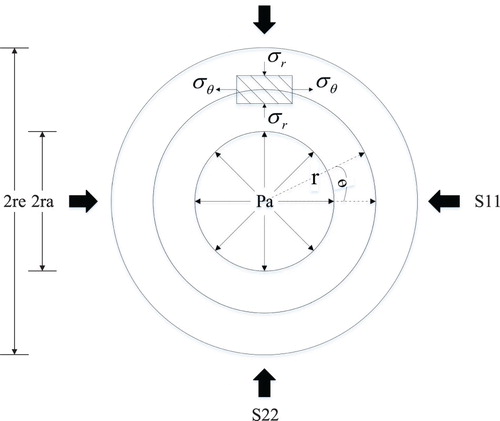
First, we considered the circumferential total stress Sθ1 formed by two horizontal total principal stresses S11 and S22 as (Haimson, Citation1968):
(1)
(1) where
and
, and
and
are effective horizontal principal stresses. By introducing
and
into Equation (Equation1
(1)
(1) ), we obtained the effective circumferential stress
formed by in-situ stress alone around the wellbore.
After the fluid was injected into the wellbore, circumferential total stress induced by the pressure
of wellbore could be calculated by the elastic-mechanics Lamé equation as (Timoshenko & Goodier, Citation1951):
(2)
(2) Taking into account fluid seepage into the reservoir, the total circumferential stress
due to pore pressure change at each point was expressed as (Haimson, Citation1968):
(3)
(3) where
is the pore pressure distribution around the wellbore after fluid seepage into the reservoir.
is Poisson’s ratio and
and
are the frame and mineral matrix bulk moduli of rock, respectively.
2.2. Introduction of seepage force
2.2.1. Working mechanism of seepage force
As fluid flows through pore space, the fluid imparts frictional forces to the solid skeleton, thereby modifying the balance of stress. This force is defined as seepage force by soil mechanics (Taylor, Citation1948). As shown in Equation (Equation4(4)
(4) ), seepage force is a kind of volume force. When the solid skeleton is homogeneous, the seepage force per unit volume is equal to the pore pressure gradient (unit: N/m3).
(4)
(4) where i denotes the hydraulic gradient,
is the unit weight of fluid, and
is the pressure gradient.
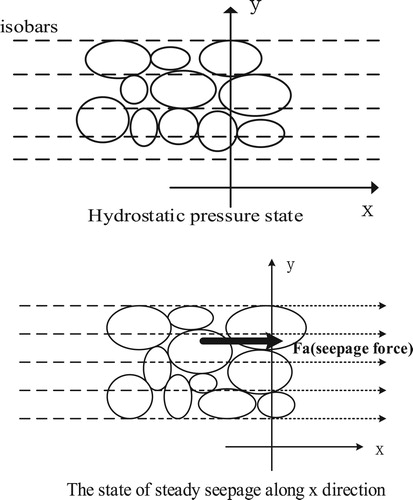
When fluid flows into reservoir pores, not only will the pore pressure around the wellbore increase, but also the pore pressure gradient will be formed around the wellbore under the effect of the viscous force. However, in general, only the additional circumferential stress caused by the pore pressure change is considered in the traditional calculation model. The pore pressure gradient, i.e. the seepage force, will change the stress balance of the rock skeleton (Mourgues & Cobbold, Citation2003). As shown in Figure , the rock matrix satisfied the requirements of the stress equilibrium equation under the stable state (Timoshenko & Goodier, Citation1951):
(5)
(5) Effective stresses such as
,
,
and
were introduced into Equation (Equation5
(5)
(5) ) as:
(6)
(6) As shown in Figure , when the fluid was under a hydrostatic pressure state, pore pressure gradients along the x and y directions
and
, respectively, were equal to 0 and there was no seepage force exerting any effect on the stress equilibrium state. However, when fluid seepage occurred along the x or y direction, pore pressure gradients
and
were not equal to 0. At this time, skeleton particles were affected by seepage force
under the friction drag force of fluid. The direction of
is consistent with the direction of fluid flow. As shown in Equations (Equation5
(5)
(5) ) and (Equation6
(6)
(6) ), the seepage force disturbed the original stress equilibrium state in response to the pore pressure gradient and changed the effective stress of the rock skeleton, thereby affecting the rock failure.
Figure 2. Action mechanism diagram of seepage force.
2.2.2. Calculation of seepage force stress field
To solve the circumferential stress field formed by the coupling of seepage force and rock deformation around the vertical wellbore, the calculation method of the seepage force stress field proposed by Rozhko (Citation2007, Citation2008) was applied in this work. This method is based on the linear elasticity theory combined with conformal transformation and complex potential to solve the pore-elasticity equation. The following basic properties of the rock around the wellbore are assumed: (1) isotropy of the material, (2) linearity of stress–strain relations, (3) small strains, (4) steady-state seepage, and (5) quasi-static condition.
The physical model shown in Figure satisfied the stress equilibrium equation (Equation Equation5(5)
(5) ). Since the steady flow seepage of fluid obeyed Darcy’s law
(Pham-Van et al., Citation2011), the second-order derivative of the equation revealed that the pore pressure distribution around the wellbore was controlled by the Laplace equation as:
(7)
(7) Once wellbore pressure
and pore pressure
at outer boundary
had been determined, Equation (Equation6
(6)
(6) ) was solved in polar coordinates. The pore pressure distribution
around the wellbore under steady-state flow conditions was obtained as (Haimson, Citation1968):
(8)
(8) By introducing the pore pressure distribution around the wellbore in Equation (Equation8
(8)
(8) ) into Equation (Equation3
(3)
(3) ), the poroelastic stress
caused by pore pressure change at each point under steady flow of fluid was obtained as:
(9)
(9) To solve stress equilibrium Equations (Equation5
(5)
(5) ) and (Equation6
(6)
(6) ), the stress–strain constitutive equation proposed by Rice and Cleary (Citation1976) was applied, which used pore pressure and stress as the basic variables, as presented in Equation (Equation10
(10)
(10) ):
(10)
(10) where
is the shear modulus,
is Kronecker’s symbol, which is equal to 1 and 0 when i ≠ j and i = j, respectively, and
and
are displacements.
By bringing Equation (Equation10(10)
(10) ) into Equation (Equation5
(5)
(5) ), the pore pressure gradient, i.e. seepage force, became the cause of rock deformation and caused the stress balance to be broken.
(11)
(11) In this case, the pore pressure gradient acts on the rock around the wellbore as a body force. To solve Equation (Equation11
(11)
(11) ), we defined the boundary conditions of the physical model shown in Figure as follows:
(12)
(12) Under the assumption of the generalized plane strain condition and using conformal transformation and complex potential, the analytical solution of the seepage stress field around the vertical wellbore was obtained as:
(13)
(13) Failure of a porous medium is controlled by the Terazaghi’s effective stress (Terazaghi, Citation1965).
(14)
(14) where
is total stress,
is Biot’s constant, and
is effective stress.
For a wellbore, the superposition principle is the most frequently used method for calculating the effective circumferential stress distribution. When the reservoir is impermeable,
in a vertical borehole is expressed as follows:
(15)
(15) When the fluid seepage into the reservoir and the poroelastic stress formed by the change of pore pressure is considered, this can be expressed as:
(16)
(16) When the coupling of seepage force and rock deformation is considered, the circumferential stress can be expressed as:
(17)
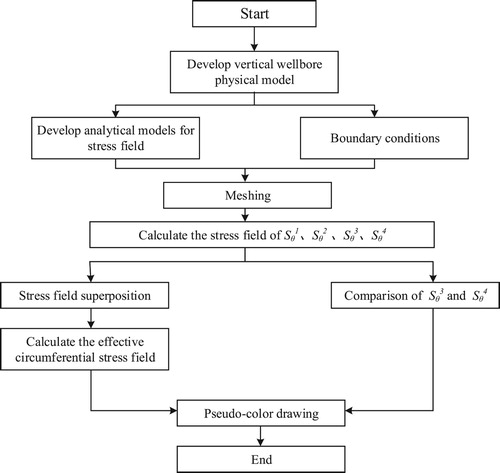
(17) The effective circumferential stress fields of four different cases shown in Equations (1) and (15)–(17) in this paper have been numerically simulated by MATLAB® (Figure ). The results are discussed in Sections 3, 4 and 5.
Figure 3. Flowchart of stress field around the wellbore calculation by MATLAB.
3. Comparison of circumferential stress fields  and
and
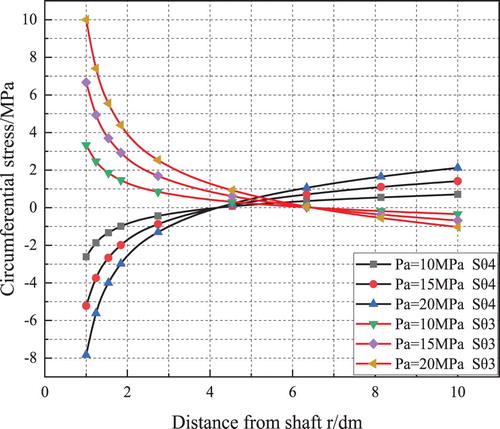
3.1. Different wellbore pressures
To understand the circumferential stress fields created by seepage force and poroelastic stress, circumferential stress fields of and
under different wellbore pressures were analyzed and compared. In this case, the variation of pore pressure around the wellbore with the change in wellbore pressure was observed to be a heterogeneous process. The simulation conditions are shown in Table .
Table 1. Simulation conditions in Section 3.1.
From Figures and , it can be seen that under different wellbore pressures, was positive and was manifested as circumferential compressive stress, while
was negative near the wellbore and was manifested as circumferential tensile stress.
and
tended to zero with increasing distance from the wellbore and the circumferential stress directions of
and
near the outer boundary were reversed, but the stress value was still much lower than that near the wellbore. Furthermore, both
and
around the wellbore were significantly increased with the increase in wellbore pressure. Based on the maximum circumferential stress criterion, circumferential tensile stress helped the tensile failure of rock. Therefore, it was concluded that the circumferential stress
near the wellbore was not favorable to the tensile failure of rock, while
induced by the seepage force helped rock failure, and the effect of seepage force became more obvious with the increasing wellbore pressure.
Figure 4. Distribution of circumferential stresses and
under different wellbore pressures.
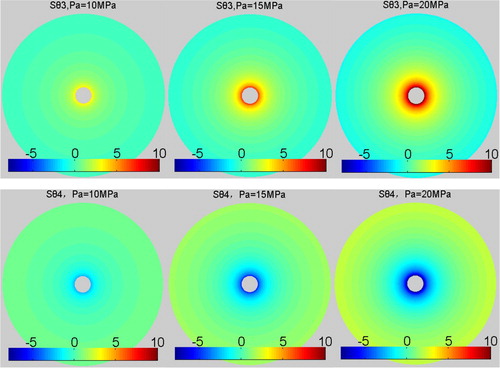
Figure 5. Variation of and
with radius at different wellbore pressures (θ = 0).
3.2. Uniform increase in pore pressure
To further understand the seepage force and poroelastic stress, we compared the changes in and
when the pore pressure at each point increased uniformly. We also investigated the variation of circumferential stress with radius at different times of
and
along the θ = 0 direction, as shown in Figure . The pore pressure at each point from the initial moment was uniformly increased by 5 MPa/s. The simulation conditions are shown in Table .
Table 2. Simulation conditions in Section 3.2.
As shown in Figures and , did not change with the uniform increase in pore pressure, while
was significantly increased with the uniform increase in pore pressure. This was mainly because
was the circumferential stress created by the pore pressure gradient during fluid seepage, while
was the circumferential stress created by the pore pressure change at each point. When the pore pressure at each point was uniformly increased at a constant rate, the pore pressure gradient was not changed but the value of the pore pressure at each point was increased. Therefore, when the pore pressure was uniformly increased,
was not changed while
presented sharp changes. Figure indicates that the pore pressure distribution
was greatly changed near the wellbore wall but was slightly changed some distance away from the wellbore, which complied with the variation of
and
. Since the variation of pore pressure the near the wellbore wall was larger than that in the far regions, the variation of
near the wellbore wall was more significant. The pore pressure gradient near the wellbore was obviously larger than that far away within the same
range; thus,
changed more intensely near the wellbore.
Figure 6. Pseudo-color maps of and
and pore pressure distribution of p(r) at different times.
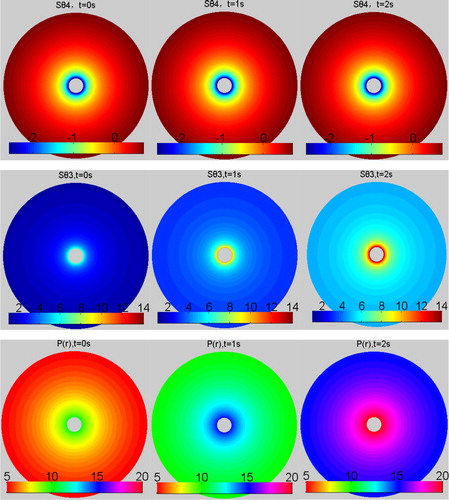
Figure 7. Distribution curves of and
along the direction of
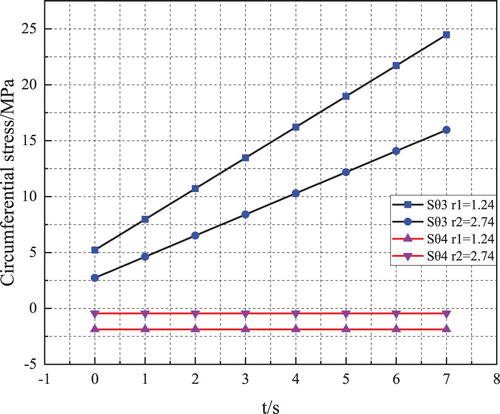
= 0 at different times.
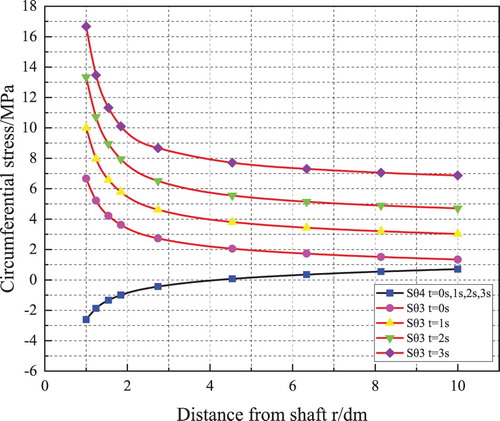
We took two arbitrary points, r1 and r2, to observe the variations of and
with the uniform increase in pore pressure at each point. From Figure , it was observed that
was not changed without the change in pore pressure gradient.
at r1 and r2 was linearly increased with the uniform increase in pore pressure. Although the slope of the linear increment at different points was not consistent, it was obvious that stress values were linearly increased under the increment of pore pressure.
Figure 8. Variation of and
over time at different radii (r1 = 1.24, r2 = 2.74).
4. Comparison of effective circumferential stress field under different conditions
To analyze the influence of seepage force on reservoir stress fields around the wellbores, MATLAB software was used to simulate and calculate the distribution of effective circumferential stress in reservoirs under four different conditions, as shown in Figure . The simulation conditions are shown in Table .
Figure 9. Pseudo-color map of effective circumferential stress distribution around the wellbore under different conditions.
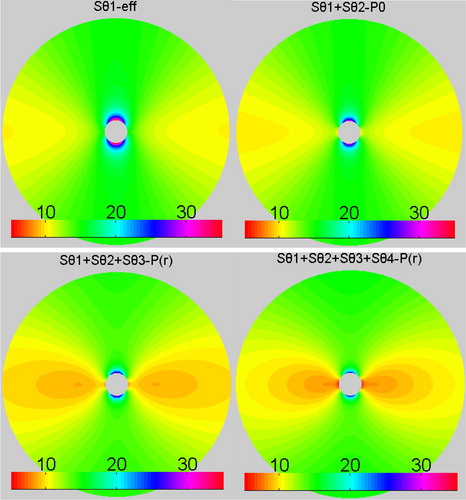
Table 3. Simulation conditions in Section 4.
As shown in Figure , the effective circumferential stress caused by in-situ stress alone created a stress concentration at the wellbore wall, with the maximum and minimum stresses following the S22 and S11 directions, respectively. The stress concentration gradually disappeared as the distance from wellbore wall increased and the stress along the S11 direction was always lower than that in the S22 direction. As a result, the initiation and extension direction of fractures had to be perpendicular to that of the minimum horizontal total principal stress, which was in line with conventional understanding. When wellbore pressure was considered, the stress concentration around the wellbore wall was obviously weakened and effective circumferential stress along the S11 direction was significantly decreased regardless of whether fluid seepage was considered or not. The effect of fluid seepage was more significant than when fluid seepage was not considered. In all pseudo-color maps, red blocks along the S11 direction around the wellbore wall were the darkest, which means that the effective circumferential stress there was smallest when steady fluid seepage and seepage force were taken into account. The conventional maximum circumferential stress criterion assumes that tensile fracture initiation occurs when the effective circumferential stress
reaches the tensile strength of rock on the borehole wall (Haimson & Fairhurst, Citation1969a; Hubbert & Willis, Citation1972). The tensile strength of the well wall is generally 0 MPa, so the closer
is to 0 MPa, the more likely it is that the well wall will fracture. Therefore, it was seen that when wellbore pressure was imposed, fluid seepage into the reservoir and the presence of seepage force were obviously more conducive to fracture formation.
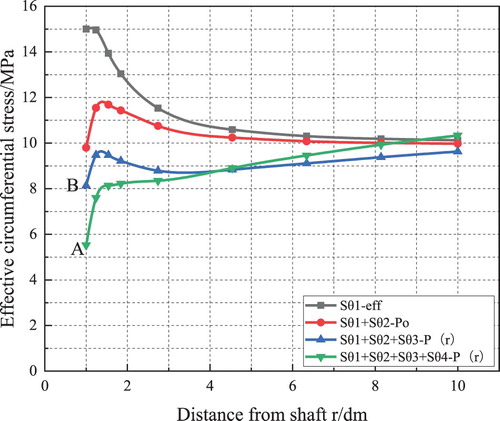
The distribution curves of effective circumferential stress along the direction of = 0 under four different conditions were compared, as shown in Figure . The numerical simulation results show that regardless of whether seepage was considered or not, imposing pressure on the wellbore significantly decreased the effective circumferential stress at the wellbore wall compared with the situation when only in-situ stress was present. The effect of wellbore pressure gradually decreased as the distance from wellbore wall increased. Near the wellbore, fractures were generally created along with the directions of
= 0 and
= π. As shown in Figure , effective circumferential stress near the wellbore was lower when fluid seepage into the reservoir occurred. Thus, fluid seepage was obviously beneficial to fracture formation. Besides, effective circumferential stress along the direction of
= 0 was significantly reduced by seepage force near the wellbore wall (point A was 32% lower than point B). In short, the seepage force significantly increased the possibility of reservoir fracture at the wellbore wall.
Figure 10. Effective circumferential stress distribution curves along the direction of = 0 under different conditions.
5. Comparison of effective circumferential stress field under different permeabilities
Since the pore pressure gradient formed in the same range near the wellbore varied with reservoir permeability, we simulated the distribution of effective circumferential stress around the wellbore under different permeabilities and analyzed the variation of
with radius along the direction of
= 0. The simulation conditions are shown in Table .
Table 4. Simulation conditions in Section 5.
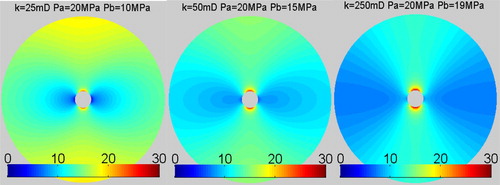
As shown in Figure , the effective circumferential stress curves of reservoirs with different permeabilities along the direction of = 0 intersected at one point. Before this point, seepage force had strong effects on the effective circumferential stress field around the wellbore. As a result of the maximum pore pressure gradient and strongest seepage force in low-permeability reservoirs, the smallest effective circumferential stress was obtained near the wellbore wall (point A was 49% lower than point B and 64% lower than point C), which illustrates the importance of seepage force in low-permeability reservoirs. After this point, pore pressure had stronger effects on the effective circumferential stress field. For reservoirs with high permeability, the pore pressure gradient was small while the pore pressure at each point was large. Therefore, the effective circumferential stress at areas far from the wellbore wall was smaller than in low- and medium-permeability reservoirs. It can be observed in Figure that along the S11 direction, the dark blue area of low effective circumferential stress in low-permeability reservoirs is near the well wall, and the dark blue area with low effective circumferential stress in high-permeability reservoirs is far from the well wall. According to the maximum circumferential stress criterion, this indicates that the low-permeability reservoir was likely to fracture in areas near the wellbore wall, while the high-permeability reservoir was more likely to fracture in areas far from the wellbore wall.
Figure 11. Distribution of with radius along the direction of
= 0 for reservoirs with different permeabilities.
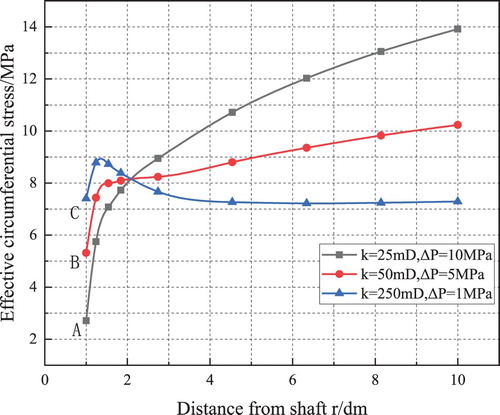
Figure 12. Pseudo-color map of distribution of in reservoirs with different permeabilities.
6. Conclusions
Based on the porous medium theory, the analytical solution of circumferential stress field caused by the seepage force was obtained around a vertical wellbore. The effect of seepage force on the stress field around the wellbore was analyzed by superposing the solution with a traditional computational model. The following results were obtained:
When the fluid is flowing in a steady state in the reservoir, the circumferential stress field
When wellbore pressure increases and reservoir pore pressure varies non-uniformly,
The distribution of pore pressure
Fluid flow into the reservoir pores is significantly beneficial for reducing the stress concentration around the wellbore. Effective circumferential stress
For reservoirs with different permeabilities, the effective circumferential stress curves along the direction of
Under the condition of steady flow, the mechanism of the effect of seepage force on the stress field around the wellbore has been analyzed in this paper. In the future, we will further study the mechanism of seepage force on fracture initiation in hydraulic fracturing and analyze the influence of seepage force on the formation of fracture pressure in different strata.
Acknowledgments
The authors acknowledge the National Natural Science Foundation of China and the Ministry of Science and Technology of China for their support of this research.
Disclosure statement
No potential conflict of interest was reported by the authors.
Additional information
Funding
References
- Aadnoy, B. S., & Belayneh, M. (2009). A new fracture model that includes load history, temperature, and Poisson’s effects. Society of Petroleum Engineers.https://doi.org/10.2118/114829-MS.
- AlKhafaji, H., Imani, M., & Fahimifar, A. (2020). Ultimate bearing capacity of rock mass foundations subjected to seepage forces using modified Hoek–Brown criterion. Rock Mechanics and Rock Engineering, 53(1), 251–268. https://doi.org/10.1007/s00603-019-01905-6.
- Chatterjee, R., & Mukhopadhyay, M. (2003, January 1). Numerical modelling of stress around a wellbore. Society of Petroleum Engineers.
- Cobbold, P. R., & Rodrigues, N. (2007). Seepage forces, important factors in the formation of horizontal hydraulic fractures and bedding-parallel fibrous veins (‘beef’ and ‘cone-in-cone’). Geofluids, 7(3), 313–322. https://doi.org/10.1111/j.1468-8123.2007.00183.x
- Do, D. P., Tran, N. H., Dang, H. L., & Hoxha, D. (2019). Closed-form solution of stress state and stability analysis of wellbore in anisotropic permeable rocks. International Journal of Rock Mechanics and Mining Sciences, 113, 11–23. https://doi.org/10.1016/j.ijrmms.2018.11.002
- Haimson, B. (1968). Hydraulic fracturing in porus and nonporus rock and its potential for determining in-situ stresses at great depth. University of Minnesota, Minneapolis, School of Mineral and Metallurgical Engineering.
- Haimson, B., & Fairhurst, C. (1967). Initiation and extension of hydraulic fractures in rocks. Society of Petroleum Engineers Journal, 7(03), 310–318. https://doi.org/10.2118/1710-PA
- Haimson, B., & Fairhurst, C. (1969b). In-situ stress determination at great depth by means of hydraulic fracturing. In The 11th US symposium on rock mechanics (USRMS) (pp. 559–584). American Rock Mechanics Association.
- Haimson, B., & Fairhurst, C. (1969a). Hydraulic fracturing in porous-permeable materials. Journal of Petroleum Technology, 21(07), 811–817. https://doi.org/10.2118/2354-PA
- Hubbert, M. K., & Willis, D. G. (1972). Mechanics of hydraulic fracturing.
- Ito, T. (2008). Effect of pore pressure gradient on fracture initiation in fluid saturated porous media: Rock. Engineering Fracture Mechanics, 75(7), 1753–1762. https://doi.org/10.1016/j.engfracmech.2007.03.028
- Ito, T., & Hayashi, K. (1991). Physical background to the breakdown pressure in hydraulic fracturing tectonic stress measurements. In International Journal of Rock Mechanics and Mining Sciences & Geomechanics Abstracts (Vol. 28, pp. 285–293). Pergamon.https://doi.org/10.1016/0148-9062.
- Kiss, A., Fruhwirth, R. K., Pongratz, R., Maier, R., & Hofstätter, H. (2018). Formation breakdown pressure prediction with artificial neural networks. Society of Petroleum Engineers. https://doi.org/10.2118/191391-18IHFT-MS.
- Lanzoni, L., Radi, E., & Nobili, A. (2018). Stress and pressure fields around two wellbores in a poroelastic medium. Meccanica, 53(3), 639–657. https://doi.org/10.1007/s11012-017-0683-4
- Liu, X. X., & Chiew, Y. M. (2012). Effect of seepage on initiation of cohesionless sediment transport. Acta Geophysica, 60(6), 1778–1796. https://doi.org/10.2478/s11600-012-0043-7
- Medlin, W. L., & Masse, L. (1979). Laboratory investigation of fracture initiation pressure and orientation. Society of Petroleum Engineers Journal, 19(02), 129–144. https://doi.org/10.2118/6087-PA
- Mourgues, R., & Cobbold, P. R. (2003). Some tectonic consequences of fluid overpressures and seepage forces as demonstrated by sandbox modelling. Tectonophysics, 376(1-2), 75–97. https://doi.org/10.1016/S0040-1951(03)00348-2
- Muqtadir, A., Elkatatny, S., Mahmoud, M., Abdulraheem, A., & Gomaa, A. (2018). Effect of the type of fracturing fluid on the breakdown pressure of tight sandstone rocks. In SPE Kingdom of Saudi Arabia annual technical symposium and exhibition. Society of Petroleum Engineers.https://doi.org/10.2118/192365-MS.
- Pan, Q., Xu, J., & Dias, D. (2017). Three-dimensional stability of a slope subjected to seepage forces. International Journal of Geomechanics, 17(8), 04017035. https://doi.org/10.1061/(ASCE)GM.1943-5622.0000913
- Perazzelli, P., Leone, T., & Anagnostou, G. (2014). Tunnel face stability under seepage flow conditions. Tunnelling and Underground Space Technology, 43, 459–469. https://doi.org/10.1016/j.tust.2014.03.001
- Pham-Van, S., Hinkelmann, R., Nehrig, M., & Martinez, I. (2011). A comparison of model concepts and experiments for seepage processes through a dike with a fault zone. Engineering Applications of Computational Fluid Mechanics, 5(1), 149–158. https://doi.org/10.1080/19942060.2011.11015359
- Qi, D., Li, L., & Jiao, Y. (2018). The stress state around an elliptical borehole in anisotropy medium. Journal of Petroleum Science and Engineering, 166, 313–323. https://doi.org/10.1016/j.petrol.2018.03.013
- Rice, J. R., & Cleary, M. P. (1976). Some basic stress diffusion solutions for fluid-saturated elastic porous media with compressible constituents. Reviews of Geophysics, 14(2), 227–241. https://doi.org/10.1029/RG014i002p00227
- Rozhko, A. (2007). Role of seepage forces on hydraulic fracturing and failure patterns (Doctoral dissertation, Université Joseph-Fourier-Grenoble I). https://www.semanticscholar.org/paper/Role-of-seepage-forces-on-hydraulic-fracturingand-Rozhko/b6076d76d86f9ec9399b706b9eda2f3b7865f256
- Rozhko, A. Y. (2008). Benchmark for poroelastic and thermoelastic numerical codes. Physics of the Earth and Planetary Interiors, 171(1-4), 170–176. https://doi.org/10.1016/j.pepi.2008.08.016
- Rozhko, A. Y., Podladchikov, Y. Y., & Renard, F. (2007). Failure patterns caused by localized rise in pore-fluid overpressure and effective strength of rocks. Geophysical Research Letters, 34(22). https://doi.org/10.1029/2007GL031696
- Rummel, F. (1987). Fracture mechanics approach to hydraulic fracturing stress measurements. Fracture Mechanics of Rock, 217, 221–245. https://doi.org/10.1016/C2009-0-21691-6.
- Song, J., Yuan, Y., Gu, S., Yang, X., Yue, Y., Cai, J., & Jiang, G. (2017). 2D numerical simulation of improving wellbore stability in shale using nanoparticles based drilling fluid. Energies, 10(5), 651. https://doi.org/10.3390/en10050651
- Taylor, D. W. (1948). Fundamentals of soil mechanics (Vol. 66, No. 2, p. 161). LWW.
- Terazaghi, K. (1965). Theoretical soil mechanics. Wiley.
- Terazaghi, K., Peck, R. B., & Mesri, G. (1996). Soil mechanics in engineering practice. Wiley.
- Timoshenko, S., & Goodier, J. N. (1951). Theory of elasticity. McGraw-Hill Book Co. 1110, 78.
- Wang, W., Yuan, B., Su, Y., Sheng, G., Yao, W., Gao, H., & Wang, K. (2018). A composite dual-porosity fractal model for channel-fractured horizontal wells. Engineering Applications of Computational Fluid Mechanics, 12(1), 104–116. https://doi.org/10.1080/19942060.2017.1348992
- Yang, L., Chuanliang, Y., Yuanfang, C., Songcai, H., Qi, G., & Jia, W. (2019, August). Numerical simulation of wellbore stability in frozen soil during drilling operation. In 53rd US rock mechanics/geomechanics symposium. American Rock Mechanics Association.