
 ?Mathematical formulae have been encoded as MathML and are displayed in this HTML version using MathJax in order to improve their display. Uncheck the box to turn MathJax off. This feature requires Javascript. Click on a formula to zoom.
Abstract
Ploughbreast is the crucial soil-engaging component of horizontally reversible plough (HRP). Its biggest merit, compared to conventional ploughs, is to enable the ploughbody to perform alternative and shifting tillage operations with high speeds. A major technical challenge in the aforementioned operation is violent flowing interaction between soil and ploughbreast. This flowing interaction may result in severe wear rate on the ploughbreast, particularly along its cutting edge, i.e. ploughshank, thereby reducing the tool life. The objective of the present paper is to evaluate influences of the flowing interaction on the ploughshank by studying interaction force, wear rate and their correlation. The interaction forces were predicted using a numerical calculation with finite volume approach in computational fluid dynamics (CFD) software. The wear rates were measured using scanning electron microscope (SEM). There were very good qualitative agreements between numerical and experimental results that either the maximum force or the most severe wear rate appears at the same section and has a direct relationship with the Tillage speed and tilling depth. Closer examination of the calculated and measured confirms that the more violent sliding & rubbing, the greater stress gradient and the larger abrupt stress cause the more severe wear rate along the ploughshank.
1. Introduction
Tillage is one of the important field operations for the production of agricultural crops. This is because it can loosen, move, and mix the soil, thereby improving the soil physical state and structure, and creating an appropriate bed for plant growth (Kursat Celik et al., Citation2020). The common tillage tool is the mouldboard plough, whose crucial soil-tilling components are ploughshare, particularly its sharepoint, and mouldboard, particularly ploughshank of its ploughbreast (Ibrahmi et al., Citation2015). More generally, the mouldboard plough in the tillage operations necessitates much energy to rearrange seedbeds, thereby causing the violent flowing interaction between soil and tool (Singh et al., Citation2020). This interaction is surely detrimental to the tool performance and even has serious consequences for the tool life. Hence, development of the mouldboard plough with high tillage performances is essential to improve the crop production.
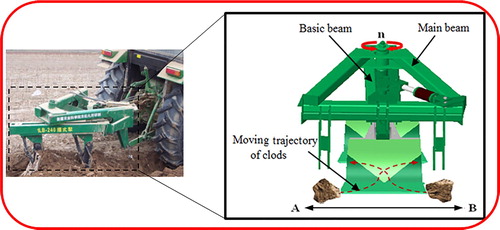
1LB-240 HRP is a novel tillage tool widely used around China (Zhu, Peng et al., Citation2016). Its biggest merit, in comparison to conventional ploughs, is the use of remote cylinder (RC) to drive the ploughbody to perform alternative shifting tillage operations while the HRP is towing forward by a tractor (). Note that this shifting operation actually indicates a tillage behavior of HRP, in which the ploughbody may be shifted alternatively between one tillage position and the other, for instance, between A and B in (Zhu, Cheng et al., Citation2016). In this figure the pink dashed curves present the hypothesized trajectories of soil flowing over the ploughsurface; the ‘n’ denotes the angular velocity of the ploughbody (Zhu et al., Citation2017).
Figure 1. Alternative shifting tillage behaviors of HRP.
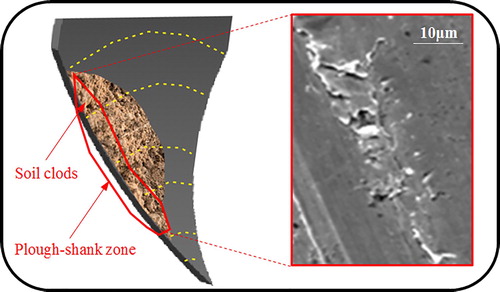
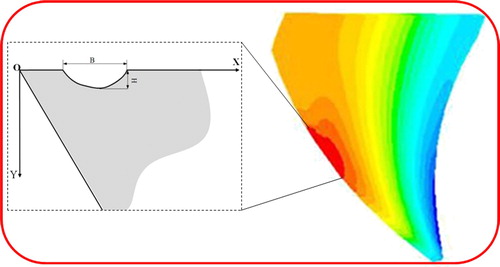
For the HRP, a major technical challenge is prone to produce the violent soil-tool interaction, which can lead to severe wear rates on the ploughshare, particularly its sharepoint, and the mouldboard, particularly ploughshank of its ploughbreast, respectively (Zhu, Cheng et al., Citation2016). schematically illustrates the wear rates on the cutting edge of ploughbreast, i.e. the ploughshank. As observed, there is abrasion/attrition wear along the ploughshank, the intermediary area of which has the most severe wear rates. The intense wear rate changes the geometric shape of ploughbody, thereby affecting tillage quality and even reducing the plough life (Abu-Hamdeh & Reeder, Citation2003). The wear rate on the ploughbody is strongly associated with the abrasion between hard soil particles and ploughsurface; and the abrasive is dependent of their flowing interaction force (Bobobee et al., Citation2007). For this reason, a careful study of the flowing interaction mechanism between soil and ploughbreast as well as its effects on the ploughshank, is of great importance for improving the HRP tillage performances.
Figure 2. SEM micrograph of worn ploughshank section of ploughbreast at tillage speed 6 km/h and tilling depth 0.270 m after 50 ha was ploughed. The yellow dotted curves indicate soil moving trajectories.
For the investigation of the interaction forces on the ploughsurface, a combined experimental, analytical, and numerical approach has been developed based on soil mechanics. The main approaches available are empirical/semi empirical solutions (Luth & Wismer, Citation1971), dimensional technique (Kushwaha & Zhang, Citation1998), finite element analysis (FEA) (Ibrahmi et al., Citation2015), discrete element method (DEM) (Shmulevich, Citation2010) and CFD (Karmakar & Kushwaha, Citation2006). The dominant merit of the CFD, in comparison to the other methods, is to apply the more real soil parameters (such as size and configuration) to predict the interaction force, thereby attaining the more adequate soil-tool interactions (Barker, Citation2008). Karmakar, Baker and Guo & Yu et al. ever simulated the soil reaction forces by CFD modeling, but their research objects were either just a flat plate, rather different from the tool presented here (Barker, Citation2008; Guo & Yu, Citation2017; Karmakar & Kushwaha, Citation2006). Different geometric shape of the ploughbody contributes to different interaction forces over its surface (Gill & Vanden Berg, Citation1967). In this regard, the aforementioned CFD simulations may not be used to accurately explain the flowing interaction mechanism between soil and ploughbreast as well as evaluate the effects on the tool performances. Following this CFD numerical approach, we have ever numerically investigated the flowing interaction between soil and ploughbreast at the various tillage speeds (such as 5, 6, 7, and 8 km/h) and tilling depths (such as 0.27, 0.315, and 0.360 m) (Zhu, Cheng et al., Citation2016). However, to the author’s knowledge, the comparison of experimental findings with past CFD simulation results, particularly the relationship between the greatest interaction force and the severest wear rate, does not appear to be available in the literature.
The objective of this study is to evaluate the effects of flowing interaction between soil and tool on the ploughbreast performances by comparing the greatest interaction force and the severest wear rate along the ploughshank. The detailed structure of this paper is depicted below: the interaction forces by CFD simulations are briefly shown, and subsequently the wear rates by using SEM measurements in the field experiment are addressed in Section 2. The CFD based predictions and the SEM based evidences are qualitatively compared in Section 3. The underlying mechanism involved in flowing interaction of the cutting edge of ploughbreast with soil in the HRP shifting tillage operations is presented in Section 4. Note that in this study the maximum interaction force and the severest wear rate along the ploughshank are indicated by the maximum force per unit area and the most severe worn land area, respectively.
2. Materials and methods
2.1. CFD prediction of interaction force
2.1.1. CFD model
Scanning technique was used to attain the geometrical data of ploughbreast through a 3D touch-probe measuring bench (Explorer, Qindao, China) and subsequently SoildWorks (Dassault Systemes SolidWorks Inc., USA) and ANSYS Fluent (ANSYS Inc., USA) were applied for the plough-breast solid model construction and computational fluid dynamics analysis, respectively. Detailed modeling procedure and geometrical data are available in Ref. (Zhu, Cheng et al., Citation2016). schematically illustrates the solid ploughbreast model and CFD mesh, which is composed of 6615 tetrahedral cells. The material used for the plough-breast is alloy steel.
Figure 3. Ploughbreast used in this study.
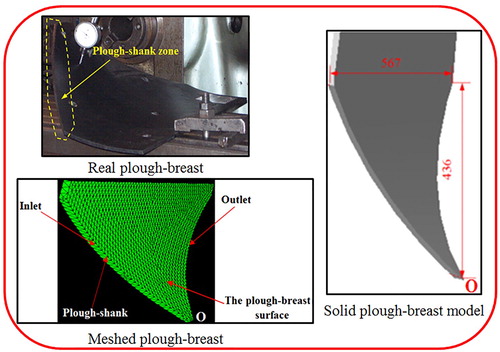
The boundary conditions used for CFD simulations were based on the real tillage scenario involved in this study (Figures and ). This tillage scenario was ploughbody alternative shifting between right and left. During the tillage process, the ploughbreast was considered to be a stationary tool within the soil-tool interaction domain, as shown by the yellow dotted curves. The interaction area was measured as 0.0924 m2. The curves denoted the hypothesized trajectories of the soil flowing over the ploughbreast. According to , the detailed boundary conditions used for the ploughbreast were (1) an inlet velocity vertical to the ploughshank, (2) an outflow pressure applied for the outlet, (3) no slip existing over the tool bottom and sides and (4) free-surface grid moving within the entire tool surface ().
Figure 4. Flowing interaction between soil and ploughbreast.
2.1.2. Soil model
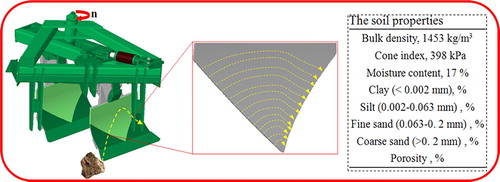
The soil model was constructed in accordance with the soil properties used in this study. The soil herein is sandy loam soil in Xinjiang of China. Its primary property parameters were determined by the following approaches: the bulk density and cone index were measured by using a portable soil viscometer (TM-85, Hebei of P.R. China); the moisture content was measured with the established method of specimen weighting before and after drying in a special furnace (HY-35KW, Zhongshan of P.R. China); and the texture was taken from (Li et al., Citation2007). The primary information on the used soil is schematically illustrated in .
According to the soil parameters in , the soil for calculations was considered to be Bingham material (Asl et al., Citation2020). The characteristics of this material are incompressible, isotropic and homogeneous. The generalized stress–strain rate of the Bingham material is (Barker, Citation2008):
(1)
(1)
(2)
(2) where
is shear stress,
is shear rate,
is yield strength,
is plastic viscosity.
For the Bingham model, there is an important aspect to note that the Bingham model for simulations needs regularizing in order not to produce the viscosity divergence at zero strain rate. This is basically due to the fact that the model is unable to be applied for the case of the viscosity infinity without regularization. Detailed information on regularization is available in the work of O’Donovan and Tanner (Citation1984) and Papanastasiou and Boudouvis (Citation1997). In addition, since the volume fraction, including soil, water and air was involved in this study, the multiphase fluid dynamics approach should have been employed in numerical simulations. The reason why the single-phase laminar flow was used herein is that Karmakar et al. have demonstrated its effectiveness as a result of the high molecular weight (Karmakar & Kushwaha, Citation2006).
2.1.3. CFD based load analysis
A combined mass conservation and momentum conservation equations was devoted to the soil-tool interaction due to their effectiveness for any fluid flow (Riahi-Madvar et al., Citation2019). Control volume approach was adopted to calculate the interaction forces over the ploughbreast in ANSYS Fluent 14.0 (ANSYS, Inc., Canonsburg, PA, USA). The crucial dynamic parameters of the soil, i.e. yield stress and viscosity, were experimentally determined with a soil torsional rheometer (Zhu et al., Citation2008). The corresponding values were measured as 15.5 and 167 kPa·s, respectively. The other two important variables, or the moisture content and core index listed in , were also considered, plausibly due to their strong dependent of the yield stress and viscosity. Isothermal conditions were applied for all simulations because this study was primarily focused on the effects of flowing interaction between soil and tool on the ploughshank. Note that the influences of the tilling depth on the flowing interaction were quantitatively determined by means of the draft force equation for the HRP (Zhu et al., Citation2008). For all calculations, the condition that all residuals are less than a certain value, e.g. 1.0 × 10⁻⁵ was considered to be converged.
2.1.4. Load analysis results
Flowing interaction forces over the ploughbreast under the three varying tillage speeds (such as 5, 6, and 7 km/h) and tilling depths (such as 0.270, 0.315, and 0.360 m) are presented, respectively.
2.1.4.1. Effects of the tilling depth
Figures – illustrate the effect of the tilling depth on the interaction force in the ploughbreast at a specified tillage speed. From the numerical observations, all the maximum forces appear along the ploughshank, particularly at its intermediary section. This section approximately lies between point A and B of the ploughshank, which are 0.12 and 0.17 m away from the origin O of the coordinate system, respectively ().
Figure 5. Interaction force profiles on the ploughbreast at a constant tillage speed 5 km/h and different tilling depths.
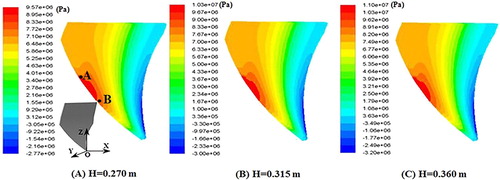
Figure 6. Interaction force profiles on the ploughbreast at a constant tillage speed 6 km/h and different tilling depths.
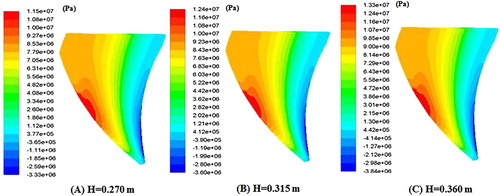
Figure 7. Interaction force profiles on the ploughbreast at a constant tillage speed 7 km/h and different tilling depths.
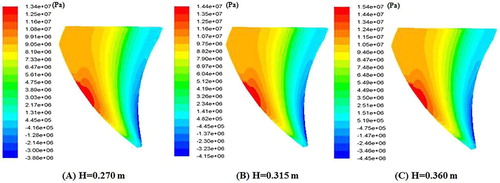
At the specified tillage speed, the greatest force on a unit area (m2) along the ploughshank is increased from 9.57, 11.5, 13.4 MPa to 11.0, 13.3, 15.4 MPa with an increase in tilling depth from 0.27 to 0.36 m. The corresponding growth rates are 14.94%, 15.65%, and 14.93%, respectively. This could indicate the significant effect of the tilling depth on the interaction force along the ploughshank in the shifting tillage operations of HRP.
2.1.4.2. Effects of the tillage speeds
For the constant tilling depth, a higher tillage speed results in a larger interaction force along the ploughshank, as shown in Figures –. From this numerical analysis, it is noted that the greatest forces are all located at the intermediary area of ploughshank, which is very similar to the effect of the tilling depth.
Figure 8. Interaction force profiles on the ploughbreast at a constant tilling depth 0.270 m and different tillage speeds.
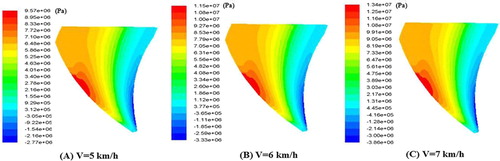
Figure 9. Interaction force profiles on the ploughbreast at a constant tillage depth 0.315 m and different tilling speeds.
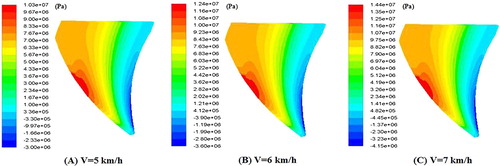
Figure 10. Interaction force profiles on the ploughbreast at a constant tilling depth 0.360 m and different tillage speeds.
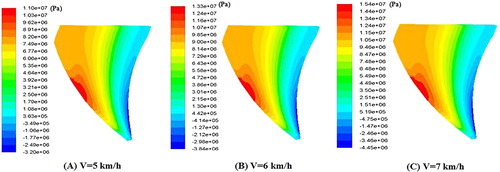
At the specified tilling depth, the maximum forces on a unit area (m2) along the ploughshank are observed to increase from 9.57, 10.3, 11.0 MPa to 13.4, 14.4, 15.4 MPa with the tillage speed increase. The related growth ratios are 40.0%, 39.8%, and 40.0%, respectively. In this regard, the tillage speed is demonstrated to have significant effects on the maximum force along the ploughshank.
The numerical results in Figures – predict the effects of the varying tillage speed and tilling depth on the flowing interaction between soil and ploughbreast. These numerical simulations agree well with the viewpoints of Coulomb’s passive earth pressure theory (Coulomb, Citation1776). These results may be due to the following reasons:
In terms of the tilling procedure of ploughbreast, so many soils enter the ploughbreast surface through the ploughshank, particularly its intermediary section, along which the severe flowing interaction occurs because of ploughshank inverting and cutting the soil layers.
In terms of the tilling behaviors of plough-breast, the soil-tool interaction encounters dynamics flow along the ploughshank (Asl et al., Citation2020; Zhu, Peng, et al., Citation2016). This flowing interaction leads to more violent as the tilling depth/ tillage speed is increased. Since this soil flow interaction is mainly due to the different stress value, the increased tilling depth/ tillage speed results in the greater stress gradient and the more abrupt stress along the ploughshank. Note that the above-mentioned different stress values are the ones between the stress acting on soil and the soil yield stress (Terzaghi, Citation1943; Veveakis & Poulet, Citation2020).
2.2. Field experiments
As depicted in Introduction Section, the flowing interaction between soil and tool contributes towards the abrasive wear, which is characterized by plastic deformations on the mutually sliding surface of the two bodies in contact. In this regard, the abrasive wear is produced by the load along the ploughshank, which is a predominant factor to induce plastic deformations. Following this idea, we evaluated the wear rates by measuring geometric changes of the ploughshank for qualitative validation of our CFD simulations. In this study the geometric changes were determined by the worn land variations measured by a scanning electron microscope. This is because this modern scanning technology can numerically model the worn component, which would be helpful to attain the detailed information on the wear morphology. Relevant knowledge of the geometric change and scanning electron microscope is available in (Cucinotta et al., Citation2019).
2.2.1. Materials, equipment, and methods
Field measurements were performed at an experimental farm of Xinjiang Agricultural University, Hutu-bi, China (43°46′N, 87°36′E), where the soil properties are the same as those in the CFD simulations (). For all field experiments, a tractor (JDT-654, Tian-Jin, P.R. China) was used to supply the HRP with powers; the size of the plot was 150 m long and 100 m wide, respectively; the plot was divided into 10 passes, in which the width of each pass was designated as 1.0 m based on the working width of HRP (Jiang et al., Citation2009). Considering the effects of soil condition variation (such as moisture content) on the measurements, we adopted the following method to reduce the influence that the plot was completely tilled toward a constant depth until 50 ha was finished ploughing. Indeed, the aforementioned approach was validated to be effective by (Emmanuel & Girma, 2007), which may be explained as due to the very small difference in tilling depth and also due to the most arid area where the experimental plot lies. The aforementioned two factors may cause the soil moisture to vary so marginally as to be negligible.
The tillage conditions for field experiment were the same as those for the CFD-based simulations in Section 2.1. The measurements on the worn land were concerned with its maximum worn breadth (B) and depth (H), as shown in . Based on the measured values, the worn land area was further calculated by multiplying worn breadth and depth. The equipment used for the measurements included a stereoscopic microscope (maximum 50-fold magnification, ZOOM500, Suzhou, China), a CCD camera (32.5 million pixel, Canon, EOS90D, Japan), a computer (8GB 2400 MHz DDR4, ThinkPad X13 Yoga, Jiangsu, China), image acquisition software (KEYENCE, Osaka, Japan), and a scanning electron microscope (SEM) (maximum 1,000,000-fold magnification, HITACHI, Regulus8100, Japan). Note that the CCD camera, computer and image acquisition software formed an image acquisition system used for the field test in this study.
Figure 11. Measured worn land along ploughshank section, B: worn breadth and H: worn depth.
The detailed procedures of the measurements are: firstly, the HRP tilled towards a constant depth, e.g. 0.270, 0.315, and 0.360 m until 50 ha was finished ploughing; then, the B and H along the ploughshank was measured by a stereoscopic microscope for five times, respectively; then, the microscope was linked into the image acquisition system for the wear rate images; then, a new ploughbody of the same type and another tillage condition were used to repeat the above test procedure; finally, all images obtained from the test were recorded in the SEM to understand tool wear behaviors (such as the maximum worn breadth and depth).
2.2.2. Wear morphology analysis results
2.2.2.1. Effects of the tilling depths
Figures – illustrate the wear morphologies along the ploughshank under the three varying tilling depths. From experimental observations, the most severe worn lands appear at the intermediary section of the ploughshank, where there exists Abrasion/attrition wear of alloy steel (the yellow rectangles). Note that the yellow rectangle areas presented here are all set identical in order to further implement the statistical quantitative comparison with the previous CFD simulations.
Figure 12. SEM views along the ploughshank section at a constant tillage speed 5 km/h and different tilling depths.
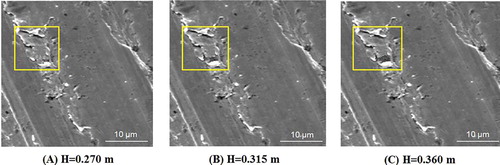
Figure 13. SEM views along the ploughshank section at a constant tillage speed 6 km/h and different tilling depths.
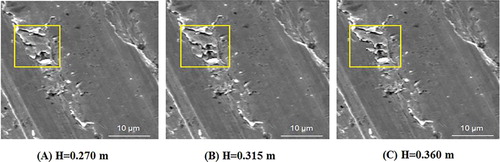
Figure 14. SEM views along the ploughshank section at a constant tillage speed 7 km/h and different tilling depths.
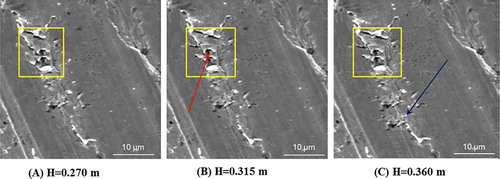
Comparison of (A) and (B) with (C) in Figures – shows that all the attrition lands are getting severer when the tilling depth is increased. For example, at the tillage speed of 7 km/h, as tilling depth increases, the intermediary area of the worn land undergoes more intense wear (the red arrow); furthermore new attrition area is observed at the ploughshank at the tilling depth 0.360 m (the blue arrow). In this regard, it is inferred that the increase in tilling depth can result in the more severe wear rate along the ploughshank and especially at the intermediary section.
2.2.2.2. Effects of the tillage speeds
Figures – illustrate the wear morphologies along the ploughshank area under the three varying tillage speeds. From these pictures, it is noted that the extensive attrition wear is found at the intermediary section of ploughshank, and that the greater tillage speed brings about the more severe wear rate.
Figure 15. SEM views along the ploughshank section at a constant tilling depth 0.270 m and different tillage speeds.
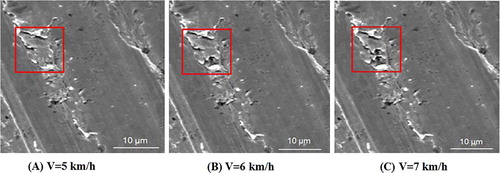
Figure 16. SEM views along the ploughshank section at a constant tilling depth 0.315 m and different tillage speeds.
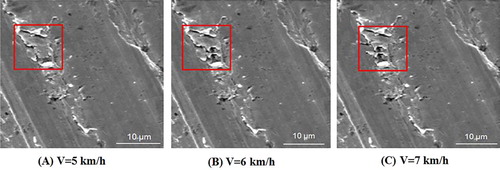
Figure 17. SEM views along the ploughshank section at a constant tilling depth 0.360 m and different tillage speeds.
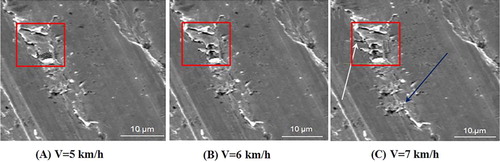
To take an example, at the constant tilling depth of 0.360 m, the comparison of (A) and (B) with (C) in indicates that the attrition at 7 km/h is more severe than those at 5 and 6 km/h (the red rectangle and the white arrow), and even more important at the intermediary area of ploughshank can new attrition be found (the blue arrow). Note that all the red rectangle areas are also set identical for the further statistical quantitative comparison with simulations in this study. From this analysis, it is inferred that the tillage speed strongly affects the abrasion /attrition along the ploughshank.
Seen from Figures –, the measurements in the field experiments demonstrate that either the greater tillage speed or the bigger tilling depth is actually accompanied with the severer wear rate along the ploughshank and particularly along its intermediary area. These phenomena may be brought about by the following facts:
For the wear morphologies along the ploughshank, it may be caused by the dynamic tillage behaviors of the ploughshank. These tillage behaviors (such as cutting, inverting soil clod) can lead to sliding interaction between ploughshank and soil clods and consequently rubbing occurs. This, in turn, results in wear morphologies along the ploughshank.
For wear rate variation under the effect of tilling depths, it may be attributed to the fact that the alternative shifting tillage operations of ploughbreast are prone to cause irregular soil flow, violent interrupted tilling and even vibration. These dynamic behaviors on the one hand tend to plough the tool material with flowing interaction, and on the other hand are getting more violent with increasing the tilling depth.
For wear rate variation under the effect of tillage speeds, it may be attributed to the fact that an increase in tillage speed on the one hand brings about an increase in cutting force at the ploughshank, which subsequently contributes to the more violent stagnation point and, hence, the larger soil stress concentration along the ploughshank; on the other hand increasing the tillage speed leads to a reduction in contact area between soil and tool, which, in turn, produce much violent soil disturbance and the larger loads on the ploughshank. These mechanical loads impact the surface integrity, and modify the residual stress distribution, thereby producing the mechanical fatigue on the ploughshank.
3. Validation
As proposed by (Bobobee & Gebresenbet, Citation2007; Natsis et al., Citation2008), the maximum force on the tool exerted by soil contributes to the most severe abrasive wear on its surface. Following this idea, this paper was concerned with the qualitative comparison of the numerical and experimental results, or with the qualitative correlation between the maximum load on the plough-breast and the most severe abrasive wear on its surface. For further quantitative comparison, the calculated and measured wear rate is now on-going and will be seen in the forthcoming days.
For the essential HRP tillage conditions examined in this study, with our study, we numerically and experimentally demonstrated that either the maximum load or the most severe wear rate appears at the intermediary area of ploughshank and furthermore it is becoming either larger or severer as the tilling depth/ tillage speed is increased. In an attempt to better qualitatively compare the calculations with the measurements, we further calculated the worn area of the identified zone at the ploughshank, as shown the yellow and red rectangles in Figures –, based on the previously measured maximum worn breadth and depth (); subsequently the statistical analyses of the relationship between the greatest load and the maximum worn area were carried out, as shown in Tables 1 and 2. Note that this maximum worn area is determined by the maximum worn breadth and depth, which are actually the mean values after the five-time field test. P-V and P-H in indicate the relationship between the maximum load () at the ploughshank and tillage speed (V) or tilling depth (H), respectively. S-V and S-H in denote the relationship between the mean worn land area (
) and tillage speed or tilling depth, respectively. According to the Tables and , we further presented the comparison of the variation trends between the calculated load and the measured worn land area ().
Figure 18. Comparison of the variation trends between calculated interaction force (/m2) and measured worn land area.
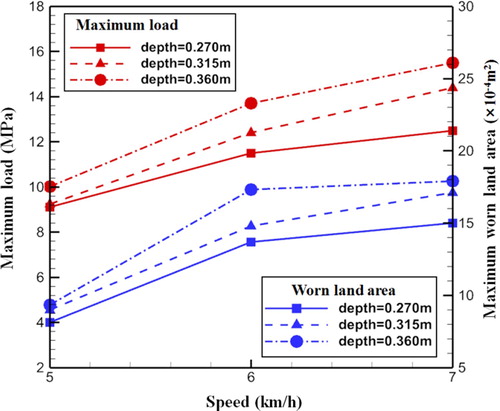
Table 1. Growth rates of the maximum loads (Pmax) on a unit area along the ploughshank for different tillage speeds (V) and depths (H).
Table 2. Growth rates of the measured mean worn-land areas (Smean) along the ploughshank for different tillage speeds (V) and depths (H).
From , it is observed that the simulations are qualitatively similar to measurements. The detailed is presented as follows: (1) the variation trends of the greatest force and the severest worn land along the ploughshank are in quite good agreement with each other at the same tillage conditions; (2) the greatest force is getting larger as increasing tillage speed or depth and (3) that the largest worn land area is aggravated is caused by the higher tillage speed and depth. From the viewpoint of Bobobee and Natsis et al., the CFD simulation results in Section 2.1 are consistent with the SEM measurements in Section 2.2. This qualitative similarity may be explained as due to the violent flowing interaction along the intermediary area of the ploughshank, which leads to the greater stress gradient and the more abrupt stress with the larger tilling depth/tillage speed. These stress gradient and abrupt stress impact the surface integrity and change the surface residual stress distribution, thereby producing the severe mechanical fatigue on the ploughshank.
4. Conclusions
In this study, a combined CFD simulation and SEM measurement approach is used to investigate the underlying mechanism involved in flowing interaction between soil and ploughshank in the high-speed shifting tillage operations of HRP. The ploughshank is the primary cutting edge of plough-breast. The study also understands the effect of critical operation parameters (such as tillage speed and tilling depth) on the ploughbreast performances. The major findings of this study can be summarized as follows.
The numerical results demonstrate that the greatest interaction forces occur at the intermediary area of ploughshank, and that these forces are increased with increasing the operation parameters.
The experimental tests prove that the severe wear rates appear along the intermediary area of ploughshank, and that they are becoming aggravated as the operation parameters are larger.
The study on flowing interaction mechanism reveals that the more violent sliding & rubbing, the larger stress gradient and abrupt stress contribute to the greater soil load and the severer wear rate at the ploughshank. The CFD based results are consistent with the SEM based evidences. Our findings show that either plough-breast design improvement or tillage parameter selection may aid in an ample variety of the HRP applications. The new findings in this study will be extended to the future work: some white materials are observed around the worn lands in Figures –. From the viewpoint of Material Mechanics, this phenomenon is likely due to the coupling effects of the thermal consequences caused by the high-speed shifting tillage operations, the underlying physical mechanism of which, however, is still unclear yet. Further work is now on-going to investigate this worn land with white materials along the ploughshank of the plough-breast.
Acknowledgements
We would like to thank the reviewers for their hard work. And also we acknowledge financial support for this work from the National Natural Science Foundation of China (Grant No. 51575003), the Key Research and Development Project of Anhui province (202004a06020015), the Opening Fund of the Anhui Province Engineering Laboratory of Intelligent Agricultural Machinery and Equipment, the Opening Fund of the national & local joint Engineering Lab for High Energy-Saving and Control (Grant No.KFKT201604), and Foundation Project of Technology Innovation for Graduate in Anhui Agricultural University (Grant No. 2020ysj- 72).
Disclosure statement
No potential conflict of interest was reported by the author(s).
Additional information
Funding
References
- Abu-Hamdeh, N. H., & Reeder, R. C. (2003). A nonlinear 3D finite element analysis of the soil forces acting on a disk plow. Soil and Tillage Research, 74(2), 115–124. https://doi.org/10.1016/S0167-1987(03)00152-1
- Asl, R. H., Salmasi, F., & Arvanaghi, H. (2020). Numerical investigation on geometric configurations affecting seepage from unlined earthen channels and the comparison with field measurements. Engineering Applications of Computational Fluid Mechanics, 14(1), 236–253. https://doi.org/10.1080/19942060.2019.1706639
- Barker, M. E. (2008). Predicting loads on ground engaging tillage tools using computational fluid dynamics [Dissertation thesis]. Gradworks. https://doi.org/10.31274/rtd-180813-17086
- Bobobee, E. Y. H., & Gebresenbet, G. (2007). Effect of cutting edge thickness and state of wear of ploughshare on draught force and heart rates of Sanga oxen in Ghana. Soil and Tillage Research, 95(1), 298–307. https://doi.org/10.1016/j.still.2007.01.006
- Bobobee, E. Y. H., Sraku-Lartey, K., Fialor, S. C., Canacoo, E. A., Agodzo, S. K., Yawson, A., & Gebresenbet, G. (2007). Wear rate of animal-drawn ploughshares in selected Ghanaian soils. Soil and Tillage Research, 93(2), 299–308. https://doi.org/10.1016/j.still.2006.05.004
- Coulomb, C. A. (1776). Essai sur une application des regles des maximis et minimis a quelues problemes de statique relatifs a l'architecture. Mem. Acad. Roy. Des Sciences, Paris, 3, p.38.
- Cucinotta, F., Scappaticci, L., Sfravara, F., Morelli, F., Mariani, F., Varani, M., & Mattetti, M. (2019). On the morphology of the abrasive wear on ploughshares by means of 3D scanning. Biosystems Engineering, 179(1), 117–125. https://doi.org/10.1016/j.biosystemseng.2019.01.006
- Gill, W. R., & Vanden Berg, G. E. (1967). Soil dynamics in tillage and traction. In: Agriculture Handbook No. 316. Agricultural Research Service, U.S. Department of Agriculture, 511.
- Guo, Y., & Yu, X. (2017). Comparison of the implementation of three common types of coupled CFD-DEM model for simulating soil surface erosion. International Journal of Multiphase Flow, 91(5), 89–100. https://doi.org/10.1016/j.ijmultiphaseflow.2017.01.006
- Ibrahmi, A., Bentaher, H., Hbaieb, M., Maalej, A., & Mouazen, A. M. (2015). Study the effect of tool geometry and operational conditions on mouldboard plough forces and energy requirement: Part 1. Finite element simulation. Computers and Electronics in Agriculture, 117(9), 258–267. https://doi.org/10.1016/j.compag.2015.08.006
- Jiang, Y. X., Niu, F. H., Chen, F., Wang, X. N., & Wang, Q. H. (2009). The development of 1LB-240 horizontal reversible plough. Agricultural Mechanization Research, 1, 82–84. (in Chinese).
- Karmakar, S., & Kushwaha, R. L. (2006). Dynamic modeling of soil–tool interaction: An overview from a fluid flow perspective. Journal of Terramechanics, 43(4), 411–425. https://doi.org/10.1016/j.jterra.2005.05.001
- Kursat Celik, H., Caglayan, N., Topakci, M., Rennie, A. E. W., & Akinci, I. (2020). Strength-based design analysis of a para-plow tillage tool. Computers and Electronics in Agriculture, 169(2). Article 105168. https://doi.org/10.1016/j.compag.2019.105168
- Kushwaha, R. L., & Zhang, J. (1998). Dynamic analysis of a tillage tool part 1–finite element model. Canada Agricultural Engineering, 40, 287–292.
- Li, M. S., Xie, Y., & Cui, W. M. (2007). Experimental study on factors influencing soil moisture uniformity under linear source drip irrigation. Journal of Irrigation and Drainage, 26(6), 11–14. (in Chinese).
- Luth, H. J., & Wismer, R. D. (1971). Performance of plane soil cutting blades in sand. Transactions of the ASAE, 14(2), 255–259. https://doi.org/10.13031/2013.38270
- Natsis, A., Petropoulos, G., & Pandazaras, C. (2008). Influence of local soil conditions on mouldboard ploughshare abrasive wear. Tribology International, 41(3), 151–157. https://doi.org/10.1016/j.triboint.2007.06.002
- O’Donovan, E. J., & Tanner, R. I. (1984). Numerical study for the Bingham squeeze film problem. Journal of Non-Newtonian Fluid Mechanics, 15(1), 75–83. https://doi.org/10.1016/0377-0257(84)80029-4
- Papanastasiou, T. C., & Boudouvis, A. G. (1997). Flows of viscoplastic materials: Models and computations. Computers & Structures, 64(1), 677–694. https://doi.org/10.1016/s0045-7949(96)00167-8
- Riahi-Madvar, H., Dehghani, M., Akib, S., Shamshirband, S., & Chau, K.-w. (2019). Developing a mathematical framework in preliminary designing of detention Rockfill Dams for flood peak reduction. Engineering Applications of Computational Fluid Mechanics, 13(1), 1119–1129. https://doi.org/10.1080/19942060.2019.1663449
- Shmulevich, I. (2010). State of the art modeling of soil–tillage interaction using discrete element method. Soil and Tillage Research, 111(10), 41–53. https://doi.org/10.1016/j.still.2010.08.003
- Singh, J., Chatha, S. S., & Sidhu, B. S. (2020). Abrasive wear behavior of newly developed weld overlaid tillage tools in laboratory and in actual field conditions. Journal of Manufacturing Processes, 55(7), 143–152. https://doi.org/10.1016/j.jmapro.2020.03.040
- Terzaghi, K. (1943). Theoretical soil mechanics. Chapman and Hali, Limited John Wiler and Sons, Inc.
- Veveakis, M., & Poulet, T. (2020). A note on the instability and pattern formation of shrinkage cracks in viscoplastic soils. Geomechanics for Energy and the Environment, 235(6). Article 100198. https://doi.org/10.1016/j.gete.2020.100198
- Zhu, L., Cheng, X., Peng, S.-S., Qi, Y.-Y., Zhang, W.-F., Jiang, R., & Yin, C.-L. (2016). Three dimensional computational fluid dynamic interaction between soil and plowbreast of horizontally reversal plow. Computers and Electronics in Agriculture, 123(4), 1–9. https://doi.org/10.1016/j.compag.2016.01.034
- Zhu, L., Ge, J.-R., Cheng, X., Peng, S.-S., Qi, Y.-Y., Zhang, W.-F., & Zhu, D.-Q. (2017). Modeling of share/soil interaction of a horizontally reversible plow using computational fluid dynamics. International Journal of Terramechanics, 72(2), 1–8. https://doi.org/10.1016/j.jterra.2017.02.004
- Zhu, L., Peng, S.-S., Cheng, X., Qi, Y.-Y., Ge, J.-R., Yin, C.-L., & Jen, T.-C. (2016). Combined finite element and multi-body dynamics analysis of effects of hydraulic cylinder movement on ploughshare of horizontally reversible plough. Soil and Tillage Research, 163(12), 168–175. https://doi.org/10.1016/j.still.2016.06.002
- Zhu, L., Xu, J.-L., Yin, C.-L., Kong, F.-R., & Kong, X.-L. (2008). Design of plough-breast of horizontal reversible plough with computer simulation technique. Journal of System Simulation, 20(13), 3455–3458. (In Chinese ).
- Zhu, L., Yin, C.-L., Kong, F.-R., Guo, L., & Sun, X.-M. (2007). Finite element analysis for Plow-breast of horizontally reversible Plow. Journal of System Simulation, 19(17), 3934–3936. (In Chinese ).