
 ?Mathematical formulae have been encoded as MathML and are displayed in this HTML version using MathJax in order to improve their display. Uncheck the box to turn MathJax off. This feature requires Javascript. Click on a formula to zoom.
Abstract
Enhancing the efficiency of gear systems is of significance to reduce fuel consumption and overall weight. Windage power losses become prevailing in high-speed gear systems, such as aero-engine applications. To avoid the shortages and limitations of commonly used methods (e.g. negative volume in dynamic mesh method and one moving object in sliding meshing method), this paper describes an unstructured overset computational fluid dynamics technology to simulate the airflow pattern in a gearbox and calculate the windage losses. A disk, a spur gear and a helical gear, spinning in the air at rotational speed up to 7200 r/min are studied respectively, the windage power losses obtained by the numerical method show good agreement with experimental data and analytical findings in the open literature. Meanwhile, the associated deceleration torques exerted by pressure and viscous forces on spinning gear surfaces are also determined. Furthermore, the overset method facilitates to estimate the windage losses of a non-meshing gear pair. The results of this paper indicate that the overset method can accurately predict the windage power losses and provide a new route to investigate the flow pattern surrounding the gears. This method can serve as an effective tool for engineering applications in the future.
1. Introduction
Windage losses refer to the power losses resulted from aerodynamic forces (viscous effect and pressure effect) acting on the spinning gears in engineering machinery. Particularly in high-speed gear systems, such as aero-engine applications, windage losses become predominant concerning other mechanical losses (load-dependent and load-independent), they would account for several percent of transmission power. This implies that a greater amount of additional lubricant and cooling requirements is needed, which conflict with the system design efforts of lightweight and heavily loaded for rotorcraft and carrier aircraft.
Even if the transmission efficiency achieves more than 98% in a best-designed gearbox that exceeds 100 MW, the energy dissipation is around 2 MW (Petry-Johnson et al., Citation2008). Windage power losses are anything but negligible as a form of power dissipation. Due to this significant relevance, quite a few literature have carried out experimental studies of the windage behavior. Not only that, baffles and shrouding have been adopted to control the airflow path surrounding the rotating gears, which can tremendously reduce windage losses (Winfree, Citation2013). An experimental and numerical analysis was executed by Massini et al. (Citation2018) for a spinning spur gear in a specific environmental that pressure and temperature conditions allowed to be preset and monitored, moreover, the particle image velocity technique with the fitted optical accesses in the test rig provided reliable results of the flow field provoked by the rotating gear, achieving good agreement with the computational results replicated the experimental conditions. The majority of the experiments and numerical models addressed the windage losses of an isolated gear, Ruzek et al. (Citation2019a, Citation2019b) designed a unique spin-down test rig which can measure both the losses of an isolated gear or a non-meshing gear pair, and conclude that each member of a non-meshing gear pair changes the airflow surrounding the gear. Recently, Arisawa et al. (Citation2019) modeled windage loss and oil dynamic loss to deduce equations for losses estimation, meanwhile, the validity of the developed model was demonstrated by experiments.
From a theoretical analytical point of view, Diab et al. (Citation2004) employed a dimensionless and quasi-analysis approach, though the tip tangential speed was slower than 100 m/s, the theoretical data agreed well with the experimental values measured by spin-down tests. However, these derived formulas seem mostly to be valid for spur gears and Voeltzel et al. (Citation2016) found that the helical angle and face width is influential to the generated windage losses in the case of helical gears. Soon after, another relevant work by Seetharaman and Kahraman (Citation2009, Citation2010) also proposed a physics-based model to predict windage losses for a spur gear pair consisting of a pocketing power loss model of compressible fluid and a modification drag power losses model obtained from a previous churning losses model. However, the physics-based model developed by Seetharaman has a poor prediction of the windage power loss in terms of a single rotating spur/helical gear without considering the influence of the helical angle. Not only a spur or helical gear, but Wang et al. (Citation2020) also established a power loss model for a high-speed heavy-load herringbone planetary transmission pair combining gear friction, windage behavior, and bearing friction. Zhu et al. (Citation2020b) developed a quasi-analytical model to predict the windage power losses of an isolated spiral bevel gear. Furthermore, considering the windage behavior, Quiban et al. (Citation2019) and Dai et al. (Citation2020) respectively set up an analytical model to estimate the churning losses of a bevel gear. These models show higher accuracy in the air under the medium and low speed conditions.
However, either these theoretical or empirical approaches are inefficient to estimate the windage losses due to the unsteady nature and the complexity of the environment, or time-consuming and expensive experiments. This engineering concern is more meaningful for high-speed gearbox.
More recently, computational fluid dynamics (CFD) has been a potential and powerful tool for a further understanding of real case studies for a complex phenomenon (Abadi et al., Citation2020; Faroughi et al., Citation2020; Mosavi et al., Citation2019; Mou et al., Citation2017; Peng et al., Citation2018; Salih et al., Citation2019). From a numerical analytical point of view, Marchesse et al. (Citation2011) expanded from 2D to 3D simulations to analyze the gear windage. Compared to 2D models, 3D simulations are more realistic and effective to address the windage behavior. Furthermore, the SST k-ω model (up to 8% derivation with the experimental evidence) is found to be prior to the RNG k- model in the aspect of handling the turbulence problem. Hill et al. (Citation2008, april, Citation2011) followed the experimental data given by NASA Glenn Research Center and especially simulated detailly the flow pattern of near-tooth region, the effect of shrouding configurations on an isolated gear was also eyed via CFD. it was also indicated that pressure forces are the main contributor to windage power losses rather than shear forces. Meanwhile, Al-Shibl et al. (Citation2007) studied the effectiveness of a fixed enclosure to reduce the windage power losses by using a CFD model. The advantages of numerical techniques, compared with empirically derived models that lack accuracy and spin-down tests which are costly and timely processes in a design cycle, are free to cover different influential parameters and detail the windage behavior in various conditions. Furthermore, Liu et al. (Citation2019) presented a starting point for studies on no-load losses in geared transmissions with injection lubrication with the help of the finite volume method and compared with empirical no-load loss equations.
In general, the main numerical strategies so far are the MRF- Multiple Reference Frame method (i.e. ‘Frozen Rotor’) (Concli & Gorla, Citation2016; Dai et al., Citation2019; Zhu et al., Citation2020a) for steady computation, the sliding mesh method (also known as ‘Transient Rotor Stator’) (Concli et al., Citation2015) for transient analysis, the mesh morphing (Qi et al., Citation2016) and the remeshing (Concli et al., Citation2013, september; Gorla et al., Citation2013). However, the first two are limited to simulate an isolated spinning gear, while the latter two can handle the gear engagement. Even so, the latter needs a good quality grid and some simplification such as increasing center distance or gear backlash, they are still vulnerable to negative volume. Different from the previous mesh handling strategies, the overset method (Gao et al., Citation2019; Soni et al., Citation2012) is more capable to overcome the negative volume and the limitation of isolated spinning gear.
Always looking for a simpler and more elegant method to estimate the gear windage power losses is an important component of predicting the power losses for the gearing system. To bridge this gap, this paper aims to address the prediction of windage losses for an isolated rotating wheel and a non-meshing gear pair, by exploiting the overset method and models, the airflow field and velocity characteristics are also taken into consideration. Numerical results are validated by the experimental findings in the open literature. Furthermore, the influence of the center distance on gear windage losses is also considered.
2. Ruzek’s spindown test description
The spindown test rig used by Ruzek et al. (Citation2019a, Citation2019b) consists of right and left shafts connected with an electric motor by a transmission shaft, belts and pulleys. The test gears or disks are mounted at the free end of the shafts and the other end are driven by timing belts so that the reverse parallel shaft is identified with the parallel shaft of the meshing gear pair. Once the preset speed is achieved, the fiction wheel is disconnected from the input part by a pneumatic jack. During that period, speed is measured by a magnetic encoder recording the variation trend of the speed versus time. To extract the gear windage losses, the overall power losses of the bearings, pulleys, seals, timing belts, etc. are subtracted from the whole system power losses. And the power losses can then be calculated based on Kinetic Energy Theorem:
(1)
(1) in which
denotes the rotation speed of shaft i (shaft 1 represents the propeller shaft) and ni is the tooth number of the ith belt pulley, Ii refers to the inertia of shaft i determined experimentally or numerically.
Three wheels (i.e. a disk and a spur/helical gear) are tested, as defined in Table .
Table 1. Ruzek’s experiment: wheels data.
Generally, the gear windage losses can also be expressed as a product of the net resistance moment Tm, and the rotational speed ω.
(2)
(2)
3. Methodology
3.1. Governing equation
The available data in the open literature (Diab et al., Citation2004; Voeltzel et al., Citation2016) suggests that windage losses have become of significance at low-Mach number subsonic incompressible flow. Accordingly, this paper is confined to transient incompressible flow analysis. The methodology there depends on the solution of the basic governing equations including the conservation laws of mass and momentum:
(3)
(3)
(4)
(4) where ρ, μ denotes the fluid density and viscosity, respectively. v, g represents the velocity vector and gravity vector, respectively. F is the externally applied force.
3.2. Overset meshing
An unstructured overset method is capable of handling the moving bodies in turbulent flows (Gao et al., Citation2019; Soni et al., Citation2012), not just the rotating motion of a single gear. As distinguished from the previous case (i.e. the sliding meshes, the mesh morphing and the remeshing), this alternative mesh handling strategy creates separate grids that are overlapping instead of complementary. Specifically, each part is regarded as a separate body owning its grid. The overset method simultaneously computes all grids including the component zones enveloping the wheels and the background zones acting as a reference grid for the component mesh. Field variables are derived by interpolation of all grids at each time step. This overcomes the limitation of the computational effort and can ensure the realization of motion simulation for complex geometries. It should be noted that the size of the component mesh is comparable with that of the background mesh, particularly in the areas of overlap, while all grid is refined.
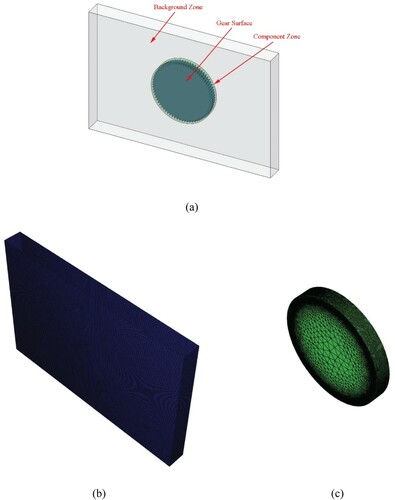
Some appropriate and rational simplifications have been employed in this work. Ignoring the transmission shafts, the model only considers the windage behavior of the single or double wheels in the air-flow field. As aforementioned, the computational domain consists of two parts: a component mesh, constituted by the wheel (gear/disk) and a part of fluid (air) enclosing it, and a background one used to model the whole fluid field without the wheel, as Figure clearly shows.
Figure 1. Overset mesh topology: (a) Computational domain; (b) Background mesh; (c) Component mesh.
3.3. Numerical setup and grids
Ansys Fluent has been exploited for studying the windage behavior of wheels. The air has been treated as incompressible (Mach number < 0.3) and with constant properties (i.e. the density is 1.185 kg/m3, viscosity is 1.831 × 10⁻⁵ Pa·s at 25°C). The standard k–ϵ model- the currently most compatible turbulence model in Fluent was adopted with near-wall treatment. Especially, a local grid refinement criterion is employed in the gear tooth surface. Not only that, a prismatic layer in the mesh near the walls is adopted in this paper.
The mesh motion cell zone conditions have been selected to apply to the component mesh enveloping the gear wall, while the no-slip condition is adjacent to all walls. A very small velocity inlet and a pressure outlet boundary have been imposed on the upper and lower interfaces of the background mesh. The coupled scheme was selected as a velocity-pressure coupling algorithm. The second-order scheme was used to process spatial discretization, while a second-order upwind scheme was for the temporal discretization.
The simulations will be stopped as the overall resistant torque acting on the disk or spur/helical gears had achieved a steady condition, and the scaled residuals had reached a minimum of .1.0 × 10−4 for every equation, as a time step is 1/100 of a rotation period of one wheel.
ANSYS Mesh has been used for generating two tetrahedral meshes of the component and background zones, which were systematically refined. A mesh independence analysis was performed, comparing the windage losses of the spur gear 1 at a rotational speed of 6000 r/min. Table summarized the results of each mesh element. From coarser to medium, windage losses calculated by using the resistant torque including pressure and viscosity contribution acting on the wheel walls increases of 1.1%, while a further increasing the mesh elements (mesh 3, as shown in Table ) leads to insignificant variation in windage losses. Do the same mesh sensitivity analysis for other wheels, the medium-size grid has been preferred in this paper.
Table 2. Results of mesh independence analysis.
The effect of the dimensions of the overlapped zone in axial and radial directions on the numerical simulations that the boundary conditions, mesh generation remained unchanged were also considered (Table ). The windage losses increased with increasing the axial width or diameter of the overlapped zone, namely, the bigger the overlapped zone is, the bigger the estimated error of windage losses under identical mesh size conditions is.
Table 3. Dimensions in axial and radial directions.
4. Results
4.1. Comparison with different kinds of methods
Figure shows the windage power losses using several different methods (e.g. overset mesh, dynamic mesh and sliding mesh) versus speed for the spur gear 1 in Table . The experimental findings (Diab et al., Citation2004) are also superimposed in Figure . In general, acceptable agreements between these numerical results and experimental values are found.
Figure 2. Comparison between the numerical results obtained by different kinds of methods and experiments for spur gear 1.
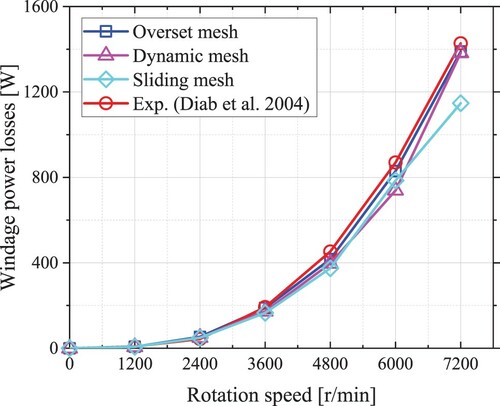
In the condition of about an equal number of the grid (around 3.6 million), for all kinds of approach, the overall average time can be minimized by using the sliding mesh method, followed by the overset mesh and the dynamic mesh. Nevertheless, the overset mesh expends about 10 percent more time than the sliding mesh. Besides, the average relative deviation between the numerical and experiments is less than 15% as listed in Table , among them, the prediction of overset mesh and dynamic method are prior to the sliding mesh. Last, but not least, the dynamic method undergoes the negative volume deficiencies, it suggests a very high-quality mesh is an essential pre-requisite. The sliding mesh is not good at addressing the windage power losses of a gear pair. Generally, the overset mesh method is a good option for predicting the losses.
Table 4. Comparison of different kinds of methods.
4.2. Single-wheel windage losses
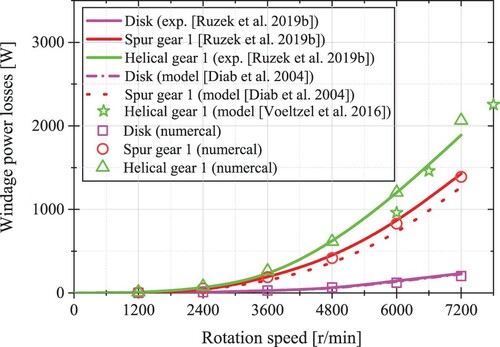
As shown in Figure , numerical predictions of the windage losses for an isolated disk or spur/helical gear defined in Table are compared with experimental data given by Ruzek et al. (Citation2019b) and Diab et al. (Citation2004). For the sake of the verification of the overset method, the results from empirical formulas (Diab et al., Citation2004; Voeltzel et al., Citation2016) are also superimposed in Figure . The numerical results coincide with the experimental and analytical values for rotation velocity below 7200 r/min. The maximum deviation is noticed for spur gear 1 at 7200 r/min and is equal to 175 W corresponding to an important relative error of 8.5%, this was due to the air compressibility as the tip tangential speed outpaces 111.5 m/s (i.e. Mach number is 0.328).
Figure 3. Comparison of numerical results and experimental or theoretical findings for single wheel windage power losses.
Meanwhile, the contribution of the pressure and the viscous effect to the total windage losses for a disk or spur/helical gear are also investigated, as illustrated in Table , Figure and Figure . The pressure effect is almost zero for the disk (see Table ), whereas it dominates the total losses for the spur/helical gear (see Figures and ). The percentages in diagrams measures how the inertia (pressure effect) contributes to the overall losses, the ratio of losses resulted from the pressure to the overall losses slightly increases with the increase of the rotation speed, and almost all of them exceed 90%. At the same speed, the share of the pressure of the helical gear 2 is slightly above that of the spur gear 1, though the total power loss is significantly greater for the helical gear 2.
Figure 4. Numerical prediction of windage losses for spur gear 1 against rotation speed.
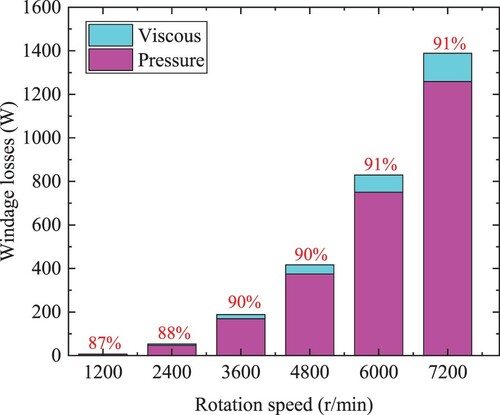
Figure 5. Numerical prediction of windage losses for a helical gear 2 against rotation speed.
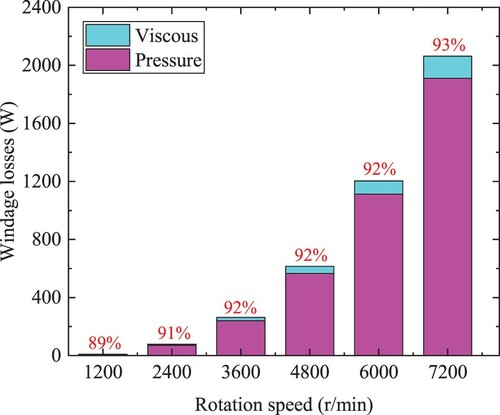
Table 5. Numerical prediction of windage losses for a disk versus rotation speed.
Additionally, by leveraging the overset method, more details of flow field characteristics not available from experimental findings can be got. Figure shows the velocity contour, in the case of the spur gear 1 with the rotation speed of 6000 r/min. As indicated, the airflow mainly concentrated in about 1.0 and 1.5 times the radius of the gear (see Figure a). Air axial velocity profile in Figure b means that the teeth are a major contributor to the overall windage power losses of the gear, as reported in Ref. (Diab et al., Citation2004). It also suggests that the radial shroud will promote the limitation of airflow to reduce the windage power losses. Figure illustrates a view of the predicted velocity vectors on the symmetry plane perpendicular to the wheel axis. Comparing Figures a and 7b, the airflow field of the spur gear 1 is very complex, the closer to the gear tooth, the more complicated it is, the gear tooth plays a key functional role in obstructing the airflow movement. Meanwhile, the disk loss now is about 120 W in Table while the spur gear loss could go as high as 830 W in Figure . With the same pitch diameter and width, the tooth leads to a big difference in windage loss. Therefore, it is also recognized that the gear tooth causes a huge loss.
Figure 6. Velocity contour of the spur gear 1 at 6000 r/min: (a) front view; (b) right view.
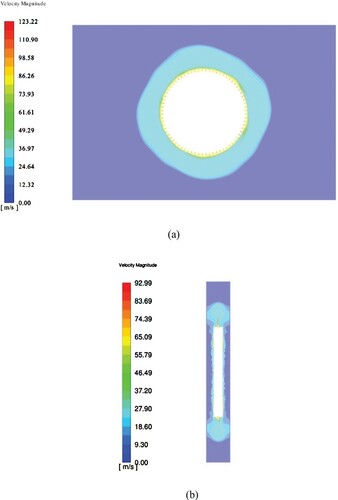
Figure 7. Velocity vectors in the symmetry palne at 6000 r/min: (a) front view of the disk; (b) front view of the spur gear1; (c) partial view of the spur gear1.
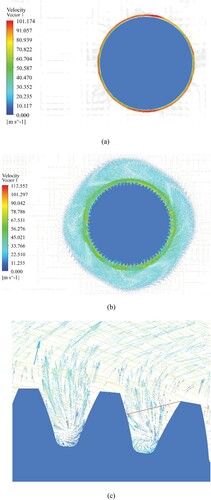
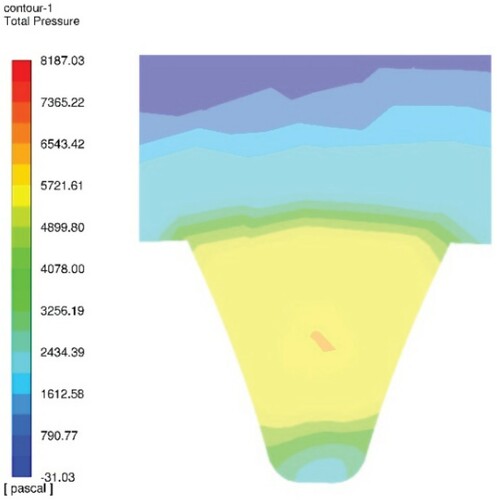
Furthermore, Figure c and Figure depict the flow within a tooth space of the spur gear 1 at 6000 r/min, respectively. As shown, there are two eddies in the tooth space and the magnitude of the ‘primary’ pressure close to the tip is higher than the second one near the root, and the primary eddy is much bigger than the secondary eddy. Note also that the air flow in the primary eddy is obstructed and deflected by the gear tooth, such that the active tooth surface is approximately the same as the assumption of Diab et al. (Citation2004), as shown in Figure . Thus, it implies that the energy loss caused by the primary eddy generation near the tip within the tooth cavity is the main source of windage losses.
Figure 8. The contour of static pressure within a cavity at 6000 r/min.
4.3. Double-wheel windage losses
Recently, the windage losses of a meshing gear pair are more appealing. Considering this, some preliminary numerical analysis of two wheels (disk or spur/helical gear) have been performed to appraise the effect of the center distance on windage losses. The wheels, especially for the gear pair, were separated to avoid meshing and shocks between teeth. The windage predictions of a single wheel from the previous analysis have also been superimposed.
To reduce the computational effort, this paper selects a part of the gear tooth in the region of engagement (shown in Figure ) to study the effect of the center distance on windage losses of spur/helical gears. Another point to note is that the mesh generation and numerical setup remain unchanged from the previous. Figure and Figure show the difference between the total windage losses and the sum of the losses of each member versus the rotation speed, for the spur gear 1 and helical gear 2, respectively.
The corresponding numerical results can be obtained in Figures and Table and some findings can be concluded as follows:
Broadly speaking, the parameter of the center distance has a negligible influence on the overall windage power losses, the losses for a system of two wheels (two disks, a disk-gear) is approximately equal to the sum of the individual losses for each member. As the speed over 6000 r/min (i.e. tip tangential speed is around 100 m/s), windage power losses exceed 1 KW for the spur/helical gear, it suggests that windage can be a major source of power losses, especially under high-speed condition.
Particularly, no noticeable difference of the windage losses for a system of two disks in Figure and Table can be observed suggesting that the losses are insensitive to the center distance between two members.
Figure 9. Windage losses of two disks as a function of center distance.
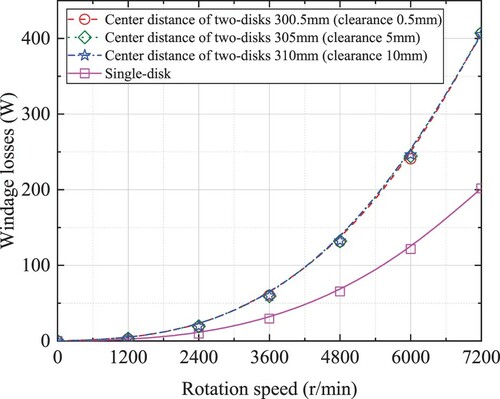
Figure 10. Windage losses of disk-spur gear 1 as a function of center distance.
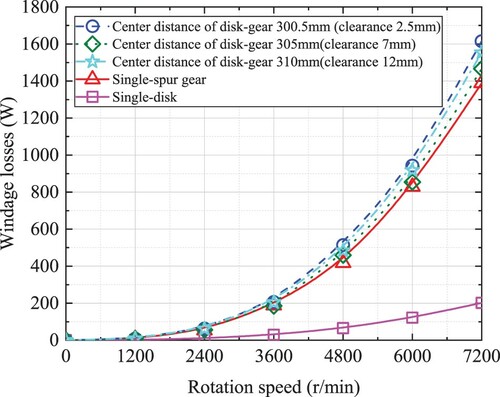
Figure 11. Velocity contour of the spur gear 1 and the disk at 6000 r/min, center distance 310 mm.
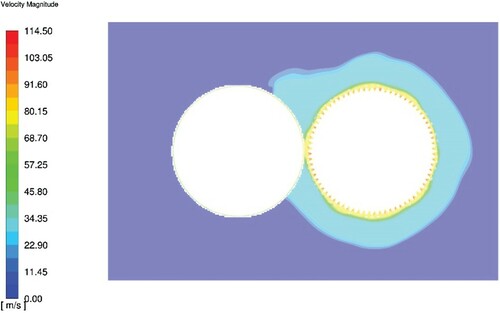
Figure 12. Sketch of a part of the gear tooth (center distance is 305 mm).
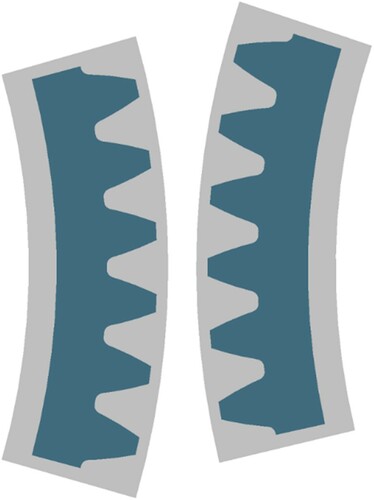
Figure 13. Windage losses of two spur gears 1 as a function of center distance.
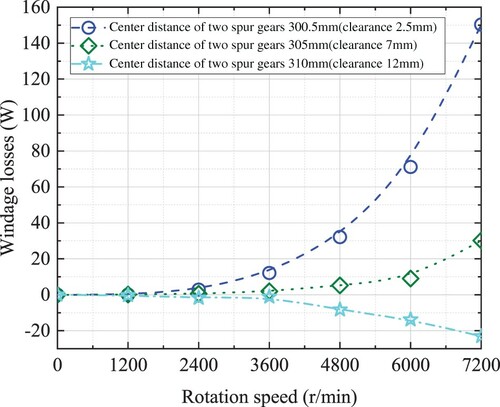
Figure 14. Windage losses of two helical gears 2 as a function of center distance.
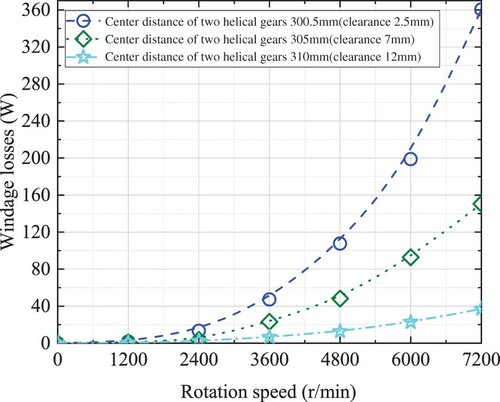
Table 6. Difference between the total losses and the sum of each member loss versus center distance at 7200 r/min.
However, the existence of the gear tooth has changed that. When the center distance between a wheel and a gear (i.e. center distance is 305∼310 mm) is large, the overall losses are nearly equal to or slightly less than the sum of the spur gear 1 and the disk. Some degree of airflow interaction contributes to pushing the other wheel, thus reducing a small fraction of air resistance mainly caused by pressure effect and the overall power losses, this is in line with the measurement by Ruzek et al. (Citation2019b).
When further reduce the distance (300.5 mm), the overall power losses increased dramatically exceeding that of the sum of the spur/helical gear and the disk, as shown in Figure , Figure and Table . This is directly related to the pocketing/squeezing power losses. Although there was no meshing between gear and other wheels, some degree of pocketing/squeezing behavior has appeared as soon as they get close enough.
Moreover, Figure depicts the velocity contour, in the case of the spur gear 1and a disk with the rotation speed of 6000 r/min, the center distance of 310 mm. As shown, the air surrounding the rotating disk holds nearly still while the movement of air caused by the spur gear 1 mainly occurs at about 1.0 and 1.5 times the radius of the gear, which is like that of the isolated gear in Figure . Inspired by that, it can deduce that the gear teeth are the leading cause of windage power losses.
4.4. Analysis of the temperature effect
Given that the working temperature is complicated, analyze the influence of temperature on the windage power loss is also analyzed, in this analysis. On the basis of the numerical setup above, the energy equation is used. As known to all, air density gradually reduces with temperature, and air viscosity is just the opposite. The total windage power losses decrease with the increase of temperature, as illustrated in Table and Figures and . Clearly, the losses of pressure effect and viscous effect are both decreasing. The latter of losses plays the leading role in the reduction. Meanwhile, according to Diab et al. (Citation2004), windage power losses can be given by
(5)
(5) where Aair is the active tooth area contributing to windage loss (see Figure ), vp denotes the pitch line velocity. From the equation, air density gradually reduces with temperature, and thus lead to the reduction of the windage losses.
Figure 15. Windage losses against temperature (spur gear 1, 6000 r/min).
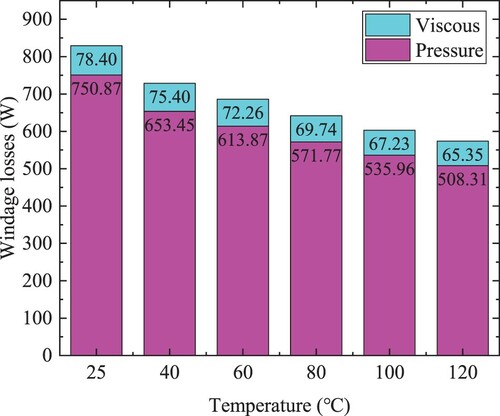
Figure 16. Windage losses against temperature (helical gear 2, 6000 r/min).
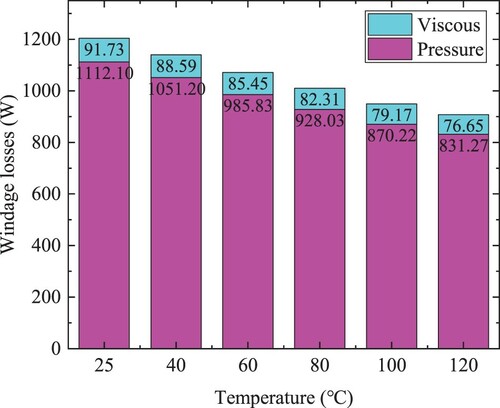
Figure 17. An example of active tooth surface area.
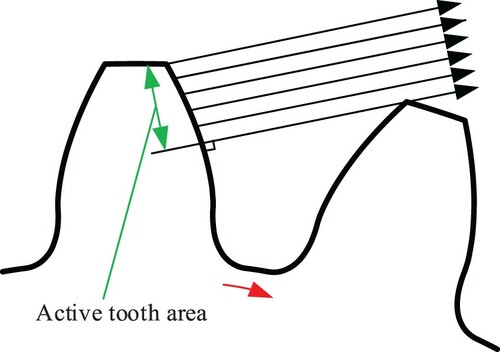
Table 7. Windage losses against temperature (disk, 6000 r/min).
However, it is not recommended that the working temperature of the gearing system should be high for reducing the windage losses higher temperatures would cause irreparable harm to the components and parts.
5. Conclusion
In this paper, a series of numerical studies with an unstructured overset method have been conducted, which facilitates to estimate of the windage power losses for spur/helical gears, not limited to single rotating gear exploiting conventional methods.
The overset method provides direct visualization of the airflow field not available by experiments. Numerical results indicate that the airflow surrounding the rotating gears mainly occurs at about 1.0 and 1.5 times the radius of the gear, and in the vicinity of gear teeth.
The predictions of an isolated rotating wheel and a non-meshing gear pair are in good accordance with the experimental and thermotical findings. It also interrogates several of the physical mechanisms of windage behavior. These comparisons confirmed that the overset method and models are reliable. Moreover, under the condition of high speed, the amount of windage power losses for a spur/helical gear can reach a kW order of magnitude that suggests the windage phenomenon plays a sizeable role in certain applications. Besides, when the center distance is large, the pocketing/squeezing phenomenon disappeared and the overall losses of a non-meshing gear pair were lower than the sum of each isolated gear, some degree of airflow interaction contributes to a small fraction reduction of air resistance mainly caused by pressure effect. These also underline the goodness of the overset approach for the prediction of the windage losses and the determination of the flow patterns. Furthermore, the study found that the increase in working temperature leading to a clear reduction of windage losses, namely, the temperature effect is an indispensable factor to consider estimating the windage losses when the gear works in temperature changes greatly.
An important contribution of this paper is exploiting a feasible overset approach to understand the airflow surrounding the rotating gears for engineering applications, such as aero-engine applications. However, the current study only concerns an isolated gear or a non-meshing gear pair. Further studies are under way to investigate the windage power losses decomposed into pressure loss of air flow passing through gear backlash and energy dissipation by eddies generation in the tooth cavity for a meshing gear pair.
Acknowledgements
The authors would like to gratefully acknowledge the financial support from the National Defense Preliminary Research Project of China (grant number KY-44-2018-0219).
Disclosure statement
No potential conflict of interest was reported by the author(s).
Additional information
Funding
References
- Abadi, A. M. E., Sadi, M., Farzaneh-Gord, M., Ahmadi, M. H., & Chau, K. W. (2020). A numerical and experimental study on the energy efficiency of a regenerative heat and mass exchanger utilizing the counter-flow maisotsenko cycle. Engineering Applications of Computational Fluid Mechanics, 14(1), 1–12. https://doi.org/https://doi.org/10.1080/19942060.2019.1617193
- Al-Shibl, K., Simmons, K., & Eastwick, C. N. (2007). Modelling windage power loss from an enclosed spur gear. Proceedings of the Institution of Mechanical Engineers, Part A: Journal of Power and Energy, 221(3), 331–341. https://doi.org/https://doi.org/10.1243/09576509JPE344
- Arisawa, H., Shinoda, Y., Tanaka, M., Goi, T., Akahori, H., & Yoshitomi, M. (2019). Classification and modeling of fluid dynamic loss in aeroengine transmission gears. Journal of Engineering for Gas Turbines and Power-Transactions of The ASME, 141(6), 061012. https://doi.org/https://doi.org/10.1115/1.4042509
- Concli, F., & Gorla, C. (2016). Windage, churning and pocketing power losses of gears: Different modeling approaches for different goals. Forschung im Ingenieurwesen, 80(3–4), 85–99. https://doi.org/https://doi.org/10.1007/s10010-016-0206-9
- Concli, F., Gorla, C., Della Torre, A., & Montenegro, G. (2015). Churning power losses of ordinary gears: A new approach based on the internal fluid dynamics simulations. Lubrication Science, 27(5), 313–326. https://doi.org/https://doi.org/10.1002/ls.1280
- Concli, F., Gorla, C., Stahl, K., Höhn, B. R., Michaelis, K., Schultheiß, H., & Stemplinger, J. P. (2013, September). Load independent power losses of ordinary gears: Numerical and experimental analysis. 5th world tribology congress, WTC 2013 (Vol. 2, September 8-13, pp. 1243–1246.
- Dai, Y., Ma, F., Zhu, X., & Jia, J. (2019). Numerical simulation investigation on the windage power loss of a high-speed face gear drive. Energies, 12(11), 2093. https://doi.org/https://doi.org/10.3390/en12112093
- Dai, Y., Ma, F., Zhu, X., & Ouyang, B. (2020). Development of an analytical model to estimate the churning power losses of a spiral bevel gear. Tribology International, 151, 106536. https://doi.org/https://doi.org/10.1016/j.triboint.2020.106536
- Diab, Y., Ville, F., Velex, P., & Changenet, C. (2004). Windage losses in high speed gears—preliminary experimental and theoretical results. Journal of Mechanical Design, 126(5), 903–908. https://doi.org/https://doi.org/10.1115/1.1767815
- Faroughi, M., Karimimoshaver, M., Aram, F., Solgi, E., & Chau, K. W. (2020). Computational modeling of land surface temperature using remote sensing data to investigate the spatial arrangement of buildings and energy consumption relationship. Engineering Applications of Computational Fluid Mechanics, 14(1), 254–270. https://doi.org/https://doi.org/10.1080/19942060.2019.1707711
- Gao, Z., Wang, Y., Su, Y., & Chen, L. (2019). Validation of a combined dynamic mesh strategy for the simulation of body’s large amplitude motion in wave. Ocean Engineering, 187, 106169. https://doi.org/https://doi.org/10.1016/j.oceaneng.2019.106169
- Gorla, C., Concli, F., Stahl, K., Höhn, B. R., Michaelis, K., Schultheiß, H., & Stemplinger, J. P. (2013). Hydraulic losses of a gearbox: CFD analysis and experiments. Tribology International, 66, 337–344. https://doi.org/https://doi.org/10.1016/j.triboint.2013.06.005
- Hill, M. J., Kunz, R. F., Medvitz, R. B., Handschuh, R. F., Long, L. N., Noack, R. W., & Morris, P. J. (2011). CFD analysis of gear windage losses: Validation and parametric aerodynamic studies. Journal of Fluids Engineering, 133(3). https://doi.org/https://doi.org/10.1115/1.4003681
- Hill, M. J., Kunz, R. F., Noack, R. W., Long, L. N., Morris, P. J., & Handschuh, R. F. (2008, April). Application and validation of unstructured overset CFD technology for rotorcraft gearbox windage aerodynamics simulation. 64th Annual Forum of the American Helicopter Society (April 29-May 1, pp. 39–45).
- Liu, H., Link, F., Lohner, T., & Stahl, K. (2019). Computational fluid dynamics simulation of geared transmissions with injection lubrication. Proceedings of The Institution of Mechanical Engineers Part C-Journal of Mechanical Engineering Science, 233(21–22), 7412–7422. https://doi.org/https://doi.org/10.1177/0954406219865920
- Marchesse, Y., Changenet, C., Ville, F., & Velex, P. (2011). Investigations on CFD simulations for predicting windage power losses in spur gears. Journal of Mechanical Design, 133(2). https://doi.org/https://doi.org/10.1115/1.4003357
- Massini, D., Fondelli, T., Andreini, A., Facchini, B., Tarchi, L., & Leonardi, F. (2018). Experimental and numerical investigation on windage power losses in high speed gears. Journal of Engineering for Gas Turbines and Power, 140(8). https://doi.org/https://doi.org/10.1115/1.4038471
- Mosavi, A., Shamshirband, S., Salwana, E., Chau, K. W., & Tah, J. H. M. (2019). Prediction of multi-inputs bubble column reactor using a novel hybrid model of computational fluid dynamics and machine learning. Engineering Applications of Computational Fluid Mechanics, 13(1), 482–492. https://doi.org/https://doi.org/10.1080/19942060.2019.1613448
- Mou, B., He, B. J., Zhao, D. X., & Chau, K. W. (2017). Numerical simulation of the effects of building dimensional variation on wind pressure distribution. Engineering Applications of Computational Fluid Mechanics, 11(1), 293–309. https://doi.org/https://doi.org/10.1080/19942060.2017.1281845
- Peng, Q., Gui, L., & Fan, Z. (2018). Numerical and experimental investigation of splashing oil flow in a hypoid gearbox. Engineering Applications of Computational Fluid Mechanics, 12(1), 324–333. https://doi.org/https://doi.org/10.1080/19942060.2018.1432506
- Petry-Johnson, T. T., Kahraman, A., Anderson, N. E., & Chase, D. R. (2008). An experimental investigation of spur gear efficiency. Journal of Mechanical Design, 130(6), 062601. https://doi.org/https://doi.org/10.1115/1.2898876
- Qi, F., Dhar, S., Nichani, V. H., Srinivasan, C., Wang, D. M., Yang, L., … Yang, J. J. (2016). A CFD study of an electronic hydraulic power steering helical external gear pump: Model development, validation and application. SAE International Journal of Passenger Cars-Mechanical Systems, 9(2016-01-1376), 346–352. https://doi.org/https://doi.org/10.4271/2016-01-1376
- Quiban, R., Changenet, C., Marchesse, Y., Ville, F., & Belmonte, J. (2019). Churning losses of spiral bevel gears at high rotational speed. Proceedings of the Institution of Mechanical Engineers Part J Journal of Engineering Tribology, 135065011985823. https://doi.org/https://doi.org/10.1177/1350650119858236
- Ruzek, M., Marchesse, Y., Ville, F., & Velex, P. (2019a). Windage power loss reductions in high-speed gear pairs. Forschung im Ingenieurwesen, 83(3), 387–392. https://doi.org/https://doi.org/10.1007/s10010-019-00336-7
- Ruzek, M., Ville, F., Velex, P., Boni, J. B., & Marchesse, Y. (2019b). On windage losses in high-speed pinion-gear pairs. Mechanism and Machine Theory, 132, 123–132. https://doi.org/https://doi.org/10.1016/j.mechmachtheory.2018.10.018
- Salih, S. Q., Suliman, M., Rasani, M. R., Ariffin, A. K., & Yaseen, Z. M. (2019). Thin and sharp edges bodies-fluid interaction simulation using cut-cell immersed boundary method. Engineering Applications of Computational Fluid Mechanics, 13(1), 860–877. https://doi.org/https://doi.org/10.1080/19942060.2019.1652209
- Seetharaman, S., & Kahraman, A. (2009). Load-independent spin power losses of a spur gear pair: Model formulation. Journal of Tribology, 131(2). https://doi.org/https://doi.org/10.1115/1.3085943
- Seetharaman, S., & Kahraman, A. (2010). A windage power loss model for spur gear pairs. Tribology Transactions, 53(4), 473–484. https://doi.org/https://doi.org/10.1080/10402000903452848
- Soni, K., Chandar, D. D., & Sitaraman, J. (2012). Development of an overset grid computational fluid dynamics solver on graphical processing units. Computers & Fluids, 58, 1–14. https://doi.org/https://doi.org/10.1016/j.compfluid.2011.11.014
- Voeltzel, N., Marchesse, Y., Changenet, C., Ville, F., & Velex, P. (2016). On the influence of helix angle and face width on gear windage losses. Proceedings of the Institution of Mechanical Engineers, Part C: Journal of Mechanical Engineering Science, 230(7–8), 1101–1112. https://doi.org/https://doi.org/10.1177/0954406215602036
- Wang, Y., Yang, W., Tang, X., Lin, X., & He, Z. (2020). Power flow and efficiency analysis of high-speed heavy load herringbone planetary transmission using a hypergraph-based method. Applied Sciences-Basel, 10(17), 5849. https://doi.org/https://doi.org/10.3390/app10175849
- Winfree, D. D. (2013, August). Reducing gear windage losses from high speed gears and applying these principles to actual running hardware. In International design engineering technical conferences and computers and information in engineering conference (Vol. 55928, p. V005T11A042). American Society of Mechanical Engineers. https://doi.org/https://doi.org/10.1115/DETC2013-13039
- Zhu, X., Dai, Y., & Ma, F. (2020a). CFD modelling and numerical simulation on windage power loss of aeronautic high-speed spiral bevel gears. Simulation Modelling Practice and Theory, 102080. https://doi.org/https://doi.org/10.1016/j.simpat.2020.102080
- Zhu, X., Dai, Y., & Ma, F. (2020b). Development of a quasi-analytical model to predict the windage power losses of a spiral bevel gear. Tribology International, 146, 106258. https://doi.org/https://doi.org/10.1016/j.triboint.2020.106258