
 ?Mathematical formulae have been encoded as MathML and are displayed in this HTML version using MathJax in order to improve their display. Uncheck the box to turn MathJax off. This feature requires Javascript. Click on a formula to zoom.
Abstract
The MENA-CORDEX (the Middle East and North Africa-COordinated Regional Downscaling Experiment) wind speed data at the height of 10 m is converted to the turbine hub-height for estimating the mean wind power in the Gulf of Oman. The results show high spatial variability of the historical and future mean wind power projection. Furthermore, the impact of climate change on the mean wind power (under the representative concentration pathway 8.5, RCP8.5, scenario) is found to be less than 5%, which indicates the sustainability of wind renewable energy. Based on the wind power distribution, bathymetry, and distance from the coast, five sites are selected in the Gulf of Oman as tentative energy hotspots to provide a detailed assessment of the directional variability of wind power for the historical and future periods. Significant variability of the directional distribution of wind power is found in the five study sites, which make it imperative to optimally design wind turbines and farms to achieve the best efficiency. The findings also indicate that the main direction and magnitude of wind power in the five sites under the RCP8.5 climate change scenario will remain almost the same as those of the historical period. Overall, the sustainability of power production under climate change impacts is promising to plan for wind energy extraction in the Gulf of Oman.
1. Introduction
Wind turbines are increasingly being installed in offshore and onshore regions to extract wind energy. Many studies have investigated the feasibility of wind power (as a renewable source of energy) for different places across the world (Rusu & Onea, Citation2013; Staffell & Pfenninger, Citation2016). Regional climate studies are required to assess the potential of wind power in any region due to its high spatial and temporal variability. Having said that, studying the sustainability, spatio-temporal distribution, and economic justification of wind power is necessary before constructing wind farms in any region (Eichhorn et al., Citation2019). On the other hand, climate change and global warming are going to affect different atmospheric and oceanic processes, which should be taken into account prior to developing wind farms (Schaeffer et al., Citation2012). Wind speed is an important atmospheric variable that may experience severe changes under future climatic conditions (Beniston et al., Citation2007). Therefore, the spatio-temporal distribution and future variability of wind power due to climate change should be thoroughly investigated. This enhances the reliability of the energy supply and helps societies achieve sustainable development.
Wind speed is the most important variable that affects the efficiency of onshore and offshore wind turbines. There are also a number of secondary factors (e.g. wind direction, icing, air density, and turbine aging) that influence the wind energy potential and extraction by turbines (Pryor & Barthelmie, Citation2010). Moreover, optimizing the shape and features of turbine blades can enhance energy yields (Jureczko et al., Citation2005; Xudong et al., Citation2009). Machine learning approaches have been used to study various parameters (e.g. wind speed and direction, blades damage, and icing) that control the efficiency of wind turbines (Jiménez et al., Citation2019; Mosavi et al., Citation2019; Shamshirband et al., Citation2019). Schindler and Jung (Citation2018) investigated the dependence of wind energy on the wind direction by the Copula-based approach. They found that minor changes in the wind direction may lead to significant variations in the turbine energy yield. Icing (due to low air temperature) is an important factor in regions with high altitudes because it can reduce the operation hours of turbines or even causes their complete stoppage (Laakso et al., Citation2003). Due to the inverse relationship between air density and temperature, higher air temperatures may decrease wind energy outputs. For example, increasing air temperature from 5 to 10°C causes a decrease of about 1% to 2% in air density, ultimately reducing wind energy (Pryor & Barthelmie, Citation2010; Solomon et al., Citation2007). Considering the effect of age on wind farm performance, it is found that wind turbines lose about 1.6% of their efficiency per year due to aging. Hence, a wind farm output is expected to be reduced by almost 12% over a 20-year lifetime (Staffell & Green, Citation2014).
As wind speed is the main component of wind energy harvest, its spatial and temporal variability should be explored thoroughly before developing wind farms. Wind speed may also vary due to climate change (Koletsis et al., Citation2016). Therefore, investigating the impact of climate change on wind speed (as the primary energy resource) is a substantial step toward the sustainable development and efficient exploitation of wind energy over a long period. The effect of climate change on wind speed is different in various regions. For instance, climate change may increase wind speed in a region, while its impact may be inverse in another region (Davy et al., Citation2018). Therefore, the regional analysis of wind speed and its future projection is extremely important for wind power studies (Moemken et al., Citation2018).
There are different atmosphere-ocean global circulation models (AOGCMs) that project climatic variables based on various possible future scenarios. However, these models are run globally at coarse spatial resolutions and cannot capture the fine-scale variability of wind speed. Thus, AOGCM wind speed data should be downscaled (Staffell & Pfenninger, Citation2016). This is usually carried out by the statistical and dynamical downscaling approaches (Alizadeh et al., Citation2019) The first method is simple and cost-effective, while the second one is more robust because it is physically consistent with the external conditions such as coastlines and boundaries (Pryor & Barthelmie, Citation2010). The coarse resolution of AOGCMs remains unresolved when statistical downscaling methods are employed (Alizadeh et al., Citation2019). The dynamical downscaling approaches have been often used to generate unbiased climatic variables with a high spatial resolution (Colette et al., Citation2012; Glotter et al., Citation2014).
Recently, the CORDEX (COordinated Regional Downscaling Experiment) regional climate models have been used widely to provide high-resolution future climate projection data for different regions (Lake et al., Citation2017). These data are freely accessible from the Earth System Grid Federation (ESGF) nodes (https://esgf.llnl.gov/nodes.html), and provide wind speed (Alizadeh et al., Citation2020; Moemken et al., Citation2018), solar radiation (Bartók et al., Citation2017), precipitation (Dosio, Citation2016; Klutse et al., Citation2016), and temperature (Cardoso et al., Citation2019; Nikiema et al., Citation2017).
The EURO-CORDEX wind speed predictions show a decreasing trend in most parts of Europe under future climatic conditions (Davy et al., Citation2018). A mild increase in wind climate and energy was projected in Africa (Célestin et al., Citation2019; Rautenbach & Herbst, Citation2016). Also, a decrease and an increase of wave height were projected in the northeast of the Atlantic Ocean and west of the Norwegian Sea, respectively (Aarnes et al., Citation2017). Since winds are the main driver of waves, similar trends can be obtained for wind speed in the Atlantic Ocean and Norwegian Sea (Aarnes et al., Citation2017). As mentioned above, the wind speed projection data vary significantly by the location of the study area.
The main goal of this study is to analyze the spatial and temporal variability of wind energy potential in the Gulf of Oman and evaluate the impact of climate change on it. Due to the warm climate and lack of icing in the study area, it is expected that wind speed would have the dominant effect on the wind energy potential. Therefore, this study focuses on wind speed variations and their impact on wind power. For this purpose, near-surface (at the height of 10 m) wind speed data from the CORDEX over the Middle East and North Africa (MENA) domain, called MENA-CORDEX, are used to estimate wind power in the Gulf of Oman for the historical (1981–2000) and future (2081–2100) periods. The MENA-CORDEX wind speed data for the historical period are also validated against those of ERA5. The sea surface roughness length over the Gulf of Oman is calculated from the ERA5 wave height and period data. Thereafter, it is used to convert the MENA-CORDEX wind speed data at the height of 10 m to the turbine hub-height in order to estimate wind power (Wang et al., Citation2020). Finally, the directional and seasonal variability of wind power is assessed at five point-scale sites in the Gulf of Oman. This study is organized as follows. In section 2, materials and methods are described. Results and discussions are explained in section 3. Finally, conclusions are given in section 4.
2. Materials and methods
2.1. Study area
The Gulf of Oman is selected as the study area. It is located in the north of the Indian Ocean and Arabia Sea and is connected to the Strait of Hormoz (Figure ). The Oman Gulf is between 22°N to 26°N latitude and 56°E to 60°E longitude and has an area of approximately 181,000 km2 (Pous et al., Citation2004). It is surrounded by Iran and Pakistan in the north, India in the east, and Oman in the west.
Figure 1. Location of the study area (the Gulf of Oman).
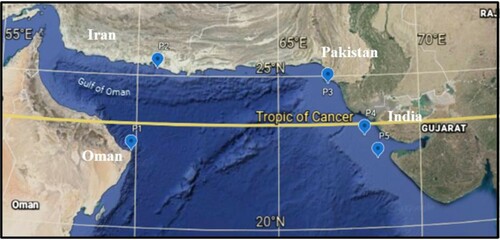
The Gulf of Oman plays an important role in the economy of its surrounding countries. Its surrounding ports and cities are rapidly growing, causing an increase in the demand for energy supply. Therefore, it is necessary to plan and construct renewable energy resources to meet sustainable development requirements. Wind power can be recognized as one of the best renewable energy sources in the study area (Kazem, Citation2011). Because of being placed in a hot climate, there is no problem with icing and turbine stoppage. Also, it is a deep water body with small wind speed disturbance and surface roughness.
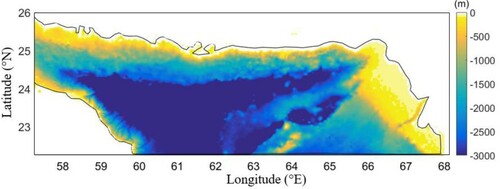
The offshore areas of the Gulf of Oman are deep, and thus the construction cost of wind turbines in them can be high. Therefore, both the wind power potential and construction cost (which is directly related to the bathymetry) should be taken into account for selecting the location of wind turbines. Figure illustrates the bathymetry of the study area. The bathymetry data are obtained from the General Bathymetric Chart of the Oceans (GEBCO) website (https://www.gebco.net/dataandproducts/griddedbathymetrydata/).
Figure 2. Bathymetry of the Gulf of Oman.
2.2. Data
The historical wind speed data in the Gulf of Oman play an important role in assessing wind energy. Also, the future projection of wind speed allows evaluating the impact of climate change on wind energy. In this study, near-surface wind speed () data from the MENA-CORDEX regional climate model with the spatial resolution of 0.22° × 0.22° and temporal sampling of 1 day are used for the historical and future periods. A 20-year time span (1981–2000) is used as the historical period. The representative concentration pathway 8.5 (RCP8.5) climate change scenario is utilized to project wind speed for 2081–2100. Typically, wind speed estimations are validated versus in-situ measurements. However, there are only a few stations in the Gulf of Oman that provide wind speed measurements. Hence, the ERA5 reanalysis wind speed data over the Gulf of Oman area are used to validate those of MENA-CORDEX.
ERA5 is the most recent atmospheric reanalysis dataset generated by the European Center for Medium-Range Weather Forecasts (ECMWF). It provides hourly estimates of a large number of atmospheric, land, and oceanic climate variables with a spatial resolution of 0.25° × 0.25°. It is worth noting that the reanalysis wind speed data have been widely utilized by many studies in various areas (Bednorz et al., Citation2019; Rodrigo et al., Citation2013; Shanas & Sanil Kumar, Citation2014). Figure shows the mean near-surface wind speed data from the MENA-CORDEX regional climate model and ERA5 reanalysis product during the historical period (1981–2000) over the Gulf of Oman. It is worth noting that the mean wind speed has been widely used to assess the wind power in different regions (Célestin et al., Citation2019; Koletsis et al., Citation2016; Wang et al., Citation2020).
Figure 3. Mean near-surface wind speed data from the (top) MENA-CORDEX regional climate model and (bottom) ERA5 product during the historical period of 1981–2000 in the Gulf of Oman.
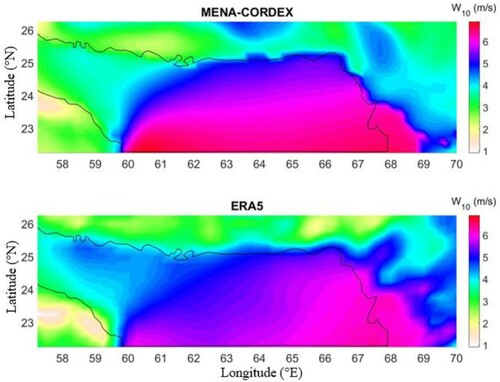
As illustrated in Figure , there is a good agreement between the wind speed maps from the MENA-CORDEX initiative and ERA5 reanalysis product. The magnitude and spatial patterns of both maps are comparable. The consistency of the two wind speed images shows that the MENA-CORDEX wind speed data can be used reliably to evaluate wind power over the Gulf of Oman.
The near-surface (at the height of 10 m) wind speed predictions from the MENA-CORDEX model should be converted to turbine hub-height, which typically ranges from 90 to 120 m. This is performed via an extrapolation approach (see Subsection 2.4) that requires the sea surface roughness length (see Subsection 2.3).
2.3. Sea surface roughness length
Sea surface roughness length () is an important parameter that affects the sea-atmosphere interaction. The momentum transfer between the sea surface and overlying air is strongly dependent on
. Swells and wave shoaling can highly decrease and increase sea surface roughness length, respectively (Taylor & Yelland, Citation2001). The sea surface roughness length can be related to the significant wave height and wavelength via (Taylor & Yelland, Citation2001),
(1)
(1) where
and
are the significant wave height and peak wavelength for combined sea and swell spectrum, respectively. A and B are empirical coefficients, which are set to 1200 and 45, respectively (Taylor & Yelland, Citation2001).
Wavelength (), wave period (T), and water depth (h) are related to each other by the dispersion equation,
(2)
(2) where
,
, and
is the gravitational acceleration. For deep waters,
is assumed to be equal to one as the water depth is higher than the wavelength. Thus, for deep waters, the dispersion equation can be simplified to calculate wavelength from the wave period:
(3)
(3) Using equations (1) and (3),
can be estimated from
and
. These variables are obtained from the ECMWF ERA5 reanalysis product for the historical (1981–2000) and future (2081–2100) periods with the spatial resolution of 0.5° × 0.5° and temporal sampling of 1 hour. Finally, the hourly roughness length estimates are averaged from 1981 to 2000 (Figure ).
Figure 4. The 1981–2000 mean sea surface roughness length for the study area.
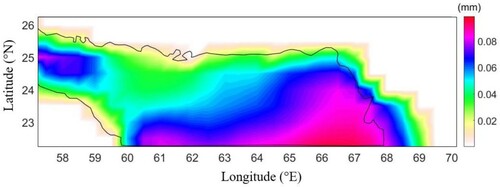
Many studies used the roughness length of 0.2 mm for calm sea conditions (Amirinia, Kamranzad, et al., Citation2017; Davy et al., Citation2018; Morgan et al., Citation2009; Stull, Citation1998; Wang et al., Citation2020). Following the literature and given the fact that the mean roughness length over 1981–2000 is less than 0.2 mm, is set to 0.2 mm in this study.
2.4. Weibull distribution and wind energy
Different probability functions (e.g. Weibull, Gumbel, Rayleigh, inverse Gaussian and gamma) have been fitted to the wind speed data to evaluate their distribution over a period of time (Alizadeh et al., Citation2019; Bardsley, Citation1980; Celik, Citation2004; Luna & Church, Citation1974; Qin et al., Citation2011). In this study, it is found that the Weibull distribution function fits well to most of wind speed data. It was also used to analyze wind speed data in the Gulf of Oman by previous studies (Malik & Al-Badi, Citation2009; Sulaiman et al., Citation2002).
The Weibull distribution function can be mathematically expressed as,
(4)
(4) where
is the wind speed at the turbine hub-height (z), and c and k are the scale and shape parameters of the distribution function.
The wind speed at the turbine hub-height () (required by 4) can be derived from the MENA-CORDEX wind speed at the height of 10 m (
) via (Amirinia, Mafi, et al., Citation2017),
(5)
(5) The turbine hub-height typically ranges from 90 to 120 m (Wang et al., Citation2020). Herein, the turbine hub-height (z) is set to 120 m. It should be noted that the turbine hub-height has been used widely to calculate the turbine wind power because it represents the average height of blades (Davy et al., Citation2018; Jung & Schindler, Citation2020; Pryor & Barthelmie, Citation2010; Wang et al., Citation2020). As shown in equation (5), the wind speed at the height of 120 m is obtained from the near-surface wind speed (
) using the sea surface roughness length (
) as the bottom condition of the atmosphere. In our study area, the upper atmospheric conditions (such as icing and rapid gradient in air temperature) have a negligible effect on converting the near-surface wind speed to the hub-height. This happens because the Gulf of Oman is located in a low-latitude warm environment. Many studies (Carvalho et al., Citation2017; Davy et al., Citation2018; Deepthi & Deo, Citation2010) also neglected the upper atmospheric conditions due to their insignificant impact.
The scale (c) and shape (k) parameters of the distribution function can be obtained by the maximum likelihood method as follows (Chang et al., Citation2015),
(6)
(6)
(7)
(7) where n denotes the number of wind speed data points.
Alternatively, the standard deviation method can be employed to estimate c and k (Ouammi et al., Citation2010),
(8)
(8)
(9)
(9) where
and
are the mean and standard deviation of wind speed data, respectively, and
is the Gamma function. In this study, the Weibull parameters (i.e. c and k) are found by the MATLAB Statistics and Machine Learning Toolbox using the maximum likelihood method. Detailed information on the estimation of c and k can be found in Mohammadi et al. (Citation2014).
The wind power density (P) per unit area (A) can be obtained by (Pryor & Barthelmie, Citation2010),
(10)
(10) where
is the air density.
Following (Acker et al., Citation2007), equation (10) can be simplified to,
(11)
(11) Wind turbines need a minimum wind speed (called cut-in speed) to generate power. Their operation must be stopped at a maximum wind speed (named cut-out speed) to avoid damage (Reyers et al., Citation2015). The cut-in and cut-out speeds are determined by the manufacturer. In this study, the cut-in and cut-out speeds are taken equal to 3.5 and 25 (m/s), respectively (Davy et al., Citation2018). Wind powers for velocities below 3.5 (m/s) and above 25 (m/s) are excluded.
2.5. Selection of wind energy hotspots
This study explores the impact of climate change on wind power distribution in the Oman Gulf. As depicted by the bathymetry map in Figure , the study area has deep waters with small turbulence and wind shear (Oh et al., Citation2018). Consequently, the effect of climate change on the mean, seasonal variability, and directional distribution of wind power can be studied in detail in a few representative point-scale sites. These sites are chosen by taking into account the bathymetry (depth of less than 70 m), distance to the coast (less than 60 km), and magnitude of wind speed (higher than 4 m/s). The sites should also be distributed widely over the Gulf of Oman to sample different climate conditions. Given the above criteria, five sites (P1–P5) are selected as the tentative energy hotspots in the Gulf of Oman (Figure ). Their characteristics are shown in Table .
Table 1. Characteristics of the selected energy hotspots in the Oman Gulf.
3. Results
3.1. Mean of wind power estimates in the historical and future periods
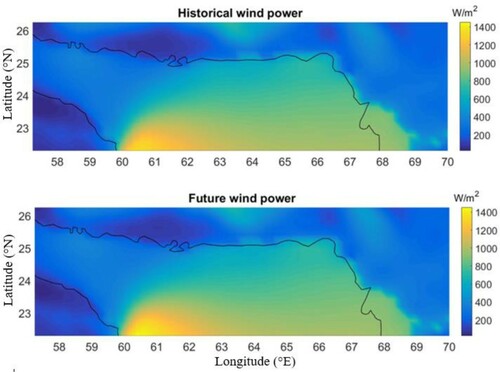
The mean of wind power () estimates during the historical (1981–2000) and future (2081–2100) periods (under the RCP8.5 climate change scenario) are shown in Figure . As shown, there is substantial spatial variability in the wind power estimate over the Oman Gulf for both periods. The wind power values of less than ∼200–300 W/m2 in the west of the Oman Gulf imply a relatively calm condition in that region. On the other hand, the wind power exceeds 1000 W/m2 in the south of the Gulf of Oman, indicating a high potential for wind power. Generally, by moving from north to south and west to east of the Gulf, wind power tends to increase significantly. Overall, there is a high spatial variability of
across the study area as it changes over the wide range of ∼200–1400 W/m2. The wind power reaches its highest and lowest values in the coastal waters of Oman and Iran, respectively. Intermediate wind power values are observed close to India and Pakistan. The effect of climate change on the wind energy resource in the study area can be recognized by comparing the wind power maps for the historical and future periods (Figure ). As can be seen, the wind power changes slightly (less than 5%) under the future climate scenario (RCP8.5) compared to the historical period. The historical and future maps of wind power demonstrate roughly identical patterns and magnitudes, implying the sustainability of wind renewable energy in the Gulf of Oman.
Figure 5. Mean wind power () estimates for the historical (top) and future (bottom) periods.
To have a better understanding of the impact of climate change on wind power, the relative difference of mean wind power estimates in the historical () and future (
) periods is illustrated in Figure . The relative difference of
and
is less than ∼5% over the study area. Under the RCP8.5 climate change scenario, the wind power potential tends to decrease slightly (about 5%) in the southwest and north center of the Gulf of Oman. These results indicate that wind power changes slightly under the future climate change scenario and thus it is a sustainable source of renewable energy. The highest increase and decrease in the future wind power predictions occur in the southwest (in the vicinity of Oman) and north (close to Iran and Pakistan) of the Oman Gulf, respectively. The inland areas close to the southwest of the Gulf show a wind power growth of up to ∼40% under the climate change scenario. In contrast, an insignificant decreasing trend (ranging from 0 to 5%) is observed in wind power for the inland areas adjacent to the east of the Gulf.
Figure 6. The relative difference of mean wind power estimates in the historical and future periods .
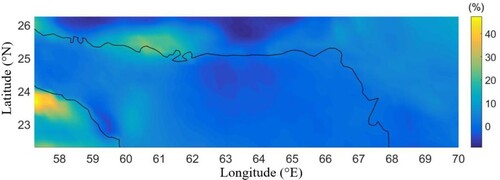
Table shows the mean wind power estimates for the historical and future periods and their relative difference at the five study sites (P1-P5) in the Gulf of Oman (see Figure for the locations of these points). P4 and P5 (close to India) have the highest wind energy potential of more than 900 W/m2 for both historical and future periods, while P2 (nearby Iran) has the lowest potential. P1 shows a high potential of wind energy with a mean power of about 600 W/m2 for both periods. P3 (near Pakistan) has a moderate power compared to the other points. A comparison of historical and future periods shows an insignificant reduction of mean wind power (less than 2%) at the P4 and P5 sites (Table ). In contrast, for points with an increasing trend in wind power (i.e. P1-P3), the relative difference ranges from about 4% to 22%. These results denote the sustainability of wind power potential in the five point-scale sites that are widely distributed across the Gulf of Oman and capture different conditions.
Table 2. The mean wind powers (W/m2) values in the historical and future periods and their relative difference in the five sites (P1–P5).
3.2. Directional analysis of wind power
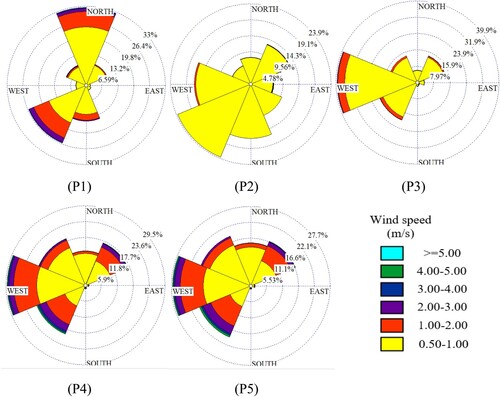
The main direction of wind plays a key role in the design and arrangement of wind turbines (Schindler & Jung, Citation2018). The directional distribution of wind power is of vital importance because a minor change in the direction of the wind can remarkably affect the wind turbine energy yield (Porté-Agel et al., Citation2013). Figure shows the directional analysis of mean wind power in the selected sites (P1-P5) for the historical period. As indicated, there is a strong variability in the directional distribution of wind power at the five study sites. For points in the east of the Oman Gulf (P3-P5), the dominant winds blow from the west to the east. For P1 in the southwest of the Gulf, the main winds mainly come from the north and southwest. Southward winds constitute about 10% of the winds in the study area. In higher latitudes (P2 and P3), northern winds are diminished, while western and southwestern winds are augmented. For P2, the importance of wind direction can be ranked from higher to lower as southwestern, southern, western, and northeastern. For the sites close to India (P4 and P5), wind power has the largest directional distribution in eastward and to a lesser extent in northeastward and southeastward winds. These results indicate significant variations in the directional distribution of wind power across the Gulf of Oman and necessitate the optimum design of wind turbines and farms to achieve the best efficiency. Generally speaking, such a large variation in wind direction is not desirable for wind power extraction although the wind farms can be designed to reach the highest rate of energy production.
Figure 7. Directional distribution of mean wind power in the selected sites (P1–P5) for the historical period.
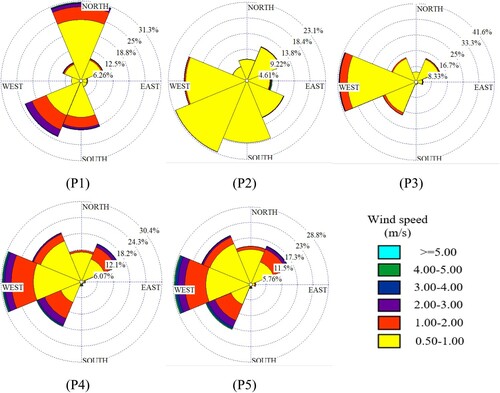
Evaluating the impact of climate change on not only the magnitude of wind power but also its directional distribution is required for achieving the sustainable development of wind farms. The directional distribution of mean wind power in the selected sites (P1–P5) for the future period is illustrated in Figure . Analogous to the historical period (Figure ), wind direction varies substantially in the five study sites for the future period. Comparison of Figures and shows that the main direction and magnitude of wind power under the future climate scenario will remain the same as those of the historical period. However, minor changes are seen in the direction and magnitude of wind power at some study sites. For example, the frequency and magnitude of southern winds are augmented under the future climate condition in P1. Overall, the directional analysis of wind power under the future climate scenario illustrates the sustainability of wind power in the Gulf of Oman.
Figure 8. Directional distribution of mean wind power in the five selected sites (P1–P5) for the future period.
3.3. Seasonal variability of wind power
Assessing the seasonal variability of wind power is required to fulfill the demand–supply gap (Park & Baldick, Citation2020). The consumption of electricity increases in the Gulf of Oman region during summer mainly due to the air temperature rise. Table presents the seasonal wind power estimates in the P1–P5 sites for the historical and future periods. As can be seen, there is a high seasonal variability of wind power in the five sites. The largest and lowest wind power values occur in summer (with the highest electricity demand) and fall, respectively. For the historical period, the seasonal wind power retrievals in the P1, P2, P3, P4, and P5 sites change respectively by 70.2%, 44.7%, 69.9%, 50.4%, and 53.0% during the four seasons. Corresponding values for the future period are 70.9%, 55.8%, 69.6%, 55.1%, and 56.5%. At all the points, the spring wind power (the second row in Table ) is expected to increase in the future period. P4 and P5 (in the vicinity of India) have the highest potential for wind power production in all seasons, which is consistent with our findings in Figures and . In contrast, P2 (close to Iran) has the lowest potential.
Table 3. Seasonal wind power (W/m2) estimates in the five sites (P1–P5) for the historical and future periods.
The seasonal wind power retrievals at the P1–P5 sites are shown in Figure . In P1, the lowest and highest wind power estimates occur in spring and summer, respectively (Figure a). Under the RCP8.5 climate change scenario, the wind power increases by 10.4%, 12.8%, and 15.4% in spring, summer, and fall, respectively. On the contrary, the mean wind power decreases in winter by 15.3%. Overall, the RCP8.5 climate change scenario does not significantly change wind power in P1.
Figure 9. Seasonal wind power estimates at P1–P5 for the historical and future periods.
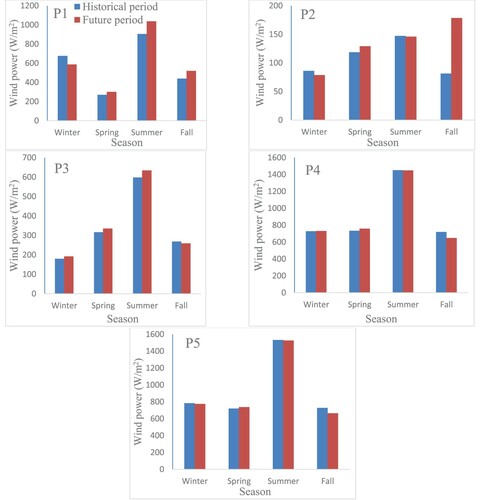
Wind power reaches its lowest value in P2. In all seasons except fall, wind power retrievals for the future period are roughly equal to those of the historical period. The future wind power increases remarkably in fall. The highest and lowest wind power estimates in P2 are seen in summer and winter, which are different from the seasons with extremum wind power values in P1. These results show the seasonal variability of wind power across the Gulf of Oman.
The wind power estimates have a large seasonal variation in P3. It increases from winter to summer significantly and reduces in fall. P4 and P5 are located close to each other in offshore areas of India and have almost an identical seasonal distribution of wind power. Both sites have the highest and lowest mean wind power values in summer and fall.
For all the sites, the highest wind power potential in summer is promising as the demand for energy is often the largest in this season (Kamranzad et al., Citation2016). Thus, luckily, the temporal distribution of wind power is in line with the energy demand. The projected values of wind power in different seasons remain almost identical to their historical values, indicating the minor impact of climate change on wind energy resources across the Gulf of Oman.
4. Conclusions
Wind power is recognized as a source of renewable energy. Regional climate studies are required to assess the potential of wind power in any region because of its high spatial and temporal variability. The impact of climate change on wind power should also be evaluated to reach a sustainable development of wind farms. In this study, the spatio-temporal variability of wind power potential in the Gulf of Oman and the impact of climate change on it are assessed. Near-surface (at the height of 10 m) wind speed data in the Gulf of Oman are obtained from the MENA-CORDEX (Middle East and North Africa-COordinated Regional Downscaling Experiment) regional climate model. The near-surface wind speed data are used to evaluate the historical (1981–2000) and future (2081–2100) (under the RCP8.5 climate change scenario) variability of wind power in the Gulf of Oman. The MENA-CORDEX wind speed data are validated against those of ERA5. The wave height and period data from the ERA5 reanalysis product are used to compute the sea surface roughness length, which is utilized to convert near-surface wind speed data to the turbine hub-height.
The historical (1981–2000) and future (2081–2100) mean wind power estimates over the Gulf of Oman are compared. Their difference ranges from −5% to +5% over the study domain, indicating the insignificant impact of climate change on the wind power potential. The findings indicate that lower latitude regions within the Gulf of Oman have a higher potential for wind power than the ones with higher latitudes. Generally, the wind power potential increases by moving from the west to the east of the Oman Gulf. The spatial distribution of wind power in both the historical and future periods demonstrates that the southwest of the gulf (in the vicinity of Oman) has the highest potential for wind power extraction. The wind power may vary from 300 W/m2 in the northwestern of the Gulf of Oman to 1400 W/m2 in the southwest.
Moreover, the seasonal and directional distributions of wind power estimations are studied in detail at five point-scale sites across the Gulf of Oman. The wind power estimates in the selected sites show high seasonal and directional variabilities. Wind power is relatively high at the sites close to Oman and India, while the site nearby Iran has a relatively low potential for the wind power production. The directional distribution of wind power changes significantly in the five study sites for both the historical and future periods. Hence, wind farms should be designed for the optimum arrangements of wind turbines to generate power from winds in different directions. In the five study sites, the mean wind power estimates in the historical and future periods have a similar directional distribution, implying that the impact of climate change on the wind direction is insignificant. High seasonal variability of wind power is observed in the study sites. Summer has the highest energy potential in all the sites. In the sites close to India and Oman, the historical and future mean wind power estimations exceed 1000 W/m2, indicating a high potential for energy extraction.
The high historical and future mean wind power values over most of the Gulf of Oman, the maximum wind power estimates in summer (when the energy demand is at its peak), and finally, the insignificant impact of climate change on wind power demonstrates its high potential and sustainability for the development of wind energy facilities in the study domain.
Acknowledgements
This research is supported in part by the Alexander von Humboldt Foundation, and also by the Open Access Funding by the Publication Fund of the TU Dresden.
Disclosure statement
No potential conflict of interest was reported by the author(s).
Additional information
Funding
References
- Aarnes, O. J., Reistad, M., Breivik, Ø., Bitner-Gregersen, E., Ingolf Eide, L., Gramstad, O., Magnusson, A. K., Natvig, B., & Vanem, E. (2017). Projected changes in significant wave height toward the end of the 21st century: Northeast Atlantic. Journal of Geophysical Research: Oceans, 122(4), 3394–3403. https://doi.org/https://doi.org/10.1002/2016JC012521
- Acker, T. L., Williams, S. K., Duque, E. P., Brummels, G., & Buechler, J. (2007). Wind resource assessment in the state of Arizona: Inventory, capacity factor, and cost. Renewable Energy, 32(9), 1453–1466. https://doi.org/https://doi.org/10.1016/j.renene.2006.06.002
- Alizadeh, M. J., Kavianpour, M. R., Kamranzad, B., & Etemad-Shahidi, A. (2019). A Weibull distribution based technique for downscaling of climatic wind field. Asia-Pacific Journal of Atmospheric Sciences, 8(3), 1–16. https://s13143-019-00106-z
- Alizadeh, M. J., Kavianpour, M. R., Kamranzad, B., & Etemad-Shahidi, A. (2020). A distributed wind downscaling technique for wave climate modeling under future scenarios. Ocean Modelling, 145, 101513. https://doi.org/https://doi.org/10.1016/j.ocemod.2019.101513
- Amirinia, G., Kamranzad, B., & Mafi, S. (2017). Wind and wave energy potential in southern Caspian Sea using uncertainty analysis. Energy, 120, 332–345. https://doi.org/https://doi.org/10.1016/j.energy.2016.11.088
- Amirinia, G., Mafi, S., & Mazaheri, S. (2017). Offshore wind resource assessment of Persian Gulf using uncertainty analysis and GIS. Renewable Energy, 113, 915–929. https://doi.org/https://doi.org/10.1016/j.renene.2017.06.070
- Bardsley, W. (1980). Note on the use of the inverse Gaussian distribution for wind energy applications. Journal of Applied Meteorology, 19(9), 1126–1130. https://doi.org/https://doi.org/10.1175/1520-0450(1980)019<1126:NOTUOT>2.0.CO;2
- Bartók, B., Wild, M., Folini, D., Lüthi, D., Kotlarski, S., Schär, C., Vautard, R., Jerez, S., & Imecs, Z. (2017). Projected changes in surface solar radiation in CMIP5 global climate models and in EURO-CORDEX regional climate models for Europe. Climate Dynamics, 49(7-8), 2665–2683. https://doi.org/https://doi.org/10.1007/s00382-016-3471-2
- Bednorz, E., Półrolniczak, M., Czernecki, B., & Tomczyk, A. M. (2019). Atmospheric forcing of coastal upwelling in the southern Baltic Sea Basin. Atmosphere, 10(6), 327. https://doi.org/https://doi.org/10.3390/atmos10060327
- Beniston, M., Stephenson, D. B., Christensen, O. B., Ferro, C. A., Frei, C., Goyette, S., Halsnaes, K., Holt, T., Jylhä, K., Koffi, B., Palutikof, J., Schöll, R., Semmler, T., & Woth, K. (2007). Future extreme events in European climate: An exploration of regional climate model projections. Climatic Change, 81(1), 71–95. https://doi.org/https://doi.org/10.1007/s10584-006-9226-z
- Cardoso, R. M., Soares, P. M., Lima, D. C., & Miranda, P. M. (2019). Mean and extreme temperatures in a warming climate: EURO CORDEX and WRF regional climate high-resolution projections for Portugal. Climate Dynamics, 52(1-2), 129–157. https://doi.org/https://doi.org/10.1007/s00382-018-4124-4
- Carvalho, D., Rocha, A., Gómez-Gesteira, M., & Santos, C. S. (2017). Potential impacts of climate change on European wind energy resource under the CMIP5 future climate projections. Renewable Energy, 101, 29–40. https://doi.org/https://doi.org/10.1016/j.renene.2016.08.036
- Célestin, M., Emmanuel, L. A., Batablinlè, L., & Marc, N. (2019). Spatio-temporal analysis of climate change impact on future wind power potential in Burundi (East Africa). American Journal of Climate Change, 8(2), 237–262. https://doi.org/https://doi.org/10.4236/ajcc.2019.82014
- Celik, A. N. (2004). On the distributional parameters used in assessment of the suitability of wind speed probability density functions. Energy Conversion and Management, 45(11-12), 1735–1747. https://doi.org/https://doi.org/10.1016/j.enconman.2003.09.027
- Chang, T.-J., Chen, C.-L., Tu, Y.-L., Yeh, H.-T., & Wu, Y.-T. (2015). Evaluation of the climate change impact on wind resources in Taiwan Strait. Energy Conversion and Management, 95, 435–445. https://doi.org/https://doi.org/10.1016/j.enconman.2015.02.033
- Colette, A., Vautard, R., & Vrac, M. (2012). Regional climate downscaling with prior statistical correction of the global climate forcing. Geophysical Research Letters, 39(13), n/a–n/a. https://doi.org/https://doi.org/10.1029/2012GL052258
- Davy, R., Gnatiuk, N., Pettersson, L., & Bobylev, L. (2018). Climate change impacts on wind energy potential in the European domain with a focus on the Black Sea. Renewable and Sustainable Energy Reviews, 81, 1652–1659. https://doi.org/https://doi.org/10.1016/j.rser.2017.05.253
- Deepthi, R., & Deo, M. (2010). Effect of climate change on design wind at the Indian offshore locations. Ocean Engineering, 37(11-12), 1061–1069. https://doi.org/https://doi.org/10.1016/j.oceaneng.2010.04.001
- Dosio, A. (2016). Projections of climate change indices of temperature and precipitation from an ensemble of bias-adjusted high-resolution EURO-CORDEX regional climate models. Journal of Geophysical Research: Atmospheres, 121(10), 5488–5511. https://doi.org/https://doi.org/10.1002/2015JD024411
- Eichhorn, M., Scheftelowitz, M., Reichmuth, M., Lorenz, C., Louca, K., Schiffler, A., Keuneke, R., Bauschmann, M., Ponitka, J., Manske, D., & Thrän, D. (2019). Spatial distribution of wind turbines, photovoltaic field systems, bioenergy, and river hydro power plants in Germany. Data, 4(1), 29. https://doi.org/https://doi.org/10.3390/data4010029
- Glotter, M., Elliott, J., McInerney, D., Best, N., Foster, I., & Moyer, E. J. (2014). Evaluating the utility of dynamical downscaling in agricultural impacts projections. Proceedings of the National Academy of Sciences, 111(24), 8776–8781. https://doi.org/https://doi.org/10.1073/pnas.1314787111
- Jiménez, A. A., Márquez, F. P. G., Moraleda, V. B., & Muñoz, C. Q. G. (2019). Linear and nonlinear features and machine learning for wind turbine blade ice detection and diagnosis. Renewable Energy, 132, 1034–1048. https://doi.org/https://doi.org/10.1016/j.renene.2018.08.050
- Jung, C., & Schindler, D. (2020). Introducing a new approach for wind energy potential assessment under climate change at the wind turbine scale. Energy Conversion and Management, 225, 113425. https://doi.org/https://doi.org/10.1016/j.enconman.2020.113425
- Jureczko, M., Pawlak, M., & Mężyk, A. (2005). Optimisation of wind turbine blades. Journal of Materials Processing Technology, 167(2-3), 463–471. https://doi.org/https://doi.org/10.1016/j.jmatprotec.2005.06.055
- Kamranzad, B., Chegini, V., & Etemad-Shahidi, A. (2016). Temporal-spatial variation of wave energy and nearshore hotspots in the Gulf of Oman based on locally generated wind waves. Renewable Energy, 94, 341–352. https://doi.org/https://doi.org/10.1016/j.renene.2016.03.084
- Kazem, H. A. (2011). Renewable energy in Oman: Status and future prospects. Renewable and Sustainable Energy Reviews, 15(8), 3465–3469. https://doi.org/https://doi.org/10.1016/j.rser.2011.05.015
- Klutse, N. A. B., Sylla, M. B., Diallo, I., Sarr, A., Dosio, A., Diedhiou, A., Kamga, A., Lamptey, B., Ali, A., Gbobaniyi, E. O., Owusu, K., Lennard, C., Hewitson, B., Nikulin, G., Panitz, H.-J., & Büchner, M. (2016). Daily characteristics of West African summer monsoon precipitation in CORDEX simulations. Theoretical and Applied Climatology, 123(1-2), 369–386. https://doi.org/https://doi.org/10.1007/s00704-014-1352-3
- Koletsis, I., Kotroni, V., Lagouvardos, K., & Soukissian, T. (2016). Assessment of offshore wind speed and power potential over the Mediterranean and the Black Seas under future climate changes. Renewable and Sustainable Energy Reviews, 60, 234–245. https://doi.org/https://doi.org/10.1016/j.rser.2016.01.080
- Laakso, T., Holttinen, H., Ronsten, G., Tallhaug, L., Horbaty, R., Baring-Gould, I., Lacroix, A., Peltola, E., & Tammelin, B. (2003). State-of-the-art of wind energy in cold climates. IEA Annex XIX, 24(6). http://www.vtt.fi/inf/pdf/workingpapers/2010/W152.pdf
- Lake, I., Gutowski, W., Giorgi, F., & Lee, B. (2017). CORDEX: Climate research and information for regions. Bulletin of the American Meteorological Society, 98(8), ES189–ES192. https://doi.org/https://doi.org/10.1175/BAMS-D-17-0042.1
- Luna, R., & Church, H. (1974). Estimation of long-term concentrations using a “universal” wind speed distribution. Journal of Applied Meteorology, 13(8), 910–916. https://doi.org/https://doi.org/10.1175/1520-0450(1974)013<0910:EOLTCU>2.0.CO;2
- Malik, A., & Al-Badi, A. (2009). Economics of wind turbine as an energy fuel saver – A case study for remote application in Oman. Energy, 34(10), 1573–1578. https://doi.org/https://doi.org/10.1016/j.energy.2009.07.002
- Moemken, J., Reyers, M., Feldmann, H., & Pinto, J. G. (2018). Future changes of wind speed and wind energy potentials in EURO-CORDEX ensemble simulations. Journal of Geophysical Research: Atmospheres, 123(12), 6373–6389. https://doi.org/https://doi.org/10.1029/2018JD028473
- Mohammadi, K., Mostafaeipour, A., & Sabzpooshani, M. (2014). Assessment of solar and wind energy potentials for three free economic and industrial zones of Iran. Energy, 67, 117–128. https://doi.org/https://doi.org/10.1016/j.energy.2014.02.024
- Morgan, E., Lackner, M., Vogel, R., & Baise, L. (2009). Probability distributions for offshore wind speeds. AGUFM, 2009, pp. A31F-0179.
- Mosavi, A., Salimi, M., Faizollahzadeh Ardabili, S., Rabczuk, T., Shamshirband, S., & Varkonyi-Koczy, A. R. (2019). State of the art of machine learning models in energy systems, a systematic review. Energies, 12(7), 1301. https://doi.org/https://doi.org/10.3390/en12071301
- Nikiema, P. M., Sylla, M. B., Ogunjobi, K., Kebe, I., Gibba, P., & Giorgi, F. (2017). Multi-model CMIP5 and CORDEX simulations of historical summer temperature and precipitation variabilities over West Africa. International Journal of Climatology, 37(5), 2438–2450. https://doi.org/https://doi.org/10.1002/joc.4856
- Oh, K.-Y., Nam, W., Ryu, M. S., Kim, J.-Y., & Epureanu, B. I. (2018). A review of foundations of offshore wind energy convertors: Current status and future perspectives. Renewable and Sustainable Energy Reviews, 88, 16–36. https://doi.org/https://doi.org/10.1016/j.rser.2018.02.005
- Ouammi, A., Sacile, R., Zejli, D., Mimet, A., & Benchrifa, R. (2010). Sustainability of a wind power plant: Application to different Moroccan sites. Energy, 35(10), 4226–4236. https://doi.org/https://doi.org/10.1016/j.energy.2010.07.010
- Park, H., & Baldick, R. (2020). Optimal capacity planning of generation system integrating uncertain solar and wind energy with seasonal variability. Electric Power Systems Research, 180, 106072. https://doi.org/https://doi.org/10.1016/j.epsr.2019.106072
- Porté-Agel, F., Wu, Y.-T., & Chen, C.-H. (2013). A numerical study of the effects of wind direction on turbine wakes and power losses in a large wind farm. Energies, 6(10), 5297–5313. https://doi.org/https://doi.org/10.3390/en6105297
- Pous, S., Carton, X., & Lazure, P. (2004). Hydrology and circulation in the Strait of Hormuz and the Gulf of Oman—Results from the GOGP99 Experiment: 2. Gulf of Oman. Journal of Geophysical Research: Oceans, 109(C12). https://doi.org/https://doi.org/10.1029/2003JC002146
- Pryor, S. C., & Barthelmie, R. (2010). Climate change impacts on wind energy: A review. Renewable and Sustainable Energy Reviews, 14(1), 430–437. https://doi.org/https://doi.org/10.1016/j.rser.2009.07.028
- Qin, Z., Li, W., & Xiong, X. (2011). Estimating wind speed probability distribution using kernel density method. Electric Power Systems Research, 81(12), 2139–2146. https://doi.org/https://doi.org/10.1016/j.epsr.2011.08.009
- Rautenbach, H., & Herbst, L. (2016). Climate change impacts on South African wind energy resources. Africa Insight, 45(4), 1–31. https://www.ajol.info/index.php/ai/article/view/134709
- Reyers, M., Pinto, J. G., & Moemken, J. (2015). Statistical–dynamical downscaling for wind energy potentials: Evaluation and applications to decadal hindcasts and climate change projections. International Journal of Climatology, 35(2), 229–244. https://doi.org/https://doi.org/10.1002/joc.3975
- Rodrigo, J. S., Buchlin, J.-M., van Beeck, J., Lenaerts, J. T., & van den Broeke, M. R. (2013). Evaluation of the antarctic surface wind climate from ERA reanalyses and RACMO2/ANT simulations based on automatic weather stations. Climate Dynamics, 40(1-2), 353–376. https://doi.org/https://doi.org/10.1007/s00382-012-1396-y
- Rusu, E., & Onea, F. (2013). Evaluation of the wind and wave energy along the Caspian Sea. Energy, 50, 1–14. https://doi.org/https://doi.org/10.1016/j.energy.2012.11.044
- Schaeffer, R., Szklo, A. S., Pereira de Lucena, A. F., Moreira Cesar Borba, B. S., Pupo Nogueira, L. P., Fleming, F. P., Troccoli, A., Harrison, M., & Boulahya, M. S. (2012). Energy sector vulnerability to climate change: A review. Energy, 38(1), 1–12. https://doi.org/https://doi.org/10.1016/j.energy.2011.11.056
- Schindler, D., & Jung, C. (2018). Copula-based estimation of directional wind energy yield: A case study from Germany. Energy Conversion and Management, 169, 359–370. https://doi.org/https://doi.org/10.1016/j.enconman.2018.05.071
- Shamshirband, S., Rabczuk, T., & Chau, K.-W. (2019). A survey of deep learning techniques: Application in wind and solar energy resources. IEEE Access, 7, 164650–164666. https://doi.org/https://doi.org/10.1109/ACCESS.2019.2951750
- Shanas, P., & Sanil Kumar, V. (2014). Temporal variations in the wind and wave climate at a location in the eastern Arabian Sea based on ERA-interim reanalysis data. Natural Hazards and Earth System Sciences, 14(5), 1371–1381. https://doi.org/https://doi.org/10.5194/nhess-14-1371-2014
- Solomon, S., Qin, D., Manning, M., Averyt, K., Marquis, M., & Tignor, M. M. (2007). Climate change 2007-the physical science basis: Working group I contribution to the fourth assessment report of the IPCC. Cambridge University Press.
- Staffell, I., & Green, R. (2014). How does wind farm performance decline with age? Renewable Energy, 66, 775–786. https://doi.org/https://doi.org/10.1016/j.renene.2013.10.041
- Staffell, I., & Pfenninger, S. (2016). Using bias-corrected reanalysis to simulate current and future wind power output. Energy, 114, 1224–1239. https://doi.org/https://doi.org/10.1016/j.energy.2016.08.068
- Stull, R. B. (1998). An introduction to boundary layer meteorology. Kluwer Academic Publishers.
- Sulaiman, M. Y., Akaak, A. M., Wahab, M. A., Zakaria, A., Sulaiman, Z. A., & Suradi, J. (2002). Wind characteristics of Oman. Energy, 27(1), 35–46. https://doi.org/https://doi.org/10.1016/S0360-5442(01)00055-X
- Taylor, P. K., & Yelland, M. J. (2001). The dependence of sea surface roughness on the height and steepness of the waves. Journal of Physical Oceanography, 31(2), 572–590. https://doi.org/https://doi.org/10.1175/1520-0485(2001)031<0572:TDOSSR>2.0.CO;2
- Wang, S., Yang, H., Pham, Q. B., Khoi, D. N., & Nhi, P. T. T. (2020). An ensemble framework to investigate wind energy sustainability considering climate change impacts. Sustainability, 12(3), 876. https://doi.org/https://doi.org/10.3390/su12030876
- Xudong, W., Shen, W. Z., Zhu, W. J., Sørensen, J. N., & Jin, C. (2009). Shape optimization of wind turbine blades. Wind Energy: An International Journal for Progress and Applications in Wind Power Conversion Technology, 12(8), 781–803. https://doi.org/https://doi.org/10.1002/we.335