
 ?Mathematical formulae have been encoded as MathML and are displayed in this HTML version using MathJax in order to improve their display. Uncheck the box to turn MathJax off. This feature requires Javascript. Click on a formula to zoom.
Abstract
In this study, a computational fluid dynamics approach based on solving the Reynolds-averaged Navier-Stokes equation and shear stress transport (SST) (Menter) k-ω turbulence model is used to solve the rotor in ground effect. A discrete element method based on solving the Hertz-Mindlin (no-slip) contact model and considering the real physical properties and collision is used to solve the motion and distribution of sediment particles in the field. By coupling the two approaches, the dust cloud development in the ground-effect flow field of a helicopter with rectangular-tip and slotted-tip blades is simulated for six seconds. The characteristics of the flow field are analyzed, and the influence of the flow field generated by the two types of blades on the movement and distribution of sediment particles on the ground and the subsequent dust cloud development over time are compared. The relatively long time of numerical results show that the sediment particles initially located on the ground are uplifted by the interaction between the blade tip vortex and the ground. Over time, the particles become more concentrated around the tip vortex core. The sediment particles in the dust cloud move primarily in the radial and axial directions of the rotation center, and the circumferential movement is not significant. The optimized slotted-tip blade provides better dissipation of the tip vortex core intensity near the ground than the rectangular-tip blade, thus weakening the entrainment effect of the sediment particles on the ground and reducing the dust cloud concentration around the disc plane.
KEYWORDS:
1. Introduction
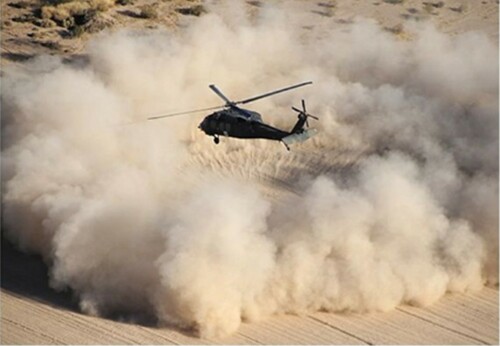
When a helicopter hovers above a surface with many sediment particles, the strong rotor-induced downwash moves a large number of particles around the rotor when it interacts with the sediment bed. The particles are transported to the upper of the rotor disc by carrier flow and then into the downwash. The high concentration of sediment particles forms a dust cloud, obstructing the pilots’ vision and leading to serious flight accidents. This phenomenon is called brownout (see Figure ). The closer the helicopter is to the ground, the more intense the phenomenon is, often forming a large-scale and high-concentration dust cloud (Cheng et al., Citation2016; Phillips et al., Citation2010; Syal & Gordon Leishman, Citation2013; Wong & Tanner, Citation2010).
Figure 1. Brownout caused by the in-ground-effect in a sediment bed.
The phenomenon of brownout has two important effects on a helicopter. First, the high-concentration dust cloud can cause significant visual obstruction, misleading the pilots and causing interference and difficulty in landing and maneuvering, which seriously threatens flight safety. Research has shown that brownout is one of the main causes of human factor-related accidents of military rotor aircraft. The U.S. Army reported that in 2001–2008, 24% of 130 helicopter losses were caused by non-hostile fire, which is the most important factor causing helicopter losses. When accidents caused by brownout-induced collisions with other objects or wires are included when the helicopter maneuvers at low speed, the proportion increases to 37%, i.e. 49 helicopters were lost (Harrington et al., Citation2010). The second effect of brownout is the damage caused by particles to helicopter components, especially rotor and engine blades. The high relative air velocity results in a strong impact of the particles and high friction, accelerating surface wear on the rotor and engine blades, affecting aerodynamic performance, and reducing the component’s life cycle.
China has a large land area and diverse landforms. The northwest region has a dry climate and low vegetation coverage, and brownout is a common occurrence when helicopters are landing. At present, the number of helicopters in China is increasing rapidly, and brownout has increasingly restricted the helicopter's mission capability. Therefore, the control of brownout has become an urgent problem to be solved to ensure safe landing of helicopters in the dusty environment.
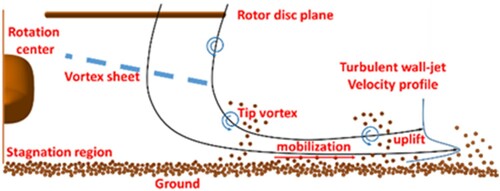
The brownout process is illustrated in the schematic diagram in Figure . In the in-ground-effect (IGE), in the flow field induced by the rotor, a vortex generated by the blade tip moves downward, interacts with the ground, and generates a wall jet near the surface, causing the movement of the sediment particles. When the tip vortex is obstructed by the ground, it entrains the sediment particles and lifts them above the rotor disc in the upwash region. Subsequently, the downwash causes the particles to hit the ground with high velocity, resulting in more particles being entrained, transported, and uplifted by the tip vortex. As a result, an increasing number of sediment particles are incorporated into the dust cloud, obstructing the pilot's vision, and eventually leading to serious flight accidents.
Figure 2. Schematic of brownout caused by the in-ground-effect in a helicopter.
Unlike wind-driven and river sediment transport, which are dominated by surface turbulence and shear, the movement mechanism of the sediment particles in a brownout is a load flow, which is dominant in the natural environment and has been well documented (Iversen et al., Citation1987). In this mechanism, particles do not continue to be suspended in the air. Johnson et al. (Citation2009) and Sydney et al. (Citation2011) Investigated the movement mechanism of a two-phase flow in a rotor-induced flow field. It was found that the shear stress and velocity of the deposition layer on the ground increased sharply due to the interaction between the strong vortex structure, such as the tip vortex and the ground, inducing many particles to be uplifted and suspended in the air and forming a dense dust cloud. In contrast, it is not affected by the dominant flow mechanism in the natural environment on sediment particles (Johnson et al., Citation2009; Sydney et al., Citation2011). Therefore, an approach to reduce the dust cloud concentration is to change the tip vortex structure or reduce the intensity of the tip vortex on the ground to weaken the entrainment of the particles and the uplift effect of the tip vortex to reduce the brownout severity.
The tip vortices in the wake have a significant impact on the IGE below the rotor. The tip vortex strongly affects the induced velocity near the rotor and causes unsteady aerodynamic loads and blade-vortex interaction (BVI) noise. Most previous studies focused on the description of the structure, location, and propagation path of the tip vortex, as well as the wake interference on the flow field around the rotor. The purpose of these studies was to understand the development of the rotor wake and tip vortex. However, since the tip vortex can only maintain 2–3 rotor revolutions in the out-of-ground effect (OGE), it is crucial to understand the structure of the tip vortex in the older wake (after 4–6 rotor revolutions) IGE in a brownout analysis (Milluzzo, Citation2012).
Studies have shown that the ability of the tip vortex to maintain and propagate in the flow to relatively old wake age is partly due to the fact that most of the vortex cores can maintain laminar flow. Cotel and Breidenthal (Cotel & Breidenthal, Citation1999) and Cotel (Cotel, Citation2002) used the Richardson number (Equation 1) to quantify the effect of vortex core rotation and stratification. The Richardson number is a function of the vortex Reynolds number and represents the ratio of turbulence generated or consumed by the tip vortex to the turbulence generated by shear. At higher vortex Reynolds numbers and early wake ages, the Richardson number in the vortex core is higher than the threshold value (usually 1/4 of the vortex Reynolds number, Rev1/4), the internal rotation speed of the vortex core is sufficiently high to produce turbulence in the core region; therefore, the tip vortex can maintain laminar flow and continue to propagate. Thus, changing the flow structure at the tip and reducing the local Richardson number below the threshold is one approach to interrupt the laminar flow of the tip vortex.
(1)
(1)
(2)
(2) Milluzzo (Hance, Citation2012) and Han (Han, Citation2005, January; Han & Leishman, Citation2004) investigated the effect of the shape of rotor blades on the tip vortex. Four slots were embedded in the tip area inside the blade parallel to the chord plane. Due to a pressure gradient between the inlet at the leading edge and the outlet at the tip, this passive system injects small-scale vortices and turbulence directly into the tip vortex when the rotor rotates, producing higher turbulence in the vortex core. As a result, the laminar flow velocity of the vortex core is rapidly reduced, interrupting the laminar flow and dissipating the tip vortex rapidly. These theoretical and experimental results provide guidance for how to reduce the strength of the tip vortex core reaching the ground, but previous researchers have not applied this method to the study of the movement of sediment particles affected by the current. Therefore, this study combined with the above results, coupled with the later discrete element method, applied to the study of brownout.
Helicopter brownout test is difficult to parameterize, expensive and dangerous. Although the scale model used in indoor or wind tunnel can obtain vortex core strength and flow field details close to the field test, it is still different from the real environment in many aspects. For example, the parameters of particle size, particle size range and particle number in the real environment are very different from those in the laboratory, so it is difficult to accurately reflect the helicopter brownout by using the scaled model. Moreover, the previous numerical methods did not consider the contact and collision between particles and the blades and fuselage, which may also have an important impact on the results of this special phenomenon. Therefore, it is necessary to analyze the real size rotor IGE flow field and take the physical properties of sediment particles and impact into account.
Compared with the earlier numerical methods based on Eulerian-Eulerian framework, which treat particles as fluid and cannot consider particle contact collision, the DEM (discrete element method) used in this study has its own advantages for simulating more realistic particle. It is a modeling method to study the dynamic/temporal transient behavior of a large number of objects with different shapes. Depending on the simulation accuracy requirements and the computing resources, the objects in the simulation system can be deformable (soft-sphere model) or rigid (hard-sphere model) (Norouzi et al., Citation2016); the momentum is transferred through continuous contact and collision between the objects. The models used to describe the translation and rotation of the discrete elements are highly dependent on the type and intensity of their interactions with the surrounding medium through direct contact or inter-particle effects. In multiphase flow, the interactions between these particles include the van der Waals force, liquid bridges, or the electrostatic force. The particles interact with the fluid or a static or moving wall, resulting in changes in kinetic energy and convection. The coupled computational fluid dynamics (CFD)-DEM is a numerical method used to simulate fluid-particle systems. The continuous phase is described by the Navier-Stokes (NS) equation, whereas the discrete phase is described by Newton’s and Euler’s second law; their solutions are independent and are obtained by determining the local porosity and fluid-particle interaction. When the phases are coupled, CFD is used to provide the fluid-particle interaction of the particles in the current time step, and the DEM uses the information to calculate the position and velocity of the individual particles, providing new particle information for the subsequent CFD calculation. The coupling method has been successfully used for the analysis of two-phase flows in different fields, such as medicine (Guo & Leu, Citation2013), mining (Cheng et al., Citation2016), and pneumatic transportation (Hidayat & Rasmuson, Citation2005; Mohanarangam et al., Citation2008). Helicopter brownout is also a two-phase flow; the continuous phase is the carrier flow, and the discrete phase is the flow of a large number of sediment particles. Therefore, this study uses the CFD-DEM method to establish a model of the dust cloud in a brownout to capture the sediment particles moved by rectangular-tip and slotted-tip blades in the IGE. The carrier flow, sediment particle distribution, and the velocity and trajectory information are investigated, and theoretical analysis is conducted of the use of slotted-tip blades to reduce the brownout impact.
2, Numerical calculation method of CFD-DEM
For the brownout caused by the rotor IGE, the continuous phase and discrete phase need to be solved separately. The independent data of these two phases should be solved iteratively using the respective solvers in the coupled method.
2.1. Physical model of the blades and sediment particles
In this study, two non-twisted rectangular blades are used as the rotor system for the coupling simulation. The blades are NACA2415 throughout the span, the R (rotor radius) is 8.18 m, the aspect ratio (AR) is 9.132, the root cut is 20%, the Mach number at the tip is 0.65, and the collective pitch is fixed at 12°. The shape of the slotted-tip blade is shown in Figure . Four internal slots with a diameter of 0.067 of the chord length (C) and spacing of 0.157 C connect the flow at the leading edge of the blade and the tip. The purpose of the slots is to move the small-scale vortices and turbulence from the leading edge to the tip vortex core to accelerate the dissipation of the tip vortex. For more details of the blade parameters, please refer to Ref. (Han & Leishman, Citation2004; Milluzzo, Citation2012).
The morphological characteristics of natural sediment particles are affected by weathering and the wear process between particles, resulting in different shapes and a large particle size range. A field study (Syal & Leishman, Citation2011) showed that the differences in the particle size of the particles composed of quartz, feldspar, mica, and variable organic materials, and the difference can be up to four orders of magnitude. In this study, the particle density was 1600 kg · m−3 (Wong & Tanner, Citation2010). Four types of spherical particles with sizes of 5, 10, 50, and 100 μm were used to generate particles randomly based on particle generation points in the sediment bed directly below the rotor shown in Figure , this configuration represents conditions close to the natural environment. The length and width of this area was 6 R, and the height from the ground surface was 0.025 R. Since the tip vortex does not reach the ground and move sediment particles in the early wake ages, the sediment particles are introduced into the calculation domain after the seventh revolution of the IGE calculation. Subsequently, the sediment particles are randomly generated once in each time step of the CFD calculation. The physical parameters of the sediment particles and blades in the DEM are listed in Table (Yu et al., Citation2018).
Table 1. Parameters setting in DEM.
2.2. CFD solver and mesh system
In STAR CCM+, a density-based coupled fluid solver based on the Reynolds-averaged NS (RANS) equation (Shi et al., Citation2020; Wang & Zhao, Citation2019) is used to calculate the rotor IGE flow field. For any Cartesian integral control volume V, the governing equations can be written as follows:
(3)
(3) where da denotes the difference surface area, Q denotes the original variable in the NS equation, F and G represent the inviscid and viscous flux terms, respectively, H represents the volume force, and Γ represents the preprocessing matrix. The two-equation shear stress transport (SST) (Menter) k-ω turbulence model is employed for the RANS closure. The implicit dual stepping method is used to carry out time marching with 1 degree per physical time (Ez Abadi et al., Citation2020; Hu et al., Citation2020; Ramezanizadeh et al., Citation2019), the courant number is set to 30 at each pseudo-time step to achieve a balance between computational efficiency and robustness.
The overset mesh approach divides the computational domain into three independent regions: the blade region surrounded by two independent cuboids. A single rectangular-tip blade region contains about 3 million mixed cells with hexahedron cells as the core, including polyhedron, hexahedron, prism and tetrahedron, and the single slotted-tip blade contains 3.6 million cells with the same cell structure as the rectangular-tip blade, as shown in Figures and . The static background mesh region contains the far-field domain, which contains about 4.3 million cells. The region below the rotor is locally refined. Anisotropic meshes are used in all regions to solve the wall flow. However, in order to avoid the divergence of the coupling algorithm, the cell size should be larger than the sediment particle size, so the y + of the first layer mesh is about 100, and the wall function method is used to simulate the wall flow. The rotation center is 20 R (rotor radius) from the four pressure outlet boundaries, and the distance between the disc plane and the top pressure outlet boundary is 10 R. The height between the disc plane and the no-slip ground is 1 R IGE. Where the overset mesh region meets the static background mesh region, interpolation is performed at the interface. In the moving blade region (Figure ), the cells are divided into active cells and receptor cells, and in the static background area, the cells are divided into active cells, receptor cells, and inactive cells. When the rotor rotates, these cells are updated simultaneously by the automatic hole-cutting algorithm. The discrete governing equations are solved in the active cells but not in the inactive cells. Since there is no direct data transfer between active cell and inactive cell, the receptor cells are used to couple the solutions for the active and the inactive cells. Since interpolations (i.e. shape functions) are included in the linear system, the coupling between the cells are completely implicit (Figures and ).
Figure 3. Mesh of rectangular-tip and slotted-tip blades.
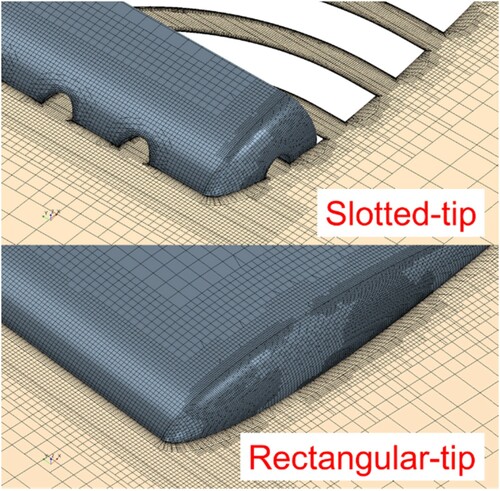
Figure 4. Background mesh system.
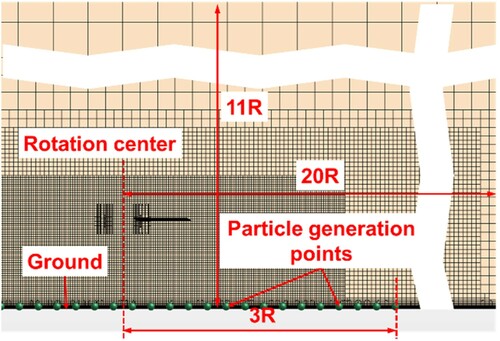
Figure 5. Overset mesh system.
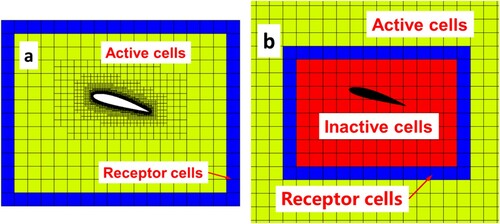
Figure 6. Schematic of the slotted-tip blade.
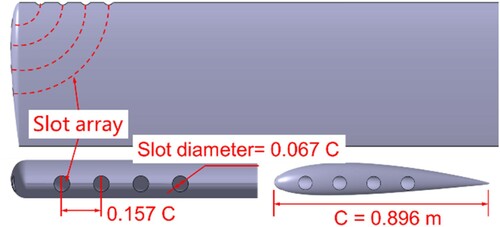
Figure 7. Schematic of the release of an iron ball in a viscous fluid.
2.3. The DEM
In this study, the volume fraction of all sediment particles in the whole computational domain is less than 10e-6. In this sparse particle system, the contact time between the particles and between particles and the wall is much shorter than the mean time between continuous collisions; thus, each contact can be considered as instantaneous and pairwise (Norouzi et al., Citation2016). Therefore, the hard-sphere formulation is selected for the coupling simulation. For each particle with a mass of mi, the velocity change of its free motion (between continuous collisions) in the system is solved by Newton's second law of motion:
(4)
(4) The first integration provides the new velocity of the particle, and the second integration provides its new position. External forces (such as gravity and total fluid-particle interaction force
) can act on the particle and change its velocity.
Typically, a large number of particles exist in the fluid-particle system. It is not realistic to calculate the collision between particles in each time step. Therefore, we apply a simplified model (force-displacement law) to calculate the collision to ensure high accuracy and low computational complexity. The Hertz-Mindlin (no-slip) nonlinear spring-dashpot model based on the Hertz-Mindlin contact theory (Hertz, Citation1882; Schiller & Naumann, Citation1933) is adopted in this study. It is an accurate and efficient numerical algorithm to calculate the contact force between particles and between particles and the wall. The contact force equation composed of the normal force Fn and tangential force Ft is expressed as follow:
(5)
(5)
(6)
(6)
(7)
(7) where n and t represent normal and tangential vectors, respectively.
and
denote the normal and tangential stiffness, respectively;
and
denote the normal and tangential damping components, respectively;
and
are the overlap of the particles in the normal and tangential directions, respectively;
and
are the velocity components of the particles in the normal and tangential directions, respectively;
is the static friction coefficient.
2.4. Establishment of the CFD-DEM
The Euler-Euler and Euler–Lagrange approaches are most commonly used to study fluid-particle systems. In the Euler-Euler approach, both the fluid and the particles are considered the continuous phase. In the Euler–Lagrange approach, the continuous phase is calculated by CFD (Cheng et al., Citation2016), and the discrete phase is calculated by the DEM. The calculation of different phases is carried out separately, and the momentum, energy, and mass information is conveyed in the coupling process.
Generally, the interaction between phases can be divided into four types according to the volume fraction of the solid in the fluid: one-way, two-way, three-way, and four-way coupling. The first three types of coupling only include particle-fluid interactions, and the fourth considers the effect of particle collision in the coupling process. Since the volume fraction of all sediment particles in the whole computational domain is less than 10e-6, the particles are primarily affected by the carrier flow in a brownout; however, they do not have a substantial impact on the carrier flow. Therefore, the carrier flow can be solved independently of the sediment particles.
For the different coupling parameters considered in this study, the momentum coupling coefficient can be determined by the ratio of the total drag force of the discrete phase to the convective momentum flux of the fluid phase. However, the energy coupling, which is used to measure the heat and energy transfer rate between the fluid and the particles, and the mass coupling, which is used to measure the adsorption and dissociation of the substances on the particle surface or the chemical reaction in or on the particle, are not dominant in a brownout. The heat transfer and mass transfer of natural sediment particles in brownout are very small, and the above phenomena have not been considered in previous research, so they can be ignored. As there is no relevant research results mentioned above phenomenon, this study cannot give the actual (estimated) proportion, which needs further research. Therefore, the momentum coupling coefficient can be expressed as follows:
(8)
(8) The coefficient is determined by the ratio of the total drag force
of the discrete phase to the convective momentum flux Momf of the fluid phase. Here, the
; thus, the momentum coupling between the phases can be calculated as one-way coupling. If the momentum coupling coefficient is close to 1, it means that the particles are difficult to be affected by the fluid, so the momentum coupling becomes less important. For example, the particles with large volume and high density are difficult to be affected by the fluid with low density. Obviously, this study is contrary to this example.
There are two independent time steps in the CFD-DEM. The time step of the discrete phase requires that the propagation distance of the disturbance wave should not exceed the center distance between the contacting particles. For the particles with density , shear modulus
, Poisson's ratio
, and radius
, the threshold time step based on the Rayleigh analysis (Norouzi et al., Citation2016) is given by:
(9)
(9) As mentioned above, the momentum conservation equation of the particles is written in the Lagrangian framework, and the change in momentum is balanced by the surface force and volume force of the particles. The momentum equation of particles with mass mp is defined as follows:
(10)
(10) where
denotes the instantaneous velocity of the particles,
is the surface joint force acting on the particles, and
is the volume joint force. These forces can be expressed as follows:
(11)
(11)
(12)
(12) The drag force
of the particles with a relative velocity
in a fluid with density
can be expressed as follows:
(13)
(13) where, drag coefficient Cd is a function of the small-scale fluid characteristics around a single particle, and Ap is the projected area of the particles in the carrier flow. There are many methods to determine the drag coefficient. For a brownout, which is a sparse one-way coupling system composed of small particles, the Schiller-Naumann correlation is suitable for determining the drag coefficient (Schiller & Naumann, Citation1933):
(14)
(14)
(15)
(15) where
is the particle size,
is the dynamic viscosity, and
is the particle’s Reynolds number. The pressure gradient force is given by the following equation:
(16)
(16) where
is the volume of a single particle, and
is the static pressure gradient in the continuous phase. The virtual mass force
is given by the following equation:
(17)
(17) where
represents the virtual mass coefficient, and
represents the relative acceleration. According to Hjelmfel and Mockros (Hjelmfelt & Mockros, Citation1966), the virtual mass can be ignored for a small density ratio (
). Therefore, it is ignored in this study.
represents gravity,
represents the Coulomb force, and
is given above.
3. Validation
In Ref. (Kalra et al., Citation2013), the experimental results of performance, instantaneous radial velocity and instantaneous whirl velocity comparison of four different tips blade (including rectangular-tip blade and slotted-tip blade in this study) IGE flow field at hovering height of 1 R were compared in detail. The data obtained from the coupling approach are compared with the quantitative experimental data to verify the accuracy of the calculation of the IGE flow field. The blade model, mesh structure, boundary conditions, and numerical method used in the verification are consistent with the data in this study. In the validation, the blade radii of the rectangular-tip and slotted-tip blades are both 408 mm, the collective pitch is fixed at 4.5°, the Mach number at the tip is constant at 0.24, and the tested rotors are fixed at the height of one rotor radius during hovering. As shown in Table , the CT (thrust coefficient) and CP (power coefficient) numerical results of the rectangular-tip blade are close to the experimental results. However, in this study and in Refs. (Han, Citation2005, January; Han & Leishman, Citation2004; Milluzzo, Citation2012), the numerical results of the slotted-tip blade are larger than the experimental values, but the power required are similar.
Table 2. Comparison of the experimental and numerical results of different blades with the data in Ref. (Kalra et al., Citation2013).
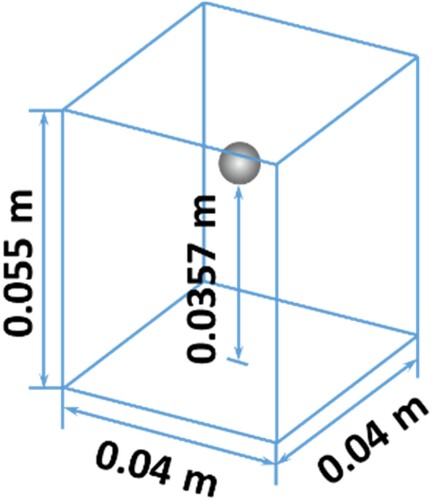
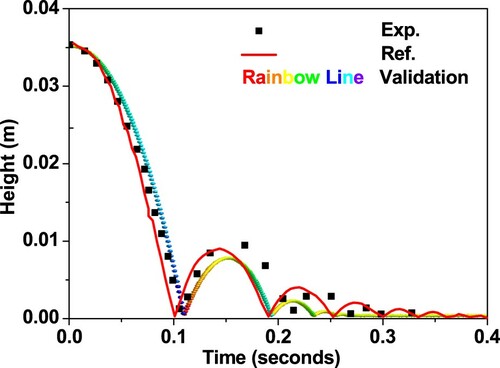
According to the verification of the CFD-DEM approach in Ref. (Qiu & Wu, Citation2014), a single spherical particle that impacts the wall and rebounds after free-falling in a viscous fluid is analyzed. The position of the particle over time is captured and compared to verify the accuracy of the numerical approach. In this validation, a small iron ball with particle size = 0.0095 m, density = 7,780 kg / m3, Young's modulus E = 200 GPa, and Poisson's ratio ν = 0.33 was released to fall into static water at zero initial speed. The height of the ball during the fall is compared with the experimental and numerical results in the literature (Figure ). During the fall, the iron ball is affected by gravity and the viscous fluid; it collides with the bottom at about 0.1 s and then rebounds. Due to the damping of the water, no rebound occurs after 5 collisions. A comparison of the experimental and validation results indicates that the first collision occurred at time t = 0.1054 and 0.1105 s respectively, and the second collision occurred at time t = 0.2145 and 0.1934 s respectively. The time errors of the two collisions were 4.8% and 9.8% respectively. The rebound heights after the first collision are 0.0095 and 0.0081 m respectively, and those after the second collision are 0.0029 and 0.0025 m respectively. The rebound height errors after the two collisions are 14.7% and 13.7% respectively. Because there are few data collected in the experiment, it is not an accurate comparison, but still, it can be judged in the figure that the curve outline of the experimental results is consistent with the numerical results. Therefore, it can be considered that the CFD-DEM approach used in this study meets the requirements for the accuracy of particle motion and collision in a viscous flow field.
Figure 8. Comparison of numerical results in this study with the experimental and numerical results (Kalra et al., Citation2013).
4. Results and discussion
4.1. The influence of the tip shape on the IGE field
The purpose of embedding flow slots inside the tip is to introduce a turbulent jet at the leading edge. When the blade rotates, the air flows into the slots from the leading edge and into the tip vortex in the form of turbulent jet at the tip, thus destroying the laminar flow and accelerating the dissipation of the tip vortex core. The flow at the tip in Figure shows that the tip vortex of the rectangular tip is twisted and does not produce mixed flow; therefore, it can produce a tip vortex with a complete structure in laminar flow. Vortex is not turbulence. Also, it can be seen from the flow of rectangular-tip in Figure that the internal structure of tip vortex core is relatively complete, similar to the smooth circular, which fully indicates that the flow near the vortex core is laminar flow, and this structure can gradually change to turbulence with the distance from the vortex core center increasing. In contrast, in the slotted tip configuration, due to the slots in the tip region, part of the incident flow passes through these channels from the leading edge of the blade and enters the tip vortex in the form of a turbulent jet at the exit, thereby promoting mixed flow in the tip vortex. The low-intensity discrete turbulent vortices from each slot rotate in the same direction, which is consistent with the rotation direction of the tip vortex. Figure shows that the vortices are connected and superposed and penetrate into the tip vortex. Therefore, they dissolve the laminar flow in the core region of the tip vortex, promoting the development of turbulence in the tip vortex core. Although it is observed from the streamline in Figure that the velocity of the flow decreases, the basic shape of the tip vortex is maintained. Moreover, it can be clearly seen in Figure that the laminar flow inside the vortex core is destroyed, and the turbulence gradually develops, affecting the vortex core dissipation, the vortex core region is more chaotic and highly dissipative, and the turbulence far away from the vortex core region is obvious. It should be noted that, in the turbulence model, both laminar viscosity coefficient and turbulent viscosity coefficient are solved simultaneously. It is generally believed that even in the turbulent environment, there is always laminar flow near the wall (even if it is less than a mesh scale), and because the relative velocity of the surface is zero, the velocity near the wall is not turbulence.
Figure 9. Comparison of streamlines flowing through different blade tips.
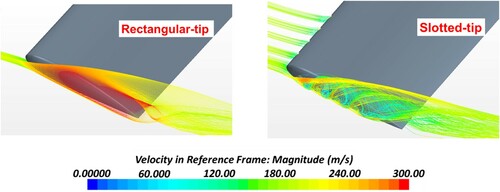
Figure 10. Tip vortex development of the rectangular and slotted tips.
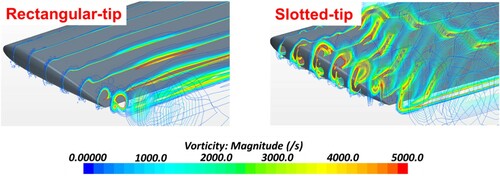
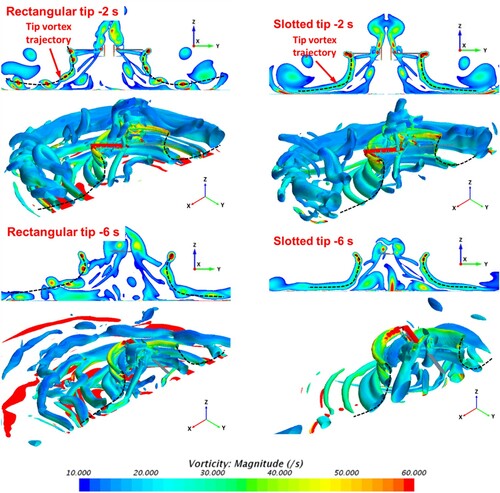
These results demonstrate the lack of internal laminar flow in the tip vortex formed by the slotted tip; thus, the flow is easily disturbed by the weak vortex structure, such as the vortex sheet formed by the pressure gradient and the external effects, such as the adjacent vortex. The instantaneous vorticity contours of the rotating center section in Figure illustrate the tip vortex core structure generated by the periodic motion of the rectangular tip, and the intensity is high. It should be noted that the vortex filaments move downward and then spread radially along the rotation center due to the extrusion of the ground. During the downward movement, the tip vortex does not contact the ground but produces turbulent shear near the ground. At this moment, the tip vortices near the ground are connected, and the mean wall-parallel velocity profile generated by the interaction between the tip vortex and the viscous ground is similar to the logarithmic profile in the fully developed turbulent boundary layer; a similar phenomenon was observed in Milluzzo's experiments (Milluzzo, Citation2012). However, the turbulent flow in the tip vortex generated by the slotted-tip blade is apparent, and there is no significant pairing of the vortices when they interact with the ground. Over time, turbulence with an asymmetric structure, weak intensity, chaotic orientation, and irregular development appears near the ground under the disc. After reaching the ground, the tip vortex diffuses radially along the rotating center, and the strength of the vortex core gradually weakens. On the other hand, just below the base region where there is no turbulence initially, the flow is blocked by the ground, resulting in weak intensity, an asymmetric structure, and high three-dimensional turbulence, causing sediment particles to be moved upward in the absence of fuselage obstruction.
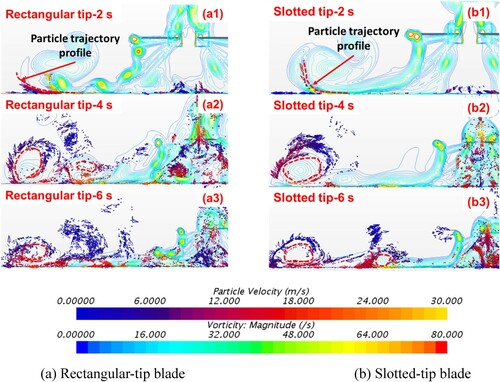
Figure 11. Vorticity contours of the rotating center section of the rectangular and slotted tips at different times in the IGE field (The black dotted line marks the trajectory of the tip vortex).
4.2. The trajectory of the sediment particles in the IGE field
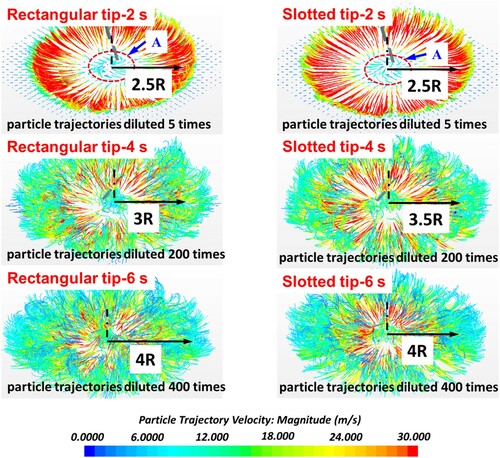
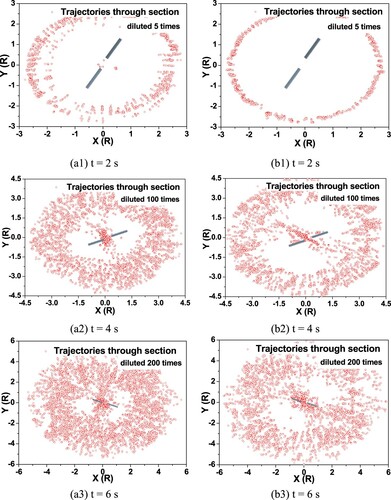
The flow field calculation is performed for 1.63 s when the rotor rotation reaches the seventh revolution. At this time, the interaction between the tip vortex and the ground has existed for a period of time, and the sediment particles have been introduced into the IGE flow field. The CFD-DEM provides particle velocity and position information. It should be noted that at time t = 2, 4, and 6 s, the density of the particle trajectories was diluted 5, 200, and 400 times, respectively, to clarify the development of the particle trajectory in Figure . At time t = 2 s in the initial stage of dust cloud development, an annular area A is observed. The rotation center is in the center of the circle, which has a radius of about 0.8 R and is located below the rotor. The sediment particles in this region move in the opposite direction to those at the blade tip. The sediment particles outside area A are mainly moved by the tip vortex. The velocity is directed radially outward along the rotation center, causing dust cloud diffusion. In contrast, the sediment particles inside area A are mainly moved by the root vortex, and the velocity is a combination of the tangential velocity in the direction of blade rotation and the radial velocity in the rotation direction. Over time, more particles are moved by the tip vortex and start to be uplifted, while the velocity gradually decreases. At time t = 4 s, the sediment particles in the outer part of the dust cloud continue to spread out at relatively low speed. However, the particles in the inner part of the dust cloud are affected by the induced velocity, and they approach the rotation center radially. The boundary of area A is still clear at this time, and the particles in the annular region have low speed with a spiral upward motion. At t = 6 s, the range of the dust cloud has expanded. Moreover, the trajectory of the particles near the disc indicates that some particles have entered the circulation area due to the downwash, and the development of the dust cloud is nearly complete. The dust cloud generated by the rectangular-tip blade is closer to the rotor disc, and the dust cloud range is smaller than that of the slotted-tip blade, resulting in higher dust cloud concentration of the rectangular-tip blade. Moreover, compared with Figure , it can be found that with the development of time, the range of the trajectory points passing through the near ground section of H = 0.15 R from the center of rotation both gradually expands, and the boundaries become blurred.
Figure 12. Distribution of particle trajectories over time in the induced flow for different tips.
A slice of the dust cloud in the rotation center is created to observe the spatial distribution of the sediment particles and determine the influence of the tip vortices at different positions. In Figure , a slice with a thickness of 0.06 R shows enough particles to represent the influence of the blade tip vortex on the particles. At time t = 2 s, most of the particles are concentrated around the core of the outermost tip vortex, and the velocity is roughly consistent with the tangential direction of the core laminar flow. At this moment, most of the particles are concentrated near the rotation center on the ground and the outer space of the dust cloud, and their number increases over time, the ‘particle distribution profile’ structure marked with red dotted line is formed. At time t = 4 s, the greater the height of the particles at the tip vortex, the lower the particle velocity is, and the more they are concentrated around the tip vortex core close to the ground and at the base. Moreover, the distribution of the particles at the base is disordered due to the influence of surface turbulence. The particles in Figure (a2) are distributed around multiple tip vortex cores, whereas in Figure (b2), they are concentrated around the tip vortex cores farthest from the rotation center on the ground. At the same time, the ‘particle distribution profile’ forms an annular structure around the laminar flow region of the tip vortex core, and gradually diffuses away from the center of rotation with the tip vortex core. Due to the continuous influence of the IGE flow on the surface force and volume force of the sediment particles, their direction gradually deviates from the tangential direction of the laminar flow of the vortex core, and the velocity decreases over time.
Figure 13. The influence of the IGE flow of different blade tips on the spatial distribution of the sediment particles in a slice with a thickness of 0.06 R symmetrical to the rotation center.
The static sediment particles on the ground are uplifted into the air by the IGE flow. In this process, their trajectory can be recorded by selecting a specific height section near the ground. The density of the trajectory points at time t = 2, 4, and 6 s was diluted 5, 100, and 200 times, respectively, for clarification. In Figure (a1) and (b1), in the initial stage of particle movement, the trajectory points passing through the cross-section of H = 0.15 R are concentrated in the annular region; the rotation center is the center of the circle, which has a radius of about 2.5 R. More sediment particles pass through this cross-section in the flow field of the rectangular-tip blade than that of the slotted-tip blade. At time t = 4 s, the number of particles passing through the cross-section has increased. The particles are no longer concentrated in a small area, and an increasing number of trajectory points is observed at the base. The range of trajectory points passing through the cross-section is higher in the flow field of the slotted-tip blade, and there are fewer trajectory points in the annular area compared to the rectangular-tip blade. These trends are more pronounced at time t = 6 s, and as the number of trajectory points increases in the cross-section, the trajectory points of the rectangular-tip blade and slotted-tip blade both gradually spread inward and outward in the flow field over time. However, the number of trajectory points of the rectangular-tip blade is relatively low, and they are widely distributed in the cross-section. Therefore, the uplift effect of the carrier flow on the sediment particles can be reduced by embedding slots in the tip region of the blade.
Figure 14. The trajectory points of the sediment particles passing through the cross-section of 0.15 R above the ground at different times: (a) rectangular-tip blade, (b) slotted-tip blade.
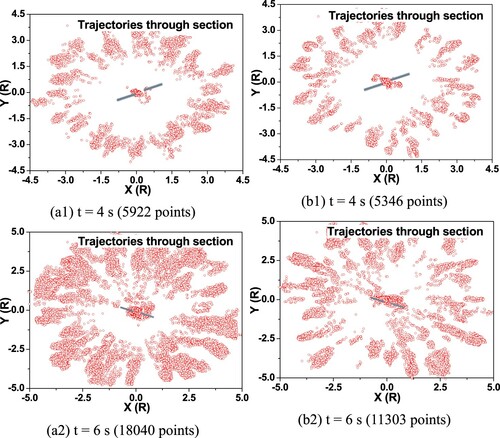
Over time, the sediment particles are gradually uplifted from the ground into the air by the induced flow and pass through the disc plane to enter into circulation. The particles that obstruct the pilot's sight and lead to brownout are mainly sediment particles located under the disc near the cockpit. Therefore, we analyze the trajectories of the particles passing through the disc plane to assess the obstruction severity of the pilot's sight. Since no particles pass through the disc plane at time t = 2 s, these trajectory points are not listed in Figure . At time t = 4 s, a large number of trajectories points have appeared in the section plane. The distribution of these trajectory points is similar to that in Figure , and they are also mostly located in the annular region around the rotation center. However, the particle trajectory points are clustered in Figure , and the clusters are located at regular intervals in the ring in the radial direction of the rotation center, rather than being evenly distributed in the annular area as shown in Figure . As shown in Figure (a1, b1), there is no significant difference in the particle distribution between the two blade types, except that there are more particle trajectories in the IGE field of the rectangular-tip blade. At t = 6s (Figure (a2, b2)), the range of particle trajectory points on the disc plane has expanded inward and outward simultaneously, indicating that the dust cloud has diffused outward, but some sediment particles have approached the base and have entered the rotor downwash area. The former particle clusters have maintained their original shape during the outward expansion. The number of particle trajectory points in Figure (b2) is lower and the distribution is sparser than in Figure (a2). The range of trajectory points is similar, but there is a significant difference in the number of points in each trajectory point cluster. In addition, the number of particle trajectory points passing through the plane of the propeller disc at different times is recorded (refer to the description in the figure). By comparison, it can be found that the number of trajectory points of the slotted-tip blade decreases by about 9.7% and 37.3% at time t = 4 and 6 s. This result indicates that the slotted-tip blade significantly reduces the number of trajectories passing through the disc plane in the flow field and the sediment particle concentration near the cockpit.
Figure 15. The trajectory points of the sediment particles passing through the disk plane at different times: (a) rectangular-tip blade, (b) slotted-tip blade.
The trajectories of the sediment particles in the field passing through the cross-section of the rotation center are analyzed. Their distribution reflects the influence of the rotor IGE-induced flow on the tangential motion of the particles along the rotation center. At time t = 2 s (Figure ), the tip vortex has already interacted with the ground to generate circumferential velocity while uplifting the particles. However, due to the small number of sediment particles and the incompletely developed flow field, the trajectory of the particles passing through the cross-section appears to be different in the rectangular-tip and slotted-tip blade flow fields. However, the number of particle trajectory points of the former is higher than that of the latter, and this characteristic is maintained over time (It should be noted that the particle trajectory points are diluted 20 times at time t = 4 and 6 s.). At time t = 4 s, differences begin to appear between the two blade types. The range of trajectory points of particles passing through the cross-section is wider for the slotted-tip blade than the rectangular blade (Figure (a2)). The points are more concentrated close to the rotation center and are about 4 R from the center; an inward curling wave shape is observed, and the points are diffusing outward. In Figure (a2, b2), the particles have passed through the disc plane, and the number of trajectory points continues to increase from 4 s to 6 s. The number of particle trajectory points near the rotation center and in the region of 2.5 R to 4.5 R from the rotation center has also increased. The number of points is significantly higher in the rectangular-tip blade field than the slotted-tip blade field, indicating that the former has a more significant effect on uplifting sediment particles than the latter.
Figure 16. Trajectory points of the sediment particles passing through the cross-section of the rotation center at different times: (a) rectangular-tip blade, (b) slotted-tip blade.
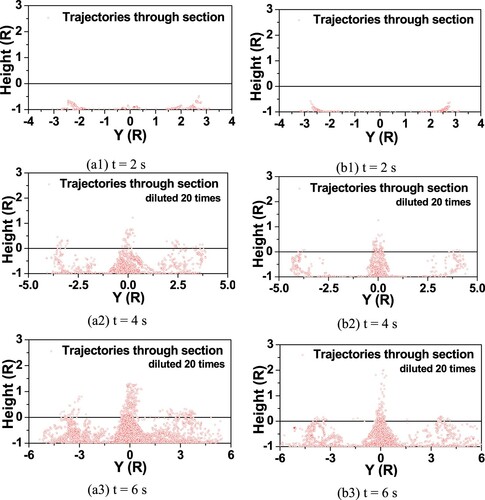
The uplift effect of the carrier flow on the sediment particles is mainly reflected by their axial velocity along the rotation center. The velocity distribution in the Z-direction of the trajectories passing through the cross-section at different times is shown in Figure . At time t = 2 s, most of the particle trajectories have moved up along the axis of the rotation center, indicating that the particles on the ground begin to move upward after being uplifted by the IGE flow. Those with a faster speed are located in the area where the tip vortex contacts the ground. At this moment, the time of the tip vortex acting on the sediment particles on the ground is short; thus, their trajectory velocities are low, and the distribution of the trajectory points is scattered due to their small number. The distribution is uneven. At t = 4 s (Figure (a2, b2)), particles have appeared in the negative Z-direction; they are highly unstable and transient and are concentrated around the rotation center primarily in the positive Z-direction due to the turbulence at the base of the disc. However, the particles concentrated at the tip or farther away have moved upward due to the uplift force of the tip vortex. In the flow field of the slotted-tip blade, the particle trajectory points passing through the cross-section are more concentrated in these two regions. At t = 6 s, there are a large number of particles with negative Z-direction velocity in the field, and the area of maximum velocity fluctuation is within 1 R from the rotation center. The primary reason is that some of the particles that are uplifted into the air and transported to the disc are rapidly convected under the downwash, resulting in high axial velocity of the particles in this region. It should also be noted that the particles near the rotation axis only exhibit velocity in the positive Z-direction. It is likely that the particles suspended in the air are affected by the rotor downwash near but not at the base and then enter the convection cycle with the downwash; however, they do not enter the area near the central axis. This phenomenon is confirmed by the dust cloud outline shown in Figures .
Figure 17. Trajectory points of the sediment particles passing through the central section at different times: (a) rectangular-tip blade, (b) slotted-tip blade.
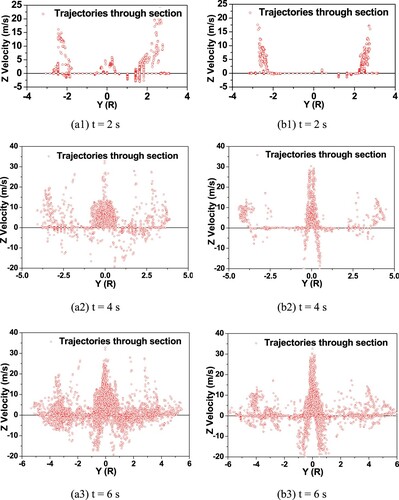
Figure 18. The influence of the tip vortex on the distribution of the sediment particles in the flow field over time for different blade tips.
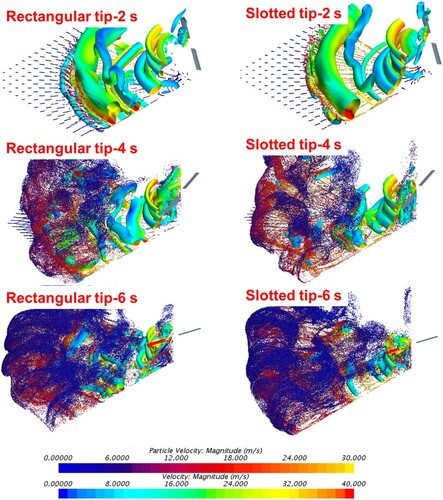
Figure 19. The development of the dust cloud over time in the IGE flow field: rectangular-tip blade.
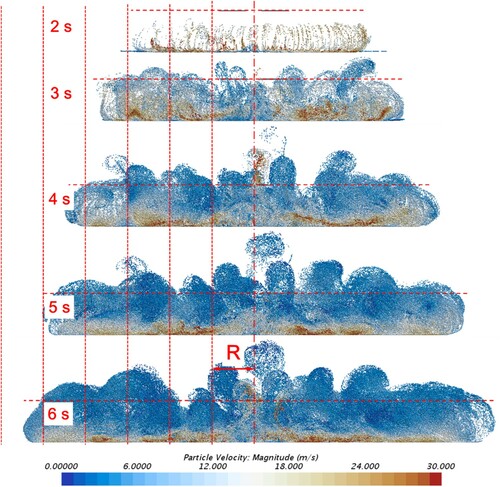
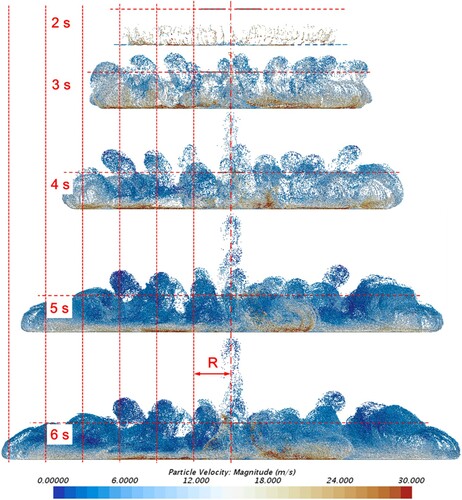
Figure 20. The development of the dust cloud over time in the IGE flow field: slotted-tip blade.
The previous analysis of the movement and distribution of the sediment particles in the IGE field is based on a quantitative analysis of the particles in specific areas. However, the helicopter IGE brownout is a visual phenomenon that can be directly observed, and the development and severity can be perceived. Therefore, it is necessary to conduct a visual analysis of a large number of sediment particles being moved by the IGE flow and forming a dust cloud over time. Since the IGE flow field and sediment particles in this study are distributed evenly around the rotation center, the development of the dust cloud and tip vortex is shown in a quarter of the calculation domain (Figure ). The results clearly show the process of the particles being accelerated around the vortex core by the far wake. A comparison of Figure and Figure indicates that at time t = 4 s, the particles affected by the interaction between the tip vortex and the ground have almost no circumferential velocity. The particles far away from the rotation center are not directly affected by the tip vortex and disperse outward at the same time, indicating that the particles in the induced flow field can only diffuse radially along the rotation center without tangential acceleration. In addition, they can only be uplifted after being affected by the interaction between the tip vortex and the ground; otherwise, they only move near the ground. As the number of sediment particles suspended in the air increases after being uplifted, the outline of the dust cloud gradually becomes clear, and the particles diffuse outward at low speed and curl inward along the rotation center simultaneously. The distribution of those particles is clearly structured in the height direction, exhibiting a ridge-and-valley shape. The particle trajectory points in Figure show that the velocity is unstable in the Z-direction, and the movement of the scattered sediment particles is three-dimensional. When the particles pass through the disc plane, the trajectory point cloud is formed, as shown in Figure . At time t = 4 s, no particles have entered the downwash, but they have gathered in the region far away from the rotation center, and the particle concentration around the rotor is relatively low. However, over time, an increasing number of particles appear around the rotor, and some enter the downwash, resulting in a higher velocity in the negative Z-direction, as shown in Figure .
The cross-sectional views of the rotation center of the dust clouds in the field with different tips are shown in Figures and . The inhibition of the slotted-tip blade on the development of the dust cloud in the field can be observed; however, the differences between the dust clouds are not substantial before 4 s. The average height of the sediment particles with a high velocity outside the rotation center gradually decreases over time. Particles with low velocity dominate the main portion of the dust cloud. After 4 s, the difference in the particle movement in the field caused by the tip shape becomes significant, and the following differences are observed. In the field of the slotted-tip blade, the concentration of particles above the disc plane is significantly lower than that of the rectangular-tip blade. However, the horizontal extent of the dust cloud is larger in the field of the slotted-tip blade than that of the rectangular-tip blade. This result shows that the slotted-tip blade can expel the sediment particles that are uplifted by the carrier flow in the upwash region in the radial direction, significantly reducing the number of sediment particles entering the disc plane. The slotted-tip blade reduces the tip vortex intensity by introducing a small, turbulent jet from the leading edge and injecting it into the tip vortex. As a result, the entrainment effect of the tip vortex on the sediment particles and the sediment concentration in the dust cloud are reduced, significantly reducing the severity of brownout in the IGE flow field.
5. Conclusion
In this study, a coupled CFD-DEM approach was used to investigate the brownout problem in the IGE flow field of a hovering helicopter with full-scale rotors with different tip shapes. The rotor uplifted sediment particles from the ground, forming a dust cloud. The motion and distribution of sediment particles in the flow field and the dust cloud development were investigated numerically in a 6-s period. The influence of a slotted-tip blade and rectangular-tip blade on the motion and distribution of sediment particles was analyzed and compared. The following conclusions were obtained
The interaction between the tip vortex and the ground is the dominant factor affecting the movement and uplift of the sediment particles. The particles are concentrated around the tip vortex core close to the ground, forming a layered structure, and the velocity direction of the particles is not in the tangential direction of the laminar flow of the vortex core.
Unlike the rectangular-tip blade, the slotted-tip blade causes a small, turbulent jet to occur from the leading edge that is mixed with the tip vortex, disrupting the laminar flow of the tip vortex core, rapidly dissipating the tip vortex, and reducing the intensity of the vortex core reaching the ground.
The distribution of sediment particles uplifted by the carrier flow and transported to the disc plane is uneven and irregular. Some of the particles diffuse radially along the rotation center, while others are concentrated in the disc plane. The particles are clustered and form a ridge-and-valley structure; the number of clusters around the blades is significantly lower in the slotted-tip blade than the rectangular-tip blade.
The sediment particles near the rotation center are uplifted by the carrier flow, resulting in a substantial difference in the velocity in the Z-axis direction. The interaction between the root vortex and the ground primarily affects the velocity in the positive Z-direction, whereas the rotor downwash mainly affects the velocity in the negative Z-direction.
The slotted-tip blade provides better performance than the rectangular-tip blade, namely, better dispersion of the suspended sediment particles along the rotation center, fewer sediment particles entering the disc plane, and a lower concentration of the dust cloud above the disc plane. Thus, the slotted-tip blade significantly reduces the severity of brownout in the IGE flow field.
Limited by the current computing power, it needs a lot of computing resources to solve the movement and distribution of sediment particles in the flow field for a long time. Therefore, it is unrealistic to accurately solve the brownout at present. In the future work, it may be a feasible scheme to use CPU to solve the flow field, coupled with GPU array to solve the motion of a large number of particles. With the improvement of the numerical model of flow field and particle, and the rapid development of CPU and GPU, this special phenomenon may obtain more accurate numerical results.
Acknowledgments
This work was supported by a grant from A Project Funded by the Priority Academic Program Development of Jiangsu Higher Education Institutions (PAPD) and Postgraduate Research & Practice Innovation Program of Jiangsu Province (KYCX19_0200). The authors would like to express their gratitude for their support throughout the study.
Disclosure statement
No potential conflict of interest was reported by the author(s).
Additional information
Funding
References
- Cheng, W., Yu, H., Zhou, G., & Nie, W. (2016). The diffusion and pollution mechanisms of airborne dusts in fully-mechanized excavation face at mesoscopic scale based on CFD-DEM. Process Safety and Environmental Protection, 104, 240–253. doi:https://doi.org/10.1016/j.psep.2016.09.004
- Cotel, A. J. (2002). Turbulence inside a vortex: Take two. Physics of Fluids, 14(8), 2933–2934. doi:https://doi.org/10.1063/1.1491245
- Cotel, A. J., & Breidenthal, R. E. (1999). Turbulence inside a vortex. Physics of Fluids, 11(10), 3026–3029. doi:https://doi.org/10.1063/1.870161
- Ez Abadi, A. M., Sadi, M., Farzaneh-Gord, M., Ahmadi, M. H., Kumar, R., & Chau, K.-w. (2020). A numerical and experimental study on the energy efficiency of a regenerative heat and mass exchanger utilizing the counter-flow Maisotsenko cycle. Engineering Applications of Computational Fluid Mechanics, 14(1), 1–12. doi:https://doi.org/10.1080/19942060.2019.1617193
- Guo, N., & Leu, M. C. (2013). Additive manufacturing: Technology, applications and research needs. Frontiers of Mechanical Engineering, 8(3), 215–243. doi:https://doi.org/10.1007/s11465-013-0248-8
- Han, Y. O. (2005, January). Diffused tip vortex structure generated by a slotted tip rotor blade. 43rd AIAA Aerospace Sciences Meeting and Exhibit. doi:https://doi.org/10.2514/6.2005-57.
- Han, Y. O., & Leishman, J. G. (2004). Investigation of helicopter rotor-blade-Tip-vortex alleviation using a slotted tip. AIAA Journal, 42(3), 524–535. doi:https://doi.org/10.2514/1.3254
- Hance, B. T. (2012). Effects of body shapes on rotor in-ground-effect aerodynamics. University of Maryland.
- Harrington, W., Savage, J., McKinley Dr, R. A., Braddom, S., Szoboszlay, Z., & Burns, H. N. (2010). 3D-LZ brownout landing solution. American Helicopter Society 66th Annual Forum.
- Hertz, H. (1882). Ueber die Berührung fester elastischer Körper. Journal Fur Die Reine Und Angewandte Mathematik, 1882 (92), 156–171. doi:https://doi.org/10.1515/crll.1882.92.156
- Hidayat, M., & Rasmuson, A. (2005). Some aspects on gas-solid flow in a U-bend: Numerical investigation. Powder Technology, 153 (1), 1–13. doi:https://doi.org/10.1016/j.powtec.2005.01.016
- Hjelmfelt, A. T., & Mockros, L. F. (1966). Motion of discrete particles in a turbulent fluid. Applied Scientific Research, 16(1), 149–161. doi:https://doi.org/10.1007/BF00384062
- Hu, J., Xu, G., Shi, Y., & Wu, L. (2020). A numerical simulation investigation of the influence of rotor wake on sediment particles by computational fluid dynamics coupling discrete element method. Aerospace Science and Technology, 105, 106046. doi:https://doi.org/10.1016/j.ast.2020.106046
- Iversen, J. D., Greeley, R., Marshall, J., & Pollack, J. B. (1987). Aeolian saltation threshold: The effect of density ratio. Sedimentology, 34(4), 699–706. doi:https://doi.org/10.1111/j.1365-3091.1987.tb00795.x
- Johnson, B., Leishman, J. G., & Sydney, A. (2009). Investigation of sediment entrainment in brownout using high-speed particle image velocimetry. 65th Annual National Forum of the American Helicopter Society.
- Kalra, T. S., Lakshminarayan, V. K., & Baeder, J. D. (2013). Effect of tip geometry on a hovering rotor in ground effect: A computational study. 31st AIAA applied aerodynamics conference. doi:https://doi.org/10.2514/6.2013-2542.
- Milluzzo, J. I. (2012). Effects of blade tip shape on rotor In-ground-effect aerodynamics. University of Maryland.
- Mohanarangam, K., Tian, Z. F., & Tu, J. Y. (2008). Numerical simulation of turbulent gas-particle flow in a 90° bend: Eulerian-Eulerian approach. Computers and Chemical Engineering, 32(3), 561–571. doi:https://doi.org/10.1016/j.compchemeng.2007.04.001
- Norouzi, H. R., Zarghami, R., & Rahmat Sotudeh-Gharebagh, N. M. (2016). Coupled CFD-DEM modeling. John Wiley & Sons, Ltd First.
- Phillips, C., Kim, H. W., & Brown, R. E. (2010). The flow physics of helicopter brownout. American Helicopter society 66th Annual Forum.
- Qiu, L. C., & Wu, C. Y. (2014). A hybrid DEM/CFD approach for solid-liquid flows. Journal of Hydrodynamics, 26(1), 19–25. doi:https://doi.org/10.1016/S1001-6058(14)60003-2
- Ramezanizadeh, M., Alhuyi Nazari, M., Ahmadi, M. H., & Chau, K. w. (2019). Experimental and numerical analysis of a nanofluidic thermosyphon heat exchanger. Engineering Applications of Computational Fluid Mechanics, 13(1), 40–47. doi:https://doi.org/10.1080/19942060.2018.1518272
- Schiller, L., & Naumann, A. (1933). Über die grundlegenden berechnungen bei der schwerkraftaufbereitung. Zeitschrift Des Vereines Deutscher Ingenieure, 77, 318–320.
- Shi, W., Li, J., Gao, H., Zhang, H., Yang, Z., & Jiang, Y. (2020). Numerical investigations on drag reduction of a civil light helicopter fuselage. Aerospace Science and Technology 106, 106104. doi:https://doi.org/10.1016/j.ast.2020.106104
- Syal, M., & Gordon Leishman, J. (2013). Modeling of bombardment ejections in the rotorcraft brownout problem. AIAA Journal, 51(4), 849–866. doi:https://doi.org/10.2514/1.J051761
- Syal, M., & Leishman, J. G. (2011). Comparisons of predicted brownout dust clouds with photogrammetry measurements. 67th Annual Forum of the American Helicopter Society.
- Sydney, A., Baharani, A., & Leishman, J. G. (2011). Understanding brownout using near-wall dual-phase flow measurements. 67th Annual Forum of the American Helicopter Scociety.
- Wang, Q., & Zhao, Q. (2019). Rotor aerodynamic shape design for improving performance of an unmanned helicopter. Aerospace Science and Technology 87, 478–487. doi:https://doi.org/10.1016/j.ast.2019.03.006
- Wong, O. D., & Tanner, P. E. (2010). Photogrammetric measurements of an EH-60L brownout cloud. American Helicopter Society 66th Annual Forum. doi:https://doi.org/10.4050/JAHS.61.012003
- Yu, H., Cheng, W., Xie, Y., & Peng, H. (2018). Micro-scale pollution mechanism of dust diffusion in a blasting driving face based on CFD-DEM coupled model. Environmental Science and Pollution Research, 25(22), 21768–21788. doi:https://doi.org/10.1007/s11356-018-1992-4