
 ?Mathematical formulae have been encoded as MathML and are displayed in this HTML version using MathJax in order to improve their display. Uncheck the box to turn MathJax off. This feature requires Javascript. Click on a formula to zoom.
Abstract
The present work investigates heat transfer through natural convection using a series of experiments and computational modeling using Computational Fluid Dynamics (CFD) simulations in a one-meter bundle pipe with three internal pipes. The exact complex geometry is modeled where the flow channel is reduced through a spiral groove attached to a rod inside the internal tubes which was challenging compared to the flow in circular pipes in previous studies. To support the computational modeling investigations, convective heat transfer analysis is also studied through experiments with water as the production and heating fluids. Further, simulations are carried out with water-crude oil and aqueous ethylene glycol-water as the heating mediums and production fluids, respectively. Based on the heat transfer rates estimated from experimental data and CFD simulation results for the respective tubes, a modification to an existing Nusselt number is proposed for the range of temperature and flow rates used in the experiments. The proposed model, Nui = Prim Rain, was validated against experimental data and a good agreement with R2 values of more than 0.94 was achieved.
1. Introduction
Rapid growth in hydrocarbon demand and crude oil production has directed the explorations towards offshore operations ranging from shallow to ultra-deepwater. However, due to the extreme ambient conditions of low temperature and high pressure, hydrate formation and solid depositions became major challenges in the upstream operations. The drop in temperature and pressure of crude oil when being transported provide a friendly environment for the formations of hydrates and other solids such as wax, which grow into larger aggregates overtime/length of the pipeline. Wax formation in the pipeline has a direct effect on fluid flow and heat transfer. The aggregates of wax increase fluid viscosity which causes critical flow issues such as huge pressure drop inside the flow lines, high pumping power requirements, reduced permeability, change in oil rheology, clogging the flow line, fittings, control valves, and unplanned disruptions in production (Mansourpoor et al., Citation2019). A reduction in the thermal conductivity due to wax aggregates leads to a reduction in convective heat transfer coefficient and heat transfer in the pipe. Therefore, designing and operating offshore pipelines require advanced risk management techniques to mitigate these potential adverse effects (Kenny, Citation2018). Flow-related issues such as hydrates formation, wax, and asphaltenes deposition, slugging, scales, corrosion, erosion, and emulsions were the motivation to introduce flow assurance techniques in the 1990s (Camargo et al., Citation2004). Flow assurance aims to achieve profitable, safe, and reliable operations in the given oil & gas price scenario (Arcangeletti et al., Citation2019).
Flowline thermal management, as a flow assurance strategy, is achieved through means of passive insulation and active heating. Active heating is classified as direct and indirect heating. Referring to direct heating, heat is added to the production fluid through electrical current in cables attached to the pipe and in indirect heating, through hot fluid circulation where the heating medium flows in an auxiliary pipe at high temperature. The indirect heating method results in such a configuration, identified as a pipeline bundle system, where the internal flow lines consisting of production pipes, heating pipe, and heating medium return pipe are kept inside a larger insulated sleeve pipe.
The design and operation of the bundle-pipeline systems require accurate prediction of heat transfer and temperature profiles in different pipes along the length of the bundle, which in turn, necessitates the availability of accurate correlations for heat transfer coefficients on different surfaces in the bundle system (Ahmadi et al., Citation2019; Sadeghzadeh et al., Citation2020).
Heat transfer correlations and experimental data for forced convective heat transfer in vertical and horizontal pipes have been published over the years, where the heat transfer coefficient was correlated with dimensionless numbers of Reynolds and Prandtl (Churchill & Chu, Citation1975; Liu et al., Citation2006). Convective heat transfer in circular and rectangular pipes is affected by flow velocity, pipe diameter, wall thickness, and pipe material which have a significant influence on the overall heat transfer coefficient. It was reported that increasing the wall thickness reduces the heat flux in the pipe (Adelaja et al., Citation2014). Also, wall thickness has a direct effect on the temperature profiles for the bulk fluid and the inner wall of the pipe. When the wall-to-fluid conductivity ratio is less than or equal to 25, increasing pipe thickness will make the inner wall surface approaching the uniform heat flux condition despite changes in the outer wall temperature (Zhang et al., Citation2010).
In many heat transfer prediction scenarios, a correlation for similar systems can be considered within the operating conditions and physical properties limitations of the correlation, and thus, bundle-pipes can be considered as a special case of heat exchangers. However, in a typical bundle pipe, the heat is transferred from the heating pipe to the carrier pipe and then from the latter to the production pipes through series of conduction and convection mechanisms. Also, bundle pipelines come in several configurations which have a direct influence on the heat transfer within the system. For example, the use of heat return lines will create regions where both cooling and heating occur inside the bundled flow line. And thus, more complicated heat transfer takes place as it does not follow uniform heating or cooling along the bundle length.
With the advancements in process modeling and computing methods, simulating processes and industrial applications has garnered great interest in the research society (M.H. Ahmadi et al., Citation2019a). Process modeling and simulation are widely used to achieve intelligence to improve the design and optimize production/manufacturing processes (Oliveira et al., Citation2011; Zhang & Anosike, Citation2010). The studies considering bundled pipelines for crude oil production and transportation are limited, pilot scaled, and operating conditions were not close to industrial ones where very few correlations were developed in the past. A previous study on the tube bundle was performed, however, the developed correlation for Nusselt number was based on CFD results with limiting assumptions of constant wall temperatures and the geometry did not closely represent the bundled pipe (Liu et al., Citation2006).
As the heat transfer between the fluids in the bundle pipe is through natural convection, heat transfer is driven by the temperature differences between the fluids. The heat is transferred from the heating medium to the fluid in the carrier pipe and further to the fluids in the production pipes. The additional heat source for modeling the heat transfer phenomena is not considered in the study. The geometry of the flow domain has a great effect on the fluid flow and heat transfer, thus, different correlations were developed for different geometries based on the flow regimes and the surface area available for heat transfer ranging from simple enclosures and cylindrical tubes to helical pipes and complex bundle-pipes. The selection of a suitable turbulence model for the flow problem in CFD modeling is a critical factor, a few studies have compared the use of different models (standard k– ε model, k- ω and SST) and the effect on the accuracy of the results. For a pressure drop study in staggered bundle-pipes (Balaji & Prakash, Citation2016), the k-ε model shows a satisfactory agreement with the pressure drop theoretical data compared to k-ω and SST. The k-ε model was used in several natural convection studies for different geometries and was found to provide a satisfactory agreement for friction factor and Nusselt number evaluations (Czarnota & Wagner, Citation2016; Kuznetsov & Sheremet, Citation2010; Markatos & Pericleous, Citation1984).
In computational fluid mechanics, one of the areas that have been investigated involves the application of group method of data handling (GMDH) neural networks, especially concerning pulsating heat pipe thermal conductivity and thermal resistance estimation (Mohammad Hossein Ahmadi, Sadeghzadeh, Raffiee, et al., Citation2019b). In the latter investigation, it was documented that several factors affect how pulsating heat pipes perform. Some of the documented factors include the length of each section, the angle of inclination, the heat input, thermal conductivity, the filling ratio, and the outer and inner diameters of the tube. Indeed, the study was important to the field of computational fluid mechanics because it gave insight into some of the parameters that manufacturers ought to consider concerning the pulsating heat pipe design process. Another area that has been investigated involves the behavior of nanofluidic thermosyphon heat exchangers, with a particular focus on numerical analyses and experimental approaches (Ramezanizadeh et al., Citation2019). In this latter study, it was acknowledged that thermosyphons gain application to various systems involving heat transfer due to the high effective thermal conductivity with which they are associated. As such, the purpose of the study was to conduct an experimental investigation to discern the thermal performance of thermosyphon heat exchangers. The nanofluid used was Ni/Glycerol–water with different concentrations of 1.25, 0.625, and 0.416 g/lit. In the results, the study demonstrated that when thermosyphons are used in place of copper tubes, with the dimensions kept constant, the resulting heat transfer capacity improvement is so significant.
For the case of Ethylene Glycol-Water mixtures, the study by Vandrangi et al. (Vandrangi et al., Citation2020) sought to predict the coefficients of heat transfer and their impact on system behavior. Here, the authors focused on the prediction of the heat transfer coefficient of SiO2, relying on CFD simulation, with 40% of ethylene glycol and 60% of water being the experimental conditions. In the findings, it was established that a significant increase in heat transfer coefficients in Al2O3/40EGW nanofluids was observed. When SiO2/40EGW was used as the base fluid, a value of 51.0% was found to be the heat transfer enhancement, with 1.0% being the volume concentration and 80°C being the temperature. Overall, the study confirmed the superiority of 40EGW, especially with higher thermal conductivity and heat transfer coefficients (Vandrangi et al., Citation2020). Another interesting context that has been studied involves a CFD approach seeking to analyze shell-and-tube heat exchanger performance, especially the hydro-thermal shell-side performance aspect (Alfarawi, Citation2020). From the investigation (Alfarawi, Citation2020), the motivation was to steer improvements in the performance of a conventional shell-and-tube heat exchanger, especially via the utilization of a 3D CFD analysis. From the study, it was noted that when the baffle cuts are reduced from 45% to 25% and, the number of baffles increased, there tends to be increased pressure drop and heat transfer (Alfarawi, Citation2020). Specific results suggested that it is at six baffles and 35% baffles cut configuration that, with equal pumping constraint, a value of 2.15 is obtained as the optimal or best factor of thermal enhancement. Therefore, the findings were informative because they gave insight into some of the system conditions that are ideal for optimal performance, especially concerning thermal enhancement.
About the annular elliptical fin-and-tube heat exchanger, detailed numerical investigations have strived to give insight into the heat exchanger systems’ thermo-fluid characteristics (Nemati et al., Citation2020). For the turbulent flow, its simulation in the latter study was achieved via the use of a transition SST model. Also, the investigation focused on the impact posed by parameters such as fin densities, horizontal to vertical fin diameter ratios, and air velocities (Nemati et al., Citation2020). In the results, the study demonstrated that for heat transfer coefficient and pressure drop, between the simulations and the proposed correlations, the maximum deviations entailed 3.2% and 5.6%, respectively. As such, based on the study, it is worth inferring that when compared to elliptical fins, circular fins exhibit higher entropy generation.
Additional investigations have focused on cross-flow heat exchangers exhibiting elliptical tubes, with a particular emphasis on the parameters of heat transfer and flow characteristics (Mohanan et al., Citation2020). In such a study, the numerical investigations have strived to unearth how transverse and longitudinal pitch-to-diameter ratio variation affects the performance of elliptical tube-based cross-flow heat exchangers (Mohanan et al., Citation2020). Specific variables whose impact was investigated involved the impact of tube arrangement and the aspect ratio about how they affect the cross-flow heat exchanger performance. In the conclusions, the investigation suggested that optimal performance is likely to be realized if the values of the pitch-to-diameter for the transverse and longitudinal positions are set at 1.75:2 and 2:1.75, respectively. Lastly, investigations have been conducted concerning finned pipes that have internal V-cut twisted pipes, especially relative to how nanofluids affect the nature of heat transfer in the system (Alwan et al., Citation2020). The numerical and experimental investigation has strived to unearth how, in circular finned tubes that have V-cut twisted pipes, a twist ratio of 1.85 tends to enhance the heat transfer (or otherwise).
A previous study on the tube bundle was performed, however, the developed correlation for Nusselt number was based on CFD results with limiting assumptions of constant wall temperatures, and the also the modeled geometry did not closely represent the bundled pipe. Hence, the present work investigated heat transfer through natural convection using a series of experiments and computational modeling using Computational Fluid Dynamics (CFD) simulations in a one-meter bundle pipe with three internal pipes. The geometry model simulated the exact complexity where the flow channel is reduced through a spiral groove attached to a rod inside the internal tubes which was challenging compared to the flow in circular pipes in previous studies.
2. Equipment and experimental methodology
Experiments were conducted on a one-meter bundle with three internal pipes (one heating and two production pipes), representing the actual bundled flow lines in the industry, a schematic diagram of the flow circuit is shown in Figure (a). All pipes are made of copper and the configuration is shown in Figure (b). The same bundle pipe used by Liu (Liu et al., Citation2006) is used in this study for experiments.
Figure 1. (a) Experiment setup for bundle pipe; (b) Schematic diagram of the bundle; (c) Thermocouples location in the carrier pipe.
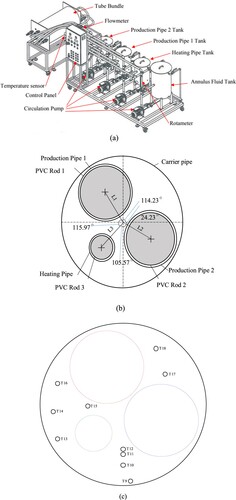
The tanks for the carrier and the internal pipes run independently, with separate inlets, pumps, and flowmeters. Flow circuits are identical for both the production pipes and the heating pipe. The storage tanks (T101, T201, T301, and T401) are filled to the required level with the water, which is then circulated through the respective bundle flow channels (a heating pipe, production pipe, and outer annulus) by the pumps. The water is controlled at the desired temperature using heating coils within the tanks, which are activated by temperature controllers fitted to the tanks. The water enters the bundle and returns to the respective tank after passing through the flow channels. Centrifugal pumps with bypasses have been fitted to all flow circuits and ball valves have been fitted downstream of the pumps such that the flowrates through the various channels can be accurately controlled. The flow loop is continuous and the water is constantly recycled. Inlet and outlet temperatures are measured through K-type thermocouples installed separately for each pipe, and another 11 thermocouples (TT501 – TT511) are fitted in the carrier pipe for the temperature measurement of the annulus fluid as shown in Figure (c). The experimental run is continued till a steady-state condition is achieved for each case in the proposed matrix (as given in Table ) which normally takes around 5 h for the temperature to stabilize. In practice, bundle flow lines take huge flows through the production and heating pipes. These flows would be identical for a full-cross section laboratory model if the same internal heat transfer characteristics were to be maintained. Over the length of the bundle used here (1 m), the temperature gradient would be quite small. Thus, there was a need to reduce the flow channel for the internal pipes to achieve higher flow velocities and subsequently, higher heat transfer rates. The flow channel in the internal pipes was reduced by inserting PVC rods with a spiral groove of a close fit to the respective pipe diameter. The spiral groove was rectangular with depth and width of 12 and 17 mm, respectively. Spines of around 3 mm separated the grooves to increase the turbulence inside the pipes. Data including outlet temperatures and flow rates were collected from the experimental runs and tabulated for further analysis.
Table 1. The experimental matrix used in the study.
The experimental matrix in Table was proposed for the investigation of the heating medium temperature effect on the heat transfer inside the bundle, thus, the flow rate was maintained constant in the first 8 runs while varying the temperature between 50 and 80 °C with Prandtl numbers in the range 2–8 and flow velocity of 0.0157 and 0.002 m/s for heating and production pipes, respectively. Another set of experimental runs was conducted to investigate the effect of heating medium flow rate ranging from 2–10 LPM at constant heating temperature, flow velocity was varied between 0.0039 and 0.0196 m/s for the heating medium while maintaining a constant flow velocity of 0.0017 m/s for the production pipes. Outlet temperatures and flow rates were recorded for the heat transfer rate (Q) and heat flux calculations. Table represents a summary of the uncertainty limit and nominal values for each variable.
Table 2. Summary of the uncertainty limit and nominal values for experimental variables.
3. Computational Fluid Dynamics
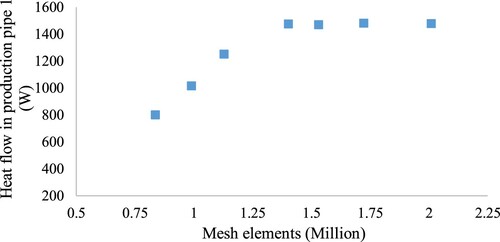
Computational Fluid Dynamics (CFD) simulations are used to predict fluid flow and complex heat transfer characteristics. The governing equations for the model are solved together for each node in the developed mesh to investigate the system's thermodynamic behavior. ANSYS Fluent version 19.0 was used to develop a three-dimensional model of the prescribed bundle pipe and the enhanced design by reducing the flow channel and creating spiral flow. The geometry and the final mesh are shown in Figure . The number of optimal mesh elements required to obtain mesh independent simulation has been determined by performing steady-state simulations with tetrahedral element sizes ranging from 0.8–2.0 million as shown in Figure . The final mesh after the mesh independent study consisted of 1.4 million tetrahedral cells.
Figure 2. (a) 3D model for the bundle-pipe; (b) Mesh for the bundle-pipe.
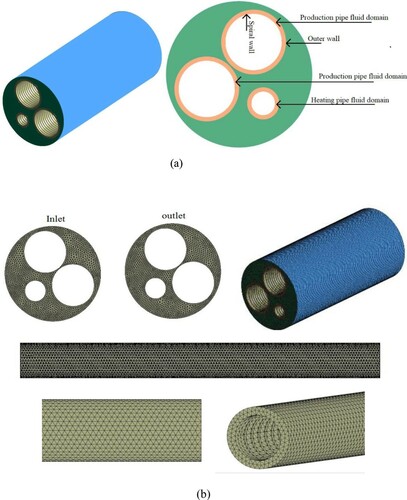
Figure 3. Mesh independency study.
The fluid flow and heat transfer processes are generally governed by various differential equations as stated below:
Continuity equation:
(1)
(1) where v is the velocity.
Momentum equation:
(2)
(2) where
is the pressure, and
is the shear stress.
Energy equation:
(3)
(3) where H is the source term of heat.
The operating and boundary conditions are specified for the mesh dependence study. Pipe inlets were set to be velocity inlets and outlet boundary conditions as pressure outlet, pipe outer surfaces are set to walls and the heat transfer medium is water (as conducted in experiments). Flow velocities and inlet temperatures are to be input to the simulation as experimental operating conditions. Reynolds-Averaged Navier-Stokes realizable k-ε (epsilon) turbulence model is considered to analyze the fluid flow in the production pipelines (Czarnota & Wagner, Citation2016). The realizable k- ε model is capable of accurately solving the flow parameters that are close to the near-wall region (Kuznetsov & Sheremet, Citation2010). The mesh refinement near the wall assures a y+ range of 30 < y+ < 300 (Markatos & Pericleous, Citation1984) and hence, the realizable k- ε turbulence model helps the simulation to accurately analyze the fluid flow and heat transfer in the bundle-pipes. The realizable k-ε model varies from the standard k−ε model in two ways. Firstly, it invokes a new formulation for the turbulent viscosity: Cμ is not a constant like in the standard model but a variable. The second variation is a new transport equation for the dissipation rate, ε, that is derived from an exact equation for the transport of the mean-square vorticity fluctuation. As a result, it mainly gives improved predictions for the spreading rate of increased velocities and wall shears, along with a superior ability to capture the mean flow of complex structures and for flows involving rotation, boundary layers under strong adverse pressure gradients, separation, and recirculation. As the present study deals with geometries that contain spiral flows, the realizable k- ε turbulence model well suits for the CFD methodology to achieve precise simulation results.
In the k-ε turbulence model, the energy in the turbulence is computed from the turbulent kinetic energy (k), and the rate of dissipation of the turbulent kinetic energy is computed from the turbulent dissipation (ε) (Anderson, Citation2009).
The turbulent kinetic energy, k is described by:
(4)
(4) where,
k: turbulent kinetic energy
ν: velocity
µ: dynamic viscosity
ε: dissociation rate
σε: empirical constant
S: source term of heat
and dissipation rate, ε (epsilon) is given by:
(5)
(5)
Pk: shear produced by pressure
σε: empirical constant
The near-wall boundary layer turbulent settings are based on the variety of the turbulence model considered. Because the frictional drag and heat transfer effects are significantly effective near the walls, it is highly necessary to obtain a refined mesh near the walls to iterate the steep profile within the boundary layer. The refined mesh requirements are generally expressed in terms of dimensional near-wall distance. The enhanced wall treatment for the k-epsilon model is used because this near-wall treatment will automatically switch between the wall function and viscous sublayer resolution based on the value of y+. The turbulence specification method used for this study is the intensity and hydraulic diameter. Turbulence intensity is a measure of the strength of turbulence fluctuations. A value of 0.05 has been considered for this study. Hence, the turbulence fluctuation velocity is 5% of the mean velocity.
The simulation is iterated till the desired convergence criteria of residuals for continuity, momentum, and energy equations of 1 × 10⁻⁴, the criteria for stability and consistency are achieved. Due to the spiral flow in the internal pipes, the streamlines are not linear. The uneven mesh at the spiral groove limits the use of tighter convergence criteria. However, for the present work, consistency and stability of the CFD simulation were obtained with the convergence criteria of 1 × 10⁻⁴. Several CFD studies with complex heat and mass transfer analysis were performed using criteria of solution residuals and satisfactory results were reported (Cornelissen et al., Citation2007; Gulawani et al., Citation2006; Jaworski & Nienow, Citation2003; Zschaeck et al., Citation2014).
4. Results and discussions
Experiments were conducted to evaluate the convective heat transfer in bundle pipe consisting of three internal pipes. The main aim of using hot fluid circulation active heating is to maintain the temperature or heat the production fluid. The heat transfer rate Q for the pipes is calculated from the expression:
(6)
(6)
Q: Rate of heat transfer
m: mass flowrate
Cp: Specific heat
The data for all the experimental runs were recorded, the total heat transfer rate through each of the pipe surfaces is calculated, where the heating pipe had a negative Q value as the heat is transferred from the heating medium to the carrier fluid and then to the rest of the bundle. There is a total heat loss to the environment as the bundle is not fully insulated, the two endplates holding the pipes in place at the inlet and outlet take part in this total heat loss observed.
The 3-dimensional model was used for the prediction of the natural convective heat transfer in the interstitial space in the bundle-pipe, simulations were run until the model converged and temperatures at different thermocouple locations were reported. The main objective was to test the methodology and reliability of using CFD in obtaining the surface temperature of the internal pipes for surface heat transfer coefficient evaluation.
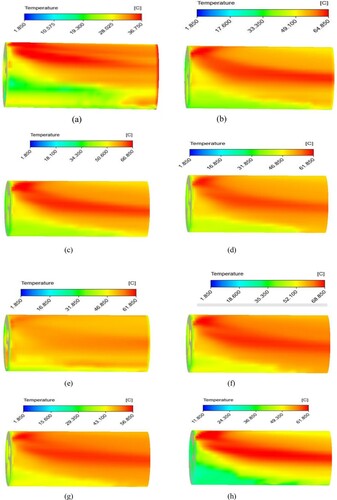
The CFD simulations investigated the convective heat transfer inside the bundle at different heating medium temperatures (50 - 80°C). All the simulation runs were a close simulation for the experimental setup and thus, water was used as a heating medium and production fluid as well. The flow inside the internal pipes can be seen from the contours of flow velocity in Figure . The heat transfer inside the bundle can be visualized through the temperature contours as shown in Figure . Following the active heating technique, the hot water in the heating pipe loses heat to the carrier fluid, and then it heats the production fluid.
Figure 4. Flow velocity contours for the spiral flow in internal pipes.
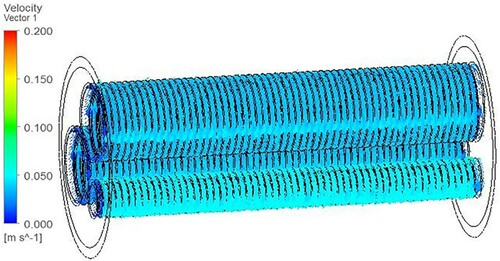
Figure 5. Temperature contours for spiral groove configuration with water as heating, interstitial, and production fluids.
After convergence was achieved, the temperature readings from the CFD simulation at appropriate thermocouple locations were captured for validation with experimental data. Thermocouples were located at the inlet and outlet of each pipe and in the annulus space in the carrier pipe as marked in Figure (c). Boundary conditions in the developed CFD model were set at the inlet, outlet, and walls for the respective pipes. Hence, the average temperature at these boundary conditions was obtained for each pipe and compared to the respective thermocouple reading from the experiment. While for the thermocouples in the carrier pipe space (TT501-TT511), a temperature line was drawn in CFD post-processing for a close representation of the 500 mm K-type thermocouples used in experiments.
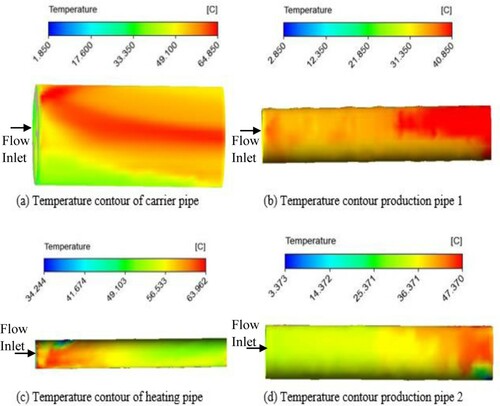
Temperature contours for water in the carrier pipe at different temperatures of heating and production pipe fluids are shown in Figure . The heat is transferred from the heating pipe to the interstitial fluid in the carrier pipe and further to the rest of the tubes where the main objective of maintaining or increasing the production fluid temperature is achieved.
Figure 6. Temperature contours for carrier pipe at different heating medium and production pipes temperatures. (a) heating temperature = 55°C and Production lines = 35°C. (b) heating temperature = 65°C and Production lines = 35°C. (c) Heating temperature = 45°C and production lines = 35°C. (d) Heating temperature = 75°C and production lines = 35°C. (f) Heating temperature = 75°C and production lines = 45°C. (g) Heating temperature = 75°C and production lines = 55°C. (h) Heating temperature = 65°C and production lines = 45°C.
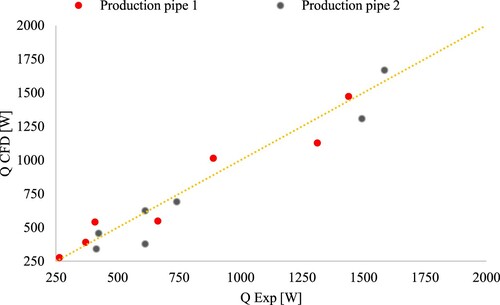
The CFD model was validated against experimental data on the total heat flow in the internal pipes and a good agreement was achieved as shown in Figure .
Figure 7. Comparison of heat flow between experiment and CFD in production pipe 1 and production pipe 2.
Local temperature readings at appropriate locations of the thermocouple in the annulus space of carrier pipe were exported and validated with experimental readings of the thermocouples (TT501 -TT511). A relative percentage error of less than 6% was obtained when comparing the readings between the experiment and the CFD simulations. CFD simulations reported slightly higher temperature readings at thermocouple locations, and this could be due to the heat loss to the surroundings taking place in the experimental runs as the bundle was not fully insulated. CFD readings for the thermocouple TT511 reported a higher deviation from the experimental data since its location is close to the top of the pipe (refer to Figure ) where a very small air gap was present in the experimental test rig, and this air gap was unavoidable due to the entry and exit locations of the fluid. However, there is no air gap in CFD simulations. Also, CFD results of the total heat flow in the pipes show satisfactory agreement with experimental ones.
This can be used as a validation of the developed CFD model that is a close representation of the bundle-pipeline system. This model can be further used to produce a wider database for future analysis and modified correlations.
4.1. Performance analysis for existing Nusselt number correlations
Nusselt numbers for different surfaces were estimated using the existing correlations with the constants as reported by Liu et al. (Liu et al., Citation2006). The correlation developed for the current bundle by Liu et al. (Liu et al., Citation2006) gives lower Nusselt number values as compared to the generalized correlation by Churchill & Churchill (Churchill & Churchill, Citation1975) and Churchill & Chu (Churchill & Chu, Citation1975). Experimental values were obtained through manual calculations of the total heat flow through the pipes and the surface heat transfer coefficients using:
(7)
(7)
(8)
(8) Ts is the surface temperature and Tb is the bulk temperature.
The comparison of Nusselt number values from the experiments with the predicted values by different correlations [REFS] are shown in Figures .
Figure 8. Comparison of the experimental Nusselt number with existing Nusselt number correlations for heating pipe.
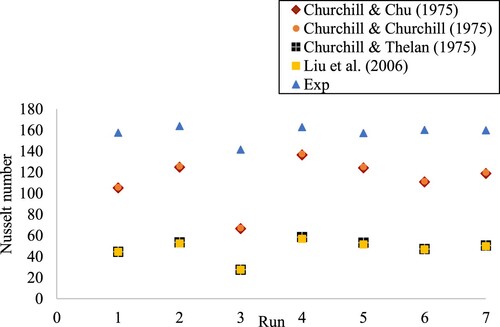
Figure 9. Comparison of the experimental Nusselt number with existing Nusselt number correlations for Production pipe 1.
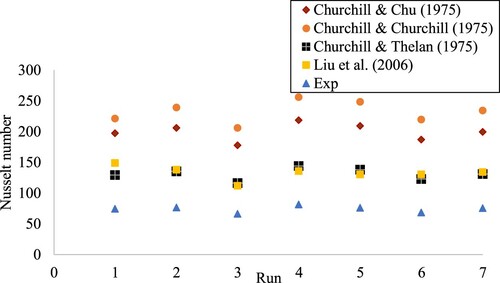
Figure 10. Comparison of the experimental Nusselt number with existing Nusselt number correlations for Production pipe 2.
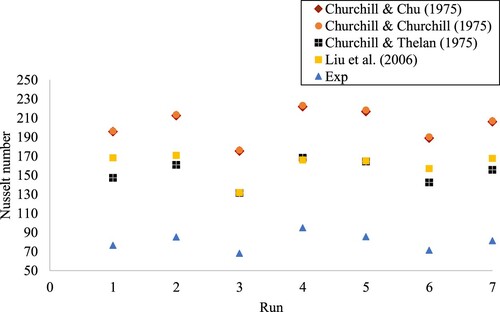
The existing correlations gave a lower value for the heating pipe compared to the Nusselt number values evaluated from the experiments. The first two correlations by Churchill and Chu, and Churchill and Churchill were developed in 1975 based on Prandtl and Rayleigh numbers and certain constants. Liu (Liu et al., Citation2006) fitted the values based on their CFD results, thus, the difference in Nusselt number values for the pipe surfaces.
Analysis of the existing correlations was performed, some discrepancies were observed when comparing the obtained values and a modified model was developed for Nusselt number for each of the tube surfaces based on the general Churchill and Churchill formula. This is due to the fact that the previous correlation was developed based on the CFD model with the assumption of constant wall temperature for the internal pipes, which is not the case with the experimental setup. In the current study, a more accurate model was developed and validated with the experimental results, then the correlation was proposed. The previous model not only assumed constant wall temperature for the pipes but also wasn’t for the exact geometry of the bundle and experiments were performed in a different range of temperatures. Taking these factors into account, it justifies how the Nusselt number correlation developed by Liu (Liu et al., Citation2006) did not perform well for the current experimental readings. Thus, the new correlation for the bundle geometry within the range of operating conditions used was proposed.
Considering the deviation of Nusselt number values for the same surface at the same operating conditions, a new correlation is needed for the current bundle configuration and operating conditions. The predicted values from the experiment are fitted against the existing correlations to observe the best fit for the considered operating conditions of temperature and flow rate.
Regression analysis of experimental data was done to obtain the best fit for Nusselt number, the general concept of relating Nusselt number to Rayleigh and Prandtl Number in natural convection was taken as a basis.
(9)
(9) The modified correlation fits the function of Prandtl and Rayleigh number to the power of ‘m’ and ‘n’ respectively, the proposed correlation for each surface is as follows:
(10)
(10) where i: heating pipe, production pipe 1, and production pipe 2; a, m and n are constants. Fitted values for the constants ‘a’, ‘m’ and ‘n’ are given in Table .
Table 3. Fitted values for the constants (a, m, n).
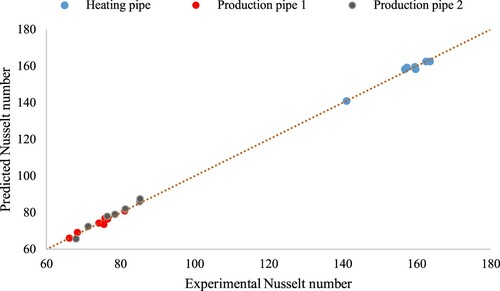
Figure shows a comparison between the experimental and the predicted values of the Nusselt number for the pipes. The predicted values are evaluated from Equation (23) while the experimental values are obtained following the manual calculations. The modified model predicts the Nusselt number more accurately when compared to the existing correlations., a good fit with R2 of more than 0.94 and root mean squared deviation (RMSD) of 1.34%, 1.75%, and 2.199% for heating, production pipe 1, and production pipe 2, respectively. The proposed model gives a better fit of the Nusselt number and thus, the heat transfer coefficient.
Figure 11. Proposed model fitting with experimental data for the pipes.
4.2. Effect of heating medium on the rate of heat transfer inside the bundle
The present study investigated the use of ethylene glycol as a heating medium in place of water. Due to the limitations of the test rig design and pumping requirements, this was achieved using the developed CFD model using water as heating and production fluid. Simulations were run at the same flow rates and inlet temperatures for the cases using water as a heating medium with Prandtl numbers of ethylene glycol in the range 35- 120 °C. Outlet, film, and surface temperatures for each of the pipe surfaces were obtained after convergence. Nusselt number for the pipe surfaces was evaluated and compared to the cases with water as heating fluid.
The temperature of hot water employed in the hot fluid circulation process is mostly within the range of 90–95 °C which limits the effectiveness for deep-water operations or long-distance flow-line operation in low-temperature zones, thus, most industries use other heating fluids such as ethylene glycol which has boiling point temperature in the range of 197.3–329 °C, in place of water. A good understanding of the influence of physical properties in the convective heat transfer in bundle pipes will help in optimized operation in the crude oil production pipeline. However, lower temperature difference and, thus, less heat transfer rates were observed when using ethylene glycol in place of water due to the difference in the physical properties between the two heating fluids (at 40 °C the thermal conductivities are 0.63247 and 0.25588 W/m·K, Prandtl numbers are 4 and above 80, specific heats are 4178 and 2475 J/kg·K for water and ethylene glycol, respectively).
As can be observed from Table , lower Nusselt numbers for the internal pipe were obtained compared to the cases using water as the heating medium, the physical properties have a direct influence on the total heat transferred from the heating fluid to the rest of the bundle. In order to compensate for the lower specific heat, glycol water-based solutions can be used to enhance the physical properties of the pure heating mediums. Physical properties, such as viscosity and density, of a fluid, have a direct impact on the total heat transfer due to the change in temperature and velocity gradients through the boundary layer or over the flow cross-section of a pipe (Kakaç et al., Citation2002).
Table 4. Nusselt number using ethylene glycol and water as the heating fluid.
4.3. Convective heat transfer inside the bundle using crude oil as production fluid
Previous studies focused on water-filled bundles where water is used as the heating medium and production fluid. Thus, the aim to produce a range of data for future investigations was achieved through the CFD approach using water as heating and production fluid. Simulations were run with crude oil as the production fluid at the same operating conditions for the water experiments to compare the thermal performance of each due to the difference in fluid properties.
The physical properties of crude oil used in CFD simulations at the film temperature of the stream as per the equations:
Density():
(11)
(11) Specific heat (Cp):
(12)
(12) Thermal conductivity (k):
(13)
(13) where Tf is the film temperature.
Seven cases of CFD simulations were run using the same inlet temperatures and flow rate used for the study using water as production fluid. After the model converged, outlet temperatures for each stream were obtained. Nusselt numbers for each stream are shown in Table .
Table 5. Nusselt number using crude oil and water as production fluids.
As can be observed from the values, the Nusselt numbers were close as the heating medium is water for both cases. Nusselt number was evaluated using the above equations after obtaining the surface and film temperatures from the CFD results. The carrier pipe temperature was taken as the average temperature of all the cells of the carrier fluid domain.
Active heating in bundled flow lines is an attractive flow assurance strategy for hydrate-safe operation. In this study, a lab-scale flow circuit of bundle pipe was commissioned, experiments were conducted to investigate the convective heat transfer inside the bundle. Water was used in the internal pipes and the annulus space of the carrier pipe, against which the CFD developed model was validated. The experimental matrix was proposed to study the effect of heating medium inlet temperature, where the arrival temperature of the production fluid increased with increasing the heating medium temperature (40–80 °C) and Prandtl numbers in the range 2–8. As observed from the temperature contours, the heat is transferred from the heating medium to the carrier pipe fluid and later to production fluids. These series of convective heat transfer and the thermal interaction between the pipes add complexity to the prediction of heat transfer coefficient inside the bundled flow line. Accurate evaluation of the heat transfer coefficient will help in predicting the total heat gain/loss in the bundled flow line and thus, avoiding the hydrate formation and wax deposition due to temperature drop through using chemical injection or pigging.
The validated CFD model was used to investigate the use of ethylene glycol as a heating medium compared to water, the difference in the physical properties between the two fluids directly influenced the heat transfer from the heating medium to the rest of the pipes. Ethylene glycol provides a wider range of operation when it comes to heating applications compared to water. However, it gives a lower total heat transfer rate and thus, lower Nusselt numbers. Thus, aqueous glycol solutions give better compensation for the physical properties effect.
CFD model was also used to investigate the heat transfer inside the bundle using crude oil as the production fluid at the same operating conditions of the water cases. Surface and film temperatures of the pipes were obtained from the converged model and the surface Nusselt number was evaluated, lower values were observed for the case of crude oil as the huge difference in the specific heat and density affected the total heat gain/loss by the pipes.
The experimental setup used in the present study is a scale-down test rig with much lower flow rates and velocities as compared to the commercial bundle pipelines. Besides, crude oil production pipelines present many complexities such as multiphase flow with water and entrained gases. However, in the present study, the experiments were conducted for single-phase flow with water as the heating and production fluids. In some cases, air or nitrogen is used in the annulus space and, thus, radiation will take part in the heat transfer mechanism which is not considered in this study.
In summary, the CFD approach successfully predicted the convective heat transfer inside the bundle as the geometry developed was the same as the experimental test bundle including the spiral groove attached to the PVC rod for reduction of the flow channel in the pipes. A modified model was proposed for Nusselt number evaluation inside the bundle.
5. Conclusion
Experiments were conducted on bundle pipe with 3 internal pipes, the study investigated the heat transfer inside the water-filled bundle through convection. A computational fluid dynamics model was developed for the same bundle geometry to predict the rate of heat transfer after validation with experimental results. The simulations covered the effect of ethylene glycol as a heating medium in place of water, it was found that lower rates of heat transfer were obtained when using ethylene glycol and this is due to the lower specific heat capacity. However, the higher boiling point for glycol provides a wide range of operating compared to water. The specific heat capacity could be compensated by making glycol-water solutions. Previous academic research on bundles used water as production fluid and heating fluid, thus, the current study used the validated CFD model to provide a wide database and readings for future improvements on the field where the production fluid was set to be crude oil with the provided properties. Existing Nusselt number correlations were analyzed for the obtained experimental results and a model was proposed based on Churchill and Thelen (Churchill & Thelen, Citation1975) general formula relating Nusselt number to Rayleigh and Prandtl numbers. The proposed model gave RMSD of 1.34%, 1.75%, and 2.199% for heating, production pipe 1, and production pipe 2 respectively, for the temperature range of 27–75°C and flow rates of less than 2 LPM for the fluid in carrier pipe.
Experimental work on a wider range of bundle geometries will give a better comprehensive database for validation and thus more accurate results. The following recommendations are proposed for future work in this research area:
The use of configurations that closely simulate the actual bundled flow lines used in transporting crude oil will certainly give more accurate predictions of the temperature profile along the length and the regions where the production fluid starts to lose heat to the surroundings and the regions where it gains heat from the carrier pipe fluid. The knowledge on this reversal heat transfer direction can help in optimizing the use of chemical injection and determining the required pigging frequency as well.
On the other hand, experimental and numerical models developed for tube bundles considered steady-state mostly, the transient behavior will give a better insight considering the time before the production fluid temperature drops below the hydrate formation temperature or WAT and thus, ensure safe and profitable operation. The transient investigation can be extended to cover more scenarios such as flow line warm-up with or without heat from a heating pipe
In addition, the available studies on actively heated tube bundles assumed single-phase flow, which is not the case for most industrial applications. Therefore, it is recommended to evaluate the heat transfer for multiphase flow in such configurations. The authors also propose the use of different heating mediums for future studies such as glycol solution as it provides a wider range of operation compared to pure water. Considering all of the above, investigations in this field appear to have a promising way to go.
Nomenclature
| a | = | constant, in equation (1) (-) |
| A | = | Area (m2) |
| Cp | = | specific heat (J/kg·K) |
| D | = | diameter (m) |
| h | = | heat transfer coefficient (W/m2·K) |
| k | = | thermal conductivity (W/m·K) |
| τ | = | shear stress (Pa) |
| ε | = | dissipation rate (J/kg·s) |
| ω | = | specific turbulence dissipation rate (1/kg·s) |
| Nu | = | Nusselt number (-) |
| Pr | = | Prandtl number (-) |
| Q | = | Rate of heat transfer (W) |
| Ra | = | Rayleigh number (-) |
| Ra* | = | Modified Rayleigh number (-) |
| T | = | Temperature (K) |
| U | = | Overall heat transfer coefficient (W/m2·K) |
| ρ | = | Density (kg/m3) |
Subscripts
| b | = | Bulk |
| f | = | Film |
| s | = | Surface |
Acknowledgement
The authors of the study are grateful to Crude Oil Fouling Research Centre (CROFREC) and Universiti Teknologi PETRONAS for the endless support and the Y-UTP grant 0153AA-E07 for the financial support.
Disclosure statement
No potential conflict of interest was reported by the author(s).
Correction Statement
This article has been republished with minor changes. These changes do not impact the academic content of the article.
References
- Adelaja, A. O., Dirker, J., & Meyer, J. P. (2014). Effects of the thick walled pipes with convective boundaries on laminar flow heat transfer. Applied Energy, 130, 838–845. https://doi.org/https://doi.org/10.1016/j.apenergy.2014.01.072
- Ahmadi, M. H., Sadeghzadeh, M., Maddah, H., Solouk, A., Kumar, R., & Chau, K. (2019). Precise smart model for estimating dynamic viscosity of SiO2/ethylene glycol–water nanofluid. Engineering Applications of Computational Fluid Mechanics, 13(1), 1095–1105. https://doi.org/https://doi.org/10.1080/19942060.2019.1668303
- Ahmadi, M. H., Sadeghzadeh, M., Raffiee, A. H., & Chau, K.-W. (2019a). Applying GMDH neural network to estimate the thermal resistance and thermal conductivity of pulsating heat pipes. Engineering Applications of Computational Fluid Mechanics, 13(1), 327–336. https://doi.org/https://doi.org/10.1080/19942060.2019.1582109
- Ahmadi, M. H., Sadeghzadeh, M., Raffiee, A. H., & Chau, K. (2019b). Applying GMDH neural network to estimate the thermal resistance and thermal conductivity of pulsating heat pipes. Engineering Applications of Computational Fluid Mechanics, 13(1), 327–336. https://doi.org/https://doi.org/10.1080/19942060.2019.1582109
- Alfarawi, S. (2020). Evaluation of hydro-thermal shell-side performance in a shell-and-tube heat exchanger: CFD approach. Journal of Advanced Research in Fluid Mechanics and Thermal Sciences, 66(1), 104–119.
- Alwan, M. S., Hadi, J. M., Jaafer, L. H., & Jalghaf, H. K. (2020). Study the effect of nano fluid on heat transfer in finned pipe with internal v-cut twisted tape. Journal of Mechanical Engineering Research and Developments, 43(5), 161–177.
- Anderson, J. D. (2009). Governing Equations of Fluid Dynamics BT - Computational Fluid Dynamics (J. F. Wendt (ed.); pp. 15–51). Springer Berlin Heidelberg. https://doi.org/https://doi.org/10.1007/978-3-540-85056-4_a2.
- Arcangeletti, G., Bacati, F., Radicioni, A., Breuskin, B., Jacquet, S., D’Amico, A., & La Sorda, E. (2019). Innovative Field Development Scheme Based on Saipem’s ETH PiP and Relevant Subsea Power Feeding System. https://doi.org/https://doi.org/10.4043/29462-MS.
- Balaji, D., & Prakash, L. S. S. (2016). CFD analysis of a pressure drop in a staggered tube bundle for a turbulent cross flow. International Advanced Research Journal in Science, Engineering and Technology, 3(2), 35–40.
- Camargo, R. M. T., Gonçalves, M. A. L., Montesanti, J. R. T., Cardoso, C. A. B. R., & Minami, K. (2004). A Perspective View of Flow Assurance in Deepwater Fields in Brazil. https://doi.org/https://doi.org/10.4043/16687-MS.
- Churchill, S. W., & Chu, H. H. S. (1975). Correlating equations for laminar and turbulent free convection from a horizontal cylinder. International Journal of Heat and Mass Transfer, 18(9), 1049–1053. https://doi.org/https://doi.org/10.1016/0017-9310(75)90222-7
- Churchill, S. W., & Churchill, R. U. (1975). A comprehensive correlating equation for heat and component transfer by free convection. AIChE Journal, 21(3), 604–606. https://doi.org/https://doi.org/10.1002/aic.690210330
- Churchill, S. W., & Thelen, H.-J. (1975). Eine allgemeine Korrelationsgleichung für den Wärme- und Stoffübergang bei freier Konvektion. Chemie Ingenieur Technik, 47(10), 453. https://doi.org/https://doi.org/10.1002/cite.330471013
- Cornelissen, J. T., Taghipour, F., Escudié, R., Ellis, N., & Grace, J. R. (2007). CFD modelling of a liquid–solid fluidized bed. Chemical Engineering Science, 62(22), 6334–6348. https://doi.org/https://doi.org/10.1016/j.ces.2007.07.014
- Czarnota, T., & Wagner, C. (2016). Turbulent convection and thermal radiation in a cuboidal Rayleigh–Bénard cell with conductive plates. International Journal of Heat and Fluid Flow, 57, 150–172. https://doi.org/https://doi.org/10.1016/j.ijheatfluidflow.2015.10.006
- Gulawani, S. S., Joshi, J. B., Shah, M. S., RamaPrasad, C. S., & Shukla, D. S. (2006). CFD analysis of flow pattern and heat transfer in direct contact steam condensation. Chemical Engineering Science, 61(16), 5204–5220. https://doi.org/https://doi.org/10.1016/j.ces.2006.03.032
- Jaworski, Z., & Nienow, A. W. (2003). CFD modelling of continuous precipitation of barium sulphate in a stirred tank. Chemical Engineering Journal, 91(2), 167–174. https://doi.org/https://doi.org/10.1016/S1385-8947(02)00150-X
- Kakaç, S., Liu, H., & Pramuanjaroenkij, A. (2002). Heat exchangers: Selection, rating, and thermal design. CRC Press.
- Kenny, S. (2018). Chapter seven - offshore pipelines—elements of managing risk. In F. Khan & R. B. T.-M. in C. P. S. Abbassi (Eds.), Offshore process safety (Vol. 2, pp. 289–325). Elsevier. https://doi.org/https://doi.org/10.1016/bs.mcps.2018.04.005.
- Kuznetsov, G. V., & Sheremet, M. A. (2010). Numerical simulation of turbulent natural convection in a rectangular enclosure having finite thickness walls. International Journal of Heat and Mass Transfer, 53(1), 163–177. https://doi.org/https://doi.org/10.1016/j.ijheatmasstransfer.2009.09.043
- Liu, L., Choudhury, T. H., Hu, B., Duggan, N. K., Richardson, S. M., & Hewitt, G. F. (2006). Experimental studies of heat transfer in a tube bundle model. Proceedings of the Institution of Mechanical Engineers, Part E: Journal of Process Mechanical Engineering, 220(3), 151–159. https://doi.org/https://doi.org/10.1243/09544089JPME82
- Mansourpoor, M., Azin, R., Osfouri, S., & Izadpanah, A. A. (2019). Experimental investigation of wax deposition from waxy oil mixtures. Applied Petrochemical Research, 9(2), 77–90. https://doi.org/https://doi.org/10.1007/s13203-019-0228-y
- Markatos, N. C., & Pericleous, K. A. (1984). Laminar and turbulent natural convection in an enclosed cavity. International Journal of Heat and Mass Transfer, 27(5), 755–772. https://doi.org/https://doi.org/10.1016/0017-9310(84)90145-5
- Mohanan, A. K., Prasad, B. V. S. S. S., & Vengadesan, S. (2020). Flow and heat transfer characteristics of a cross-flow heat exchanger with elliptical tubes. Heat Transfer Engineering, 1–15. https://doi.org/https://doi.org/10.1080/01457632.2020.1826742
- Nemati, H., Rahimzadeh, A. R., & Wang, C. (2020). Heat transfer simulation of annular elliptical fin-and-tube heat exchanger by transition SST model. Journal of Central South University, 27(8), 2324–2337. https://doi.org/https://doi.org/10.1007/s11771-020-4452-5
- Oliveira, F., Hamacher, S., & Almeida, M. (2011). Process industry scheduling optimization using genetic algorithm and mathematical programming. Journal of Intelligent Manufacturing, 22(5), 801–813. https://doi.org/https://doi.org/10.1007/s10845-009-0339-x
- Ramezanizadeh, M., Alhuyi Nazari, M., Ahmadi, M. H., & Chau, K. (2019). Experimental and numerical analysis of a nanofluidic thermosyphon heat exchanger. Engineering Applications of Computational Fluid Mechanics, 13(1), 40–47. https://doi.org/https://doi.org/10.1080/19942060.2018.1518272
- Sadeghzadeh, M., Maddah, H., Ahmadi, M. H., Khadang, A., Ghazvini, M., Mosavi, A., & Nabipour, N. (2020). Prediction of thermo-physical properties of TiO2-Al2O3/water nanoparticles by using artificial neural network. Nanomaterials, 10(4), 697. https://doi.org/https://doi.org/10.3390/nano10040697
- Vandrangi, S. K., Emani, S., Hassan, S., & Sharma, K. V. (2020). Fluid dynamic simulations of EG-W (ethylene glycol–water) mixtures to predict nanofluid heat transfer coefficients. Environmental Technology & Innovation, 20, 101113. https://doi.org/https://doi.org/10.1016/j.eti.2020.101113
- Zhang, D. Z., & Anosike, A. I. (2010). Modelling and Simulation of Dynamically Integrated Manufacturing Systems BT - Proceedings of the 6th CIRP-Sponsored International Conference on Digital Enterprise Technology (G. Q. Huang, K. L. Mak, & P. G. Maropoulos (eds.); pp. 865–876). Springer Berlin Heidelberg.
- Zhang, S.-X., He, Y.-L., Lauriat, G., & Tao, W.-Q. (2010). Numerical studies of simultaneously developing laminar flow and heat transfer in microtubes with thick wall and constant outside wall temperature. International Journal of Heat and Mass Transfer, 53(19), 3977–3989. https://doi.org/https://doi.org/10.1016/j.ijheatmasstransfer.2010.05.017
- Zschaeck, G., Frank, T., & Burns, A. D. (2014). CFD modelling and validation of wall condensation in the presence of non-condensable gases. Nuclear Engineering and Design, 279, 137–146. https://doi.org/https://doi.org/10.1016/j.nucengdes.2014.03.007