
 ?Mathematical formulae have been encoded as MathML and are displayed in this HTML version using MathJax in order to improve their display. Uncheck the box to turn MathJax off. This feature requires Javascript. Click on a formula to zoom.
Abstract
In this study, we simulate the acceleration-induced cavity bubble expansion and its non-spherical collapse in a drastically varying pressure field caused by mechanical impact, and we qualitatively compare the results with those for similar ζ number (Obreschkow et al., Citation2011) as recorded by a high-speed camera (Taylor, Citation2012). The gas–liquid interface is tracked by using the volume of fluid method. The nonlinear compressibility effect of the liquid phase is considered by applying the Tait equation. The simulation of the impact load is accomplished by converting the acceleration curve obtained from the experiment (Kang & Raphael, Citation2018) into the velocity curve of the bottom boundary movement through integration and subsequent using of dynamic mesh model. Numerical results show that cavitation bubble nucleuse expand rapidly in the drastically decreasing pressure field caused by the impact and a pressure wave is emitted and propagates in the liquid during the subsequent collapse of the bubble. When the pressure wave is reflected on the wall, it causes a high peak pressure at the wall surface, which may underlie the rupture of the bottle wall in the experiment (Daily & Pendlebury, Citation2014).
1. Introduction
Striking the top of a bottle filled with water can cause the water at the bottom of the bottle to experience cavitation, which can subsequently cause the bottle wall to crack (Daily & Pendlebury, Citation2014). This cavitation induced by acceleration is different from that induced by the fluid momentum, which is governed by the conventional cavitation number. Therefore, Pan et al. proposed a new cavitation number, , and experimentally verified that it can be applied as a general criterion for the onset of acceleration-induced cavitation (Fatjo, Citation2016; Pan et al., Citation2017). As well, many scholars have studied the dynamics of bubble impacted by a shock wave, and these works have demonstrated the jetting mechanism of the bubble if exposed to a shock wave (Hawker & Ventikos, Citation2012; Ohl and Ikink, Citation2003; Ohl & Ohl, Citation2013; Seung & Kwak, Citation2017). Although the criteria for the onset of cavitation under impact have been clearly established and the dynamics of bubble impacted by a shock wave have been described, the dynamic of the gas–liquid interaction in a bottle under mechanical impact is still largely unknown. Accurately describing and predicting the spatio-temporal dynamics of bubbles under shock-loading conditions are essential for many application scenarios such as pipeline flow and biological tissue damage from blast or impact exposures (Hong et al., Citation2016; Kang & Raphael, Citation2018; Rosenfeld et al., Citation2013). Therefore, it is particularly important to understand the dynamic mechanism underlying gas–liquid interactions in a bottle under an impact load.
In numerical research, many methods such as the boundary element method, level-set method, Eulerian finite element method and volume of fluid (VOF) method have been used to describe the dynamic behavior of the bubble (Akhatov et al., Citation2001; Lauer et al., Citation2012; Liu et al., Citation2018; Liu et al., Citation2020; Luo, Citation2008; Méndez & González-Cinca, Citation2011; Peng et al., Citation2019; Tang et al., Citation2020). Among these, the VOF method was used by Koukouvinis to study the aspheric collapse of bubble subject to gravity (Koukouvinis et al., Citation2016a, Citation2016b). Another notable example is the work of Osterman et al., which used the VOF method to simulate the near-wall bubble collapse in an ultrasonic field(Osterman et al., Citation2009). In this study, taking into account the characteristics of acceleration-induced cavitation, we used the VOF and dynamic mesh method to study the expansion and collapse behavior of acceleration-induced cavitation under mechanical impact. We also examine the subsequent formation and propagation of pressure waves.
In a previous experimental study, a non-dimensional scaling law was proposed by a team from École polytechnique fédérale de Lausanne (EPFL) for characterizing the formation of jets from bubble collapse, in which a dimensionless number was used to characterize the collapse asymmetry (Obreschkow et al., Citation2011):
(1)
(1) Here,
denotes the pressure gradient due to acceleration;
is the maximum bubble radius;
is the pressure at the same horizontal position within the bubble; and
is the vapor pressure. When
, the jet pierces the bubble. In this case, the maximum instantaneous acceleration is 500 g (
), corresponding to a instantaneous ζ value of about 0.05. According to this rule, we can predict that significant non-spherical collapse and jetting will occur in this example (Obreschkow et al., Citation2013).
2. Numerical model
The commercial flow solver Fluent17.1 is used for the numerical simulation, wherein the VOF method is applied to accurately track the gas–liquid interface. Surface tension effects are considered and the surface tension coefficient is set to , although its influence during jet formation is negligible as the Weber number in this process is ∼ 3000. The mass transfer between the two phases is ignored. The equation solved, based on the Navier-Stokes equation in compressible viscous form, are as follows:
Continuity equation:
(2)
(2) where
is the density of the fluid and
is the velocity vector of the flow field.
Momentum equation:
(3)
(3) where
is the pressure,
is the gravity vector,
are body forces, and
is the viscous stress tensor, defined as follows:
(4)
(4) where
is the dynamic viscosity of the fluid,
is the identity matrix affected by bulk expansion, and
is the bulk viscosity of the fluid, usually set to
. The Reynolds number of the flow varies from less than 1000 during the bubble expansion to nearly 40,000 in a short time period of bubble collapse. The flow regime was in a transitional state of laminar to mildly turbulent flow, with laminar flow for most of the time. And the mesh used in the simulation is dense enough to be considered as a direct numerical simulation (DNS) of the flow process, so no turbulence model is used.
Energy conservation equation:
(5)
(5) where
denotes the total energy per unit mass and the first three terms to the right of the equation represent the energy transfer due to conduction, species diffusion and viscous dissipation, respectively. The last term represents the volumetric heat source and according to the two-phase model chosen for this study, it's zero.
Volume fraction equation:
(6)
(6) where
is the volume fraction of the fluid and the subscript
indicates the primary or secondary phase. The interface between the two phases can be determined by solving the equation for the second phase.
Both phases are considered compressible, where the ideal gas model is used for the gas and the following Tait equation is used for the liquid:
(7)
(7) where
is the density of water, equal to
,
is the speed of sound, equal to
, at the reference state
and the exponent
is set to 7.15. The Tait equation accounts for a nonlinear compressible effect, which is a prerequisite for tracking pressure waves.
The finite volume method was used to solve the Naver-Stokes equations for the transient state on a 2D grid, with the SIMPLE algorithm for pressure-velocity coupling and the implicit scheme for time discretization. A second-order upwind scheme was used for the discretization of density and momentum. The convergence criteria were for the continuity and momentum equations, and
for the energy equation. Time stepping was done with an adaptive method, controlling the Courant number to be less than 0.2, with a variable time step of
to
. Hawker and Ventikos examined the three-dimensional effect in detail in their study of the interaction of a strong shock wave with a gas bubble in a liquid medium (Hawker & Ventikos, Citation2012). The results show that, apart from small-scale details in the collapse phase, there is a lack of significant three-dimensional structure during the bubble evolution, and in addition the collapse period, maximum jet velocity and maximum pressure differ by about 15-25% between the two computation. Since 2D simulation significantly reduces the computational cost as compared to the full 3D simulation, the 2D computational model was chosen here.
In addition to the solution of the Navier-Stokes equations, a widely used tool for predicting bubble expansion and collapse in a varied pressure field is the Keller-Miksis equation, which takes the following form:
(8)
(8) Where
is the bubble radius,
means the velocity of the bubble wall,
is the speed of sound in the liquid,
and
are the pressure and density of the ambient liquid respectively,
represents the liquid pressure at the bubble wall. The gas inside the bubble obeys the van der Waals law, then
is given as follows:
(9)
(9) where
is the vapor pressure and ignored in this study,
is the radius of the bubble at equilibrium state,
and
are the viscosity and surface tension of the liquid.
is the polytropic exponent and
is the van der Waals parameter.
3. Validation of the methodology
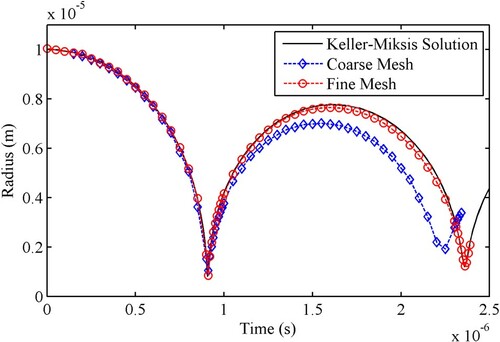
A canonical case of an isolated spherical bubble collapsing in the free-field has been used for the validation of the methodology, as shown in Figure . The initial radius of the bubble is , the internal pressure is
and the ambient pressure is
. The radius of the spherical calculation domain is 1000
, 100 times the initial radius of the bubble, to minimize the influence of the boundary on the evolution of the bubble. Comparison of the Keller-Miksis equation with the numerical results is shown in the Figure . The results of fine mesh were in good agreement with the analytical solution, indicating that the adopted numerical model could be used to simulate the dynamic process of a single bubble. In addition, the mesh adopted in the following case study kept the same level as the fine mesh used in the validation to ensure the accuracy of the result.
Figure 1. Computational domain for the validation.
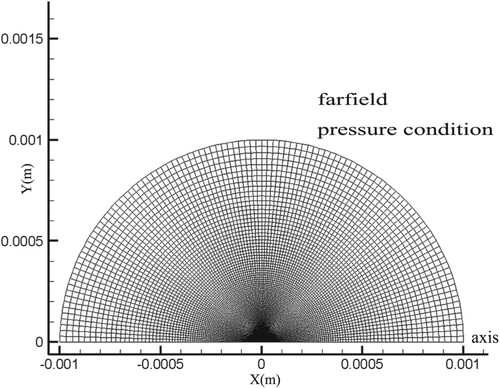
Figure 2. Comparison of the results of Keller-Miksis equation with numerical calculations.
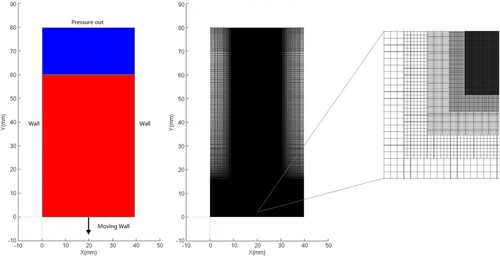
4. Computational mesh and boundary condition
As shown in Figure , the computational region is 80 mm long and 40 mm wide. The mapped-type structured mesh and the regional mesh adaption technique are used to track the bubble interface, particularly at the moment of collapse. The total number of grids is about 680,000. Particularly in the bubble-collapse region, the minimum grid size is reduced from to
by means of the regional mesh adaption technique.
Figure 3. The 2d computational domain and the mapped-type structured mesh with refinement in the bubble-collapse region.
The accurate tracking and 'capture' of impact information is the key to the successful simulation of impact loads. In this regard, Kang et al. designed and used a drop-tower-based integrated system, which can suitably capture acceleration with time under mechanical impact (Kang et al., Citation2017b). In this study, we apply and integrate the curve fitting of the acceleration data obtained from the experiment to obtain the velocity change curve of the bottle under impact. This procedure makes it possible to use the dynamic mesh model to simulate impact loads in numerical simulations. This use of moving boundaries to obtain changing pressure fields is also common in bubble simulations under the influence of acoustic fields (Osterman et al., Citation2009; Boyd & Becker, Citation2019).
To facilitate the curve integral operation, we selected a set of sinusoidal functions to fit the curve of acceleration, which can be expressed as follows:
(10)
(10) In the dynamic mesh model set-up, the numerical simulation of the dramatic pressure field caused by the impact was achieved by controlling the velocity of motion over the entire area, and the velocity function can be obtained by integrating the above formula. It can be expressed as follows:
(11)
(11)
Here, ,
,
,
are listed in Table . And the curves of acceleration and velocity are shown in Figure .
Figure 4. Left: Acceleration fitting curve after the bottle is impacted. Right: Velocity curve obtained by integrating acceleration.
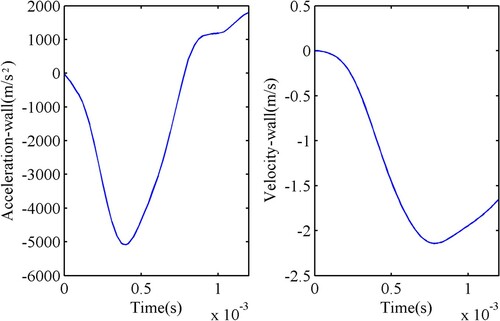
Table 1. Coefficients of the fitting curve function.
In one calculation example, the computational region corresponds to only water at the beginning, and the dynamic boundary conditions are used to obtain the pressure field, which is used as a comparative calculation example when no cavitation occurs. In another example, with the application of the moving boundary condition, when the pressure at the pre-set cavitation point (
,
) is less than the vapor pressure (
at temperature
), a vapor bubble nucleus with a radius of
is introduced. The case of a bubble nucleus height of
was chosen as the typical case to be presented with details in this paper, since the maximum pressure drop occurs at the bottom of the bottle when the impact load is applied and the scenario when the bubble expands to its maximum was evaluated to make sure that it does not come into contact with the bottom.
5. Result analysis
When compared with the pressure field without cavitation, the presence of a cavitation bubble significantly reduces the amplitude of the pressure drop and delays the time for the pressure to return to the initial state, as can be seen from Figure . In the case of impact loading, the presence of a small cavitation nucleus () will significantly alter the pressure changes across the entire flow field and play an important role in buffering the pressure drop.
Figure 5. Comparison of the pressure at position (0.01, 0.003 m) for different cases with and without cavitation onset.
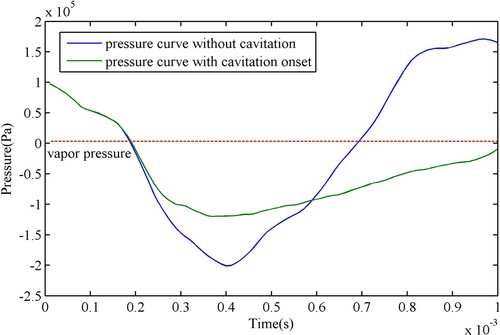
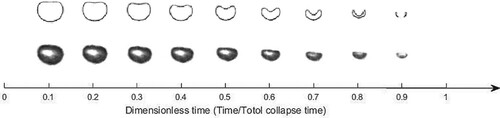
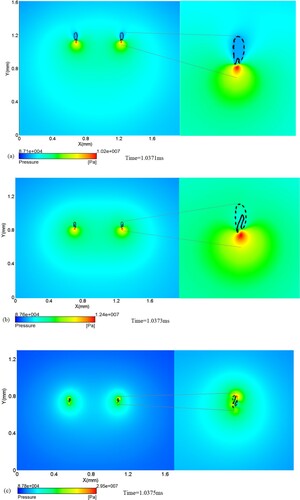
The delay effect of the pressure recovery increases the time required for bubble collapse, which is consistent with the observation that a single bubble is affected by the surrounding bubble cloud and the collapse time is greatly delayed (Taylor, Citation2012; Daily & Pendlebury, Citation2014). This situation also affects the comparison and verification of simulation results with the experiments. Because the ambient pressure field of the bubble observed in the experiment is affected by the bubble clouds, resulting in a deviation in the evolution time between the simulation and the experiment. Therefore, here, we only qualitatively compare the evolution mode of the bubble. That is, the comparison of bubble shapes during the bubble collapse phase with a dimentionless time, which is obtained by dividing the evolution time by the total collapse time, as shown in Figure . In a high-speed video recording of the bubble collapse (Taylor, Citation2012), we selected a relatively independent bubble at a certain distance from the bubble-cloud area at the bottom of the bottle, and the bubble contour obtained by computational fluid dynamics (CFD) simulation was compared with the image captured in the experiment. The results showed that the simulation and experiment exhibit a high degree of consistency as regards the topological changes of the shape, which proves the reliability of the numerical calculation.
Figure 6. Shape comparison of simulation results with experimental images during the bubble collapse phase. The total bubble collapse times in the experiment and simulation are 0.5, 0.1 ms respectively.
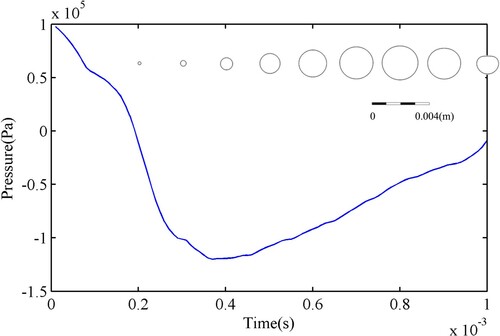
When the bottle is impacted and suddenly accelerates, the water in the bottle is 'stretched' due to inertia, resulting in a drastic pressure drop. When the bottom pressure of the bottle is less than the vapor pressure, vapor-bubble nucleuses appear (Schnerr & Sauer, Citation2001; Fatjo, Citation2016; Kang et al., Citation2017a). As the acceleration of the liquid further increases, the pressure continues to decrease, and the pressure difference between the bubble and the surrounding liquid becomes the main driving force underlying bubble growth and collapse. In the initial stage of bubble expansion, the bubble remains spherical. In the late expansion stage, the shape of the bubble deviates from the spherical shape, and the bubble is slightly flattened in the lateral direction owing to the pressure difference as shown in Figure . Finally, the expansion of the bubble causes a significant drop in pressure within the bubble. Simultaneously, the ambient pressure continues to rise, which eventually slows down the bubble expansion process and causes its subsequent collapse.
Figure 7. Contour evolution diagram of the bubble driven by the changing ambient pressure at position (0.01 m,0.003 m).
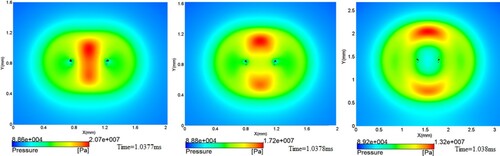
When the bubble radius reaches the maximum value, it begins to collapse. In the initial stage of collapse, along the direction of acceleration, there are minor differences in the rate of collapse between the upper and lower bubble walls. In addition to the non-uniform distribution of pressure around the bubbles caused by the rigid wall, the ultra-high acceleration caused by the impact also results in a gradient distribution of the pressure field. And due to the higher pressure acting on the top of the bubble, the collapse velocity of the upper wall is greater than that of the lower wall, and thus, a recessed area is formed here. As the bubble collapses further, this deviation will cause a phenomenon of momentum focusing and form a positive feedback mechanism, resulting in even greater velocity at the top of the bubble (Koukouvinis et al., Citation2016a). Eventually, the bubble approaches its minimum radius, and a jet in the opposite direction to the pressure gradient forms at the top of the bubble.
In Figure , a jet flow develops gradually from a small concave at the top of the bubble and penetrates the bubble from the inside. As the jet impacts the opposite bubble wall, a high-pressure zone is generated, and there is a ring-shaped high-pressure expansion wave above and below the zone, where the first pressure wave, i.e. a water hammer shock, is formed.
Figure 8. Scenario of water hammer shock formed by jet impinging the wall. The black line indicates the interface between gas and liquid (a) Jet flow inside of the bubble, (b) The high-pressure zone generated by the jet piercing the bubble wall, (c) Pressure and velocity field after the jet penetration of the bubble wall.
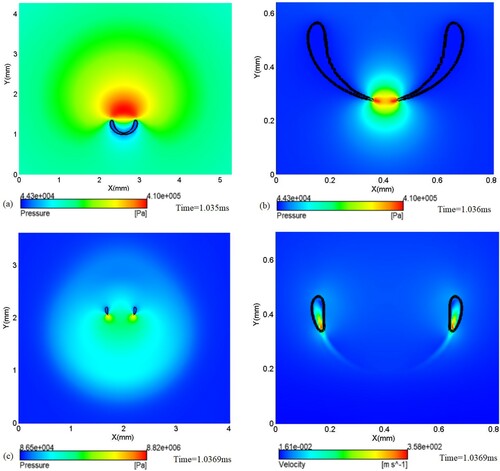
During impact, the blunt rounded front of the jet contacts the lower bubble wall creating a very sharp lower rim of the bubble. As the jet continues to impact the lower wall, the gas trapped at the lower rim of the bubble is further squeezed to the sides of the remaining bubble. The 'expelled-gas shock' appears inside the lower side of the bubble (the red section within the contour line in Figure (c)). A similar phenomenon also occurs in the laser-induced bubble collapse stage near a rigid wall (Lechner et al., Citation2017). At this time, the jet radius is , larger than the initial bubble radius, and the velocity is
. With the widening of the liquid jet and the propagating of the high-pressure expansion wave, the impact process of the jet comes to an end and transforms into the collapse phase of the torus bubble (3D view), which is accompanied by the formation of secondary jets and the emission of pressure waves.
In Figure , at the lower rim of the torus bubble, a small, point-like high pressure zone drives a tiny annular jet from its lower edge into the bubble. Subsequently, this nanojet enters the bubble at an oblique upward angle from the central axis. When compared with the main jet, in addition to being significantly smaller in size, the nanojet has another different feature, that is, the main jet is an axial jet, while it is an annular jet. This annular jet soon strikes the outer wall of the torus bubble, and another pressure wave is emitted. The laser-induced bubble collapse near a rigid wall also exhibits similar features (Lechner et al., Citation2017). The collapse of the torus bubble progresses from the lower rim upwards and is accompanied by the overall contraction of the bubble.
Figure 9. Collapse stages of the torus bubbles at different times (a) A nanojet is driven by a small, point-like high pressure zone, (b) A nanojet enters into the bubble, (c) Emission of the secondary pressure wave.
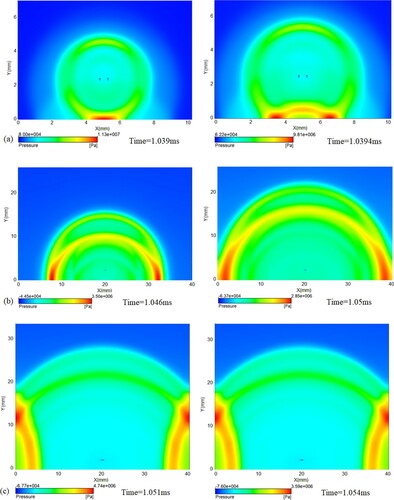
When the torus bubble finally collapses, a ring of high pressure is accompanied. When the pressure wave propagates to the axis of symmetry, the local pressure reaches a peak due to the superposition of the oppositely propagating impact wave. Subsequently, the pressure along the axial direction remains high value, propagating upward to the free surface and downward to the bottom wall, as shown in Figure .
Figure 10. Superposition of the pressure wave.
In Figure , the downward propagating pressure wave is reflected on the flat surface of the lower wall and propagates in the opposite direction while geometrically maintains the same shape as before, that is, a pressure wave that spreads around in a folded-spherical way. Subsequently, it strikes the side wall surface and is reflected again.
Figure 11. Propagation and reflection of the pressure wave inside the bottle (a) Reflection of the pressure wave at the lower wall, (b) Propagation of pressure wave in the liquid, (c) Reflection of the pressure wave at the side wall.
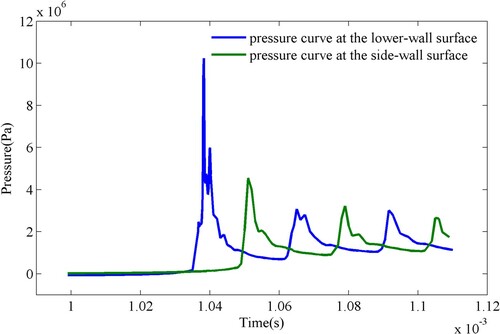
We focus on the pressure at the bottom wall, especially the pressure change at the point of crossover with the axis of symmetry, where the pressure is the highest because it is located at the 'apex' of the torus bubble. In Figure , the first peak of the blue line is the result of the collapse of the torus bubble and the pressure wave propagating to the lower wall. At this time, the pressure peak exceeds 100 bars. The second peak of the blue line is the result of the pressure wave passing the midpoint of the bottom surface after being reflected off the side-wall surface, and it is lower in magnitude than the first peak. The first peak of the green line is the result of the first pressure wave propagating to the side wall, with a peak pressure of 46 bars, which is less than the value of the peak at the midpoint of the bottom wall. Subsequently, the pressure wave reflects back and forth off the left and right walls, and the peak value is gradually attenuated.
Figure 12. Pressure curve at the lower-wall and side-wall surfaces.
6. Discussion and conclusion
In the case considered here, when the bottle is subjected to a mechanical impact, the maximum acceleration reaches , corresponding to an instantaneous
value of about 0.05, which provides a rare study case of bubble collapse in an extremely highly accelerated field. Based on the numerical results, we quantitatively describe the dynamic response of a cavitation bubble in a drastically changing pressure field when subjected to an impact load, and we analyze the formation and propagation of the two pressure waves resulting from the bubble collapse.
We compared the different cases with and without cavitation, and our results show that the presence of cavitation significantly alters the pressure changes across the entire flow field, reduces the amplitude of the pressure drop, delays the time for the pressure to return to the initial state, and overall plays a significant role in buffering the pressure change. This is because the impact load transforms the liquid in the bottle from a pure liquid state to a gas–liquid mixed state. When compared with pure liquid, this mixed gas–liquid state plays a role in buffering the rigidity of the liquid and increasing the overall elasticity (stretchability) of the fluid.
Simultaneously, the delay effect of pressure recovery also significantly prolongs the time of the bubble collapse stage, which leads to a deviation between simulation and experiment. Because the observed bubble lies near a bubble cloud, its ambient pressure is affected by the bubble cloud, and thus, there are deviations in the evolution time between simulation and experiment, and only a qualitative comparison can be performed in terms of the evolution mode of the bubble.
From the perspective of energy, along with the expansion stage of the bubble, the mechanical energy of the impact is transformed into the potential energy of the bubble. When the bubble collapses, most of the bubble energy radiates outwards in the form of pressure waves and is finally transferred to the nearby wall surface. This mechanism may underlie the rupture of the bottle wall in the experiment.
Acknowledgements
The authors would like to acknowledge the financial grants from the National Project of China (No. 6140206040301).
Disclosure statement
No potential conflict of interest was reported by the author(s).
Additional information
Funding
References
- Akhatov, I., Lindau, O., Topolnikov, A., Mettin, R., Vakhitova, N., & Lauterborn, W. (2001). Collapse and rebound of a laser-inducedcavitation bubble. Physics of Fluids, 13(10), 2805. https://doi.org/https://doi.org/10.1063/1.1401810
- Boyd, B., & Becker, S. (2019). Numerical modeling of the acoustically driven growth and collapse of a cavitation bubblenear a wall. Physics of Fluids, 31(3), 032102. https://doi.org/https://doi.org/10.1063/1.5084729
- Daily, J., & Pendlebury, J. (2014). Catastrophic cracking courtesy of quiescent cavitation. Physics of Fluids, 26(9), 091107. https://doi.org/https://doi.org/10.1063/1.4894073
- Fatjo, G. G. (2016). New dimensionless number to predict cavitation in accelerated fluid. International Journal of Computational Methods and Experimental Measurements, 4(4), 484–492. https://doi.org/https://doi.org/10.2495/CMEM-V4-N4-484-492
- Hawker, N. A., & Ventikos, Y. (2012). Interaction of a strong shockwave with a gas bubble in a liquid medium: A numerical study. Journal of Fluid Mechanics, 701, 59–97. https://doi.org/https://doi.org/10.1017/jfm.2012.132
- Hong, Y., Sarntinoranont, M., Subhash, G., Canchi, S., & King, M. A. (2016). Localized tissue surrogate deformation due to controlled single bubble cavitation. Experimental Mechanics, 56(1), 97–109. https://doi.org/https://doi.org/10.1007/s11340-015-0024-2
- Kang, W., Ashfaq, A., O'Shaughnessy, T., & Bagchi, A. (2017a). Cavitation nucleation in gelatin: Experiment and mechanism. Acta Biomaterialia, https://doi.org/https://doi.org/10.1016/j.actbio.2017.11.030
- Kang, W., Chen, Y., Bagchi, A., & O'Shaughnessy, T. J. (2017b). Characterization and detection of acceleration-induced cavitation in soft materials using a drop-tower-based integrated system. Review of Scientific Instruments, 88(12), 125113. https://doi.org/https://doi.org/10.1063/1.5000512
- Kang, W., & Raphael, M. (2018). Acceleration-induced pressure gradients and cavitation in soft biomaterials. Scientific Reports, 8(1), 15840. https://doi.org/https://doi.org/10.1038/s41598-018-34085-4
- Koukouvinis, P., Gavaises, M., Supponen, O., & Farhat, M. (2016a). Numerical simulation of a collapsing bubble subject to gravity. Physics of Fluids, 28(3), 032110. https://doi.org/https://doi.org/10.1063/1.4944561
- Koukouvinis, P., Gavaises, M., Supponen, O., & Farhat, M. (2016b). Simulation of bubble expansion and collapse in the vicinity of a free surface. Physics of Fluids, 28(5), 052103.
- Lauer, E., Hu, X. Y., Hickel, S., & Adams, N. A. (2012). Numerical modelling and investigation of symmetric and asymmetric cavitation bubble dynamics. Computers & Fluids, 69, 1–19. https://doi.org/https://doi.org/10.1016/j.compfluid.2012.07.020
- Lechner, C., Koch, M., Lauterborn, W., & Mettin, R. (2017). Pressure and tension waves from bubble collapse near a solid boundary: A numerical approach. The Journal of the Acoustical Society of America, 142(6), 3649. https://doi.org/https://doi.org/10.1121/1.5017619
- Liu, N. N., Zhang, A. M., Liu, Y. L., & Li, T. (2020). Numerical analysis of the interaction of two underwater explosion bubbles using the compressible Eulerian finite-element method. Physics of Fluids, 32(4), 046107. https://doi.org/https://doi.org/10.1063/1.5143095
- Liu, Y. L., Zhang, A. M., Tian, Z. L., & Wang, S. P. (2018). Investigation of free-field underwater explosion with Eulerian finite element method. Ocean Engineering, 166(2018), 182–190. https://doi.org/https://doi.org/10.1016/j.oceaneng.2018.08.001
- Luo, J., Li, J., & Dong, G. N. (2008). Two-Dimensional simulation of the collapse of vapor bubbles near a wall. Journal of Fluids Engineering, 130(9), 091301. https://doi.org/https://doi.org/10.1115/1.2953233
- Méndez, N., & González-Cinca, R. (2011). Numerical study of bubble dynamics with the boundary element method. Journal of Physics: Conference Series, 327, 012028. https://doi.org/https://doi.org/10.1088/1742-6596/327/1/012028
- Obreschkow, D., Tinguely, M., Dorsaz, N., Bosset, A., & Farhat, M. (2011). A universal scaling law for jets of collapsing bubbles. Physical Review Letters, 107(20), 20. https://doi.org/https://doi.org/10.1103/PhysRevLett.107.204501
- Obreschkow, D., Tinguely, M., Dorsaz, N., Kobel, P., Bosset, A., & Farhat, M. (2013). The quest for the most spherical bubble. Experiments in Fluids, 54(4), 4. https://doi.org/https://doi.org/10.1007/s00348-013-1503-9
- Ohl, C. D., & Ikink, R. (2003). Shock-wave-induced jetting of micron-size bubbles. Physical Review Letters, 90(21), 214502. https://doi.org/https://doi.org/10.1103/PhysRevLett.90.214502
- Ohl, C. D. & Ohl, S. W. (2013). Shock wave interaction with single bubbles and bubble clouds. Bubble Dynamics & Shock Waves, 8, 3–31. https://doi.org/https://doi.org/10.1007/978-3-642-34297-4_1
- Osterman, A., Dular, M., & Sirok, B. (2009). Numerical simulation of a near-wall bubble collapse in an ultrasonic-field. Journal of Fluid Science and Technology, 4(1), 210–221. https://doi.org/https://doi.org/10.1299/jfst.4.210 doi:https://doi.org/10.1299/jfst.4.210
- Pan, Z., Kiyama, A., Tagawa, Y., Daily, D. J., Thomsond, S. L., Hurda, R., & Truscott, T. T. (2017). Cavitation onset caused by acceleration. Proceedings of the National Academy of Sciences, 114(32), 8470–8474. https://doi.org/https://doi.org/10.1073/pnas.1702502114
- Peng, X. X., Zhang, L. X., Wang, B. L., Xu, L. H., Song, M. T., Cao, Y. T., Liu, Y. W., & Hong, F. W. (2019). Study of tip vortex cavitation inception and vortex singing. Journal of Hydrodynamics, 31(6), 1170–1177. https://doi.org/https://doi.org/10.1007/s42241-019-0091-4
- Rosenfeld, J. V., McFarlane, A. C., Bragge, P., Armonda, R. A., Grimes, J. B., & Ling, G. S. (2013). Blast-related traumatic brain injury. Lancet Neurology, 12(9), 882–893. https://doi.org/https://doi.org/10.1016/S1474-4422(13)70161-3
- Schnerr, G. H., & Sauer, J. (2001, May 27–June 1). Physical and numerical modeling of unsteady cavitation dynamics. ICMF-2001, 4th International Conference on Multiphase Flow. https://www.researchgate.net/publication/296196752
- Seung, S., & Kwak, H. (2017). Shock wave propagation in bubbly liquids at small gas volume fractions. Journal of Mechanical Science and Technology, 31(3), 1223–1231. https://doi.org/https://doi.org/10.1007/s12206-017-0221-2
- Tang, H., Liu Y, L., Cui, P., & Zhang A. M. (2020). Numerical study on the bubble dynamics in a broken confined domain. Journal of Hydrodynamics, 32(6), 1029–1042. https://doi.org/https://doi.org/10.1007/s42241-020-0078-1
- Taylor, P. (2012). High Speed Video: Cavitation in bottle. Youtube. https://www.youtube.com/watch?v=OeunRrfvyAU.