
 ?Mathematical formulae have been encoded as MathML and are displayed in this HTML version using MathJax in order to improve their display. Uncheck the box to turn MathJax off. This feature requires Javascript. Click on a formula to zoom.
Abstract
To overcome the weak thermal conduction of the phase change materials (PCM), This investigation aims to study the effect of circular Y-shaped fins added to a two-pipe latent heat-saving unit compared with conventional circular fins. The system is placed in a straight-up orientation, and the PCM is located in the annulus, whereas hot water is moved inside the internal tube to charge the phase change material (PCM) with a phase change point of 35°C. Different independent geometric factors of the fins involving the length of the stem and angle of the tributaries to the horizontal line and the number of Y-shaped fins are analysed. The impact of the working fluid’s Reynolds number and temperature (as the input parameters) are evaluated as a sensitivity analysis to control the output (melting time and rate). The results show that increasing the height and number of the fins and reducing the angles of the tributaries results in higher performance of the system. For the optimal case, increasing the Reynolds number of the working fluid from 500 to 2000 results in 31% reductions in the melting time. Moreover, raising the working fluid’s temperature from 45° to 55° reduces the melting time by ∼44%.
Nomenclature
| = | Mushy zone constant | |
| = | PCM Specific heat (J/kg. K) | |
| = | Total energy in the end time (J/kg) | |
| = | Total energy in the initial time (J/kg) | |
| = | Gravity (m/s2) | |
| = | Sensible enthalpy (J/kg) | |
| = | Total enthalpy (J/kg) | |
| = | Thermal conductivity of PCM (W/m. K) | |
| = | Fusion Latent heat of PCM (J/kg) | |
| = | Y-shaped fin stem length (mm) | |
| = | Mass of PCM (kg) | |
| = | Pressure (Pa) | |
| = | Time (s) | |
| = | Y-shaped fin stem thickness (mm) | |
| = | Melting/solidification time (s) | |
| = | Temperature (K) | |
| = | Reference temperature (K) | |
| = | Velocity vector (m/s) |
Greek symbols
| = | Angle of fin's tributaries (°) | |
| = | Thermal expansion coefficient of PCM (1/K) | |
| = | Liquid fraction | |
| = | Dynamic viscosity of PCM (kg/m. s) | |
| = | PCM density (kg/m3) | |
| = | Latent heat (J/kg) | |
| = | Pressure drops (Pa) |
Subscripts
| = | Reference | |
| = | PCM | |
| Mean | = | Mean |
| S | = | Solid |
| L | = | Liquid |
| t | = | Total |
1. Introduction
Given the global energy crisis (Coyle & Simmons, Citation2014), deterioration of environmental issues arising from burning fossil fuels (Coady et al., Citation2017; Zou et al., Citation2016), and the growing energy demands worldwide (Bilgen et al., Citation2004), the development of sustainable and resilient renewable-based energy systems can be a viable solution to escape from the current predicament (Bull, Citation2001; Karekezi et al., Citation2003). Since renewables are weather-dependent heat sources, the use and development of traditional energy systems have been limited (Dincer & Rosen, Citation2021; Ellabban et al., Citation2014). Also, low thermal efficiency and extra cost of investment in renewable energy systems have deteriorated their widespread usage (Albatayneh et al., Citation2018; Huang et al., Citation2021). To address such systems’ low thermal efficiency and intermittency, combining Thermal Energy Storage (TES) units with renewable-based energy units has been widely considered (Nithyanandam & Pitchumani, Citation2014; Wang, Fu, et al., Citation2022). Moreover, the principle of TES units is to store heat with the aid of Phase Change Material (PCM) effectively, where low-grade heat is used, and then recycle the absorbed heat when the renewable energy source vanishes (Dincer & Dost, Citation1996; Hauer, Citation2007). This strategy helps fill the power demand and supply gap and boost energy conversion efficiency (Dincer & Rosen, Citation2021). Compared to sensible and thermo-chemical energy storage mechanisms, the latent heat storage strategy stands out due to higher thermal storage density in a fairly constant temperature and low volume (Ding et al., Citation2020; Pfleger et al., Citation2015). However, PCMs typically suffer from poor thermal conductivity and low diffusion rates, posing obstacles to better thermal management in a given energy system (Mahdi, Lohrasbi, and Nsofor, Citation2019; Yan et al., Citation2021).
To improve the low heat efficiency of the PCMs, many studies have been conducted in which different techniques such as nanoparticle dispersion (Bazri et al., Citation2018; Huang et al., Citation2020), fin insertion (Mahmoud et al., Citation2021; Mat et al., Citation2013), composite PCMs (Chen et al., Citation2016; Fteiti et al., Citation2023), geometry modifications (Karar et al., Citation2021; Menni et al., Citation2021; Xiang et al., Citation2022), metal foams (Fteiti et al., Citation2023; Shafi et al., Citation2022), etc. were employed. In a study conducted by Zhao et al. (Citation2010) on the influence of metal foam on the thermal efficiency of RT-58, they concluded that the overall thermal rate is enhanced up to 10 times over the only PCM, and this amount based on the structure and material of the porous medium involved. On the use of geometry modification, Pahamli et al. (Citation2018) considered a horizontal double-tube heat exchanger whose inner tube was set to displace. In their study, RT-50 was a storage medium between the inner and outer pipe spaces. Thus, they examined the effects of the downward movement of the inside channel, Heat Transfer Fluid (HTF) temperature, and velocity on the melting rate of RT-50. This novelty in extending the thermal exchange area by scrolling the inner tube has increased the heat transfer rate and decreased the RT-50 charging period by 64%. However, the HTF velocity was reported to have a marginal impact on the RT-50 charging rate. Kibria et al. (Citation2014) performed experimental work on the PCM's geometrical parameters affecting the charging/discharging rate. They found that the tube diameter of the heat exchanger influences the thermal exchange rate to the PCM compared to the pipe thickness. The importance of tube diameter and configuration in thermal improvement in a latent heat energy storage system was also reported by various researchers (Başal & Ünal, Citation2013). In the study of Ebadi et al. (Citation2018) on the charging process of a bio-PCM or nano-PCM inserted in a double-pipe heat exchanger, copper nanoparticles were distributed within the PCM container. According to their results, a mixture of bio-PCM and copper nanoparticles with only a 1% volume fraction could enhance the system's thermal efficiency by 15%. There abound different studies (Mahdi, Lohrasbi, Ganji, et al., Citation2019; Rostami et al., Citation2021) considering nanoparticles within the latent heat storage unit reporting similar results. Though, it could be more cost-effective (Mahdavi et al., Citation2020).
Another parameter that highly affects natural convection in a latent energy storage system is fin insertion. According to the literature, fin insertion and its geometry modification are one of the most viable and efficient approaches used in latent thermal storage systems to compensate for the weak conductive heat transfer of the PCM. In this regard, several studies reported the capability of fin usage towards better thermal management goals (Najim et al., Citation2022). In the work conducted by Tiji et al. (Citation2020), fin distribution in a PCM-based passive solar chimney has led to enhancing the room’s mean temperature by 20% and approaching thermal comfort; however, it caused much more non-uniformity in air flow rate. Pakrouh et al. (Citation2015) studied to maximize the thermal rate of a PCM-based straight-fin thermal sink. Their study optimized the geometrical features of fins built on the Taguchi model. They found that the optimum state of the heat sink is achieved when the fin length and number are optimized. Also, the arrangement of fins through the PCM container is an efficient technique that uniforms free convection impacts and covers the low conductive heat transfer of the PCM. Fin insertion has been shown to have better thermal enhancement and cost-effectiveness than nanoparticle dispersion. In this regard, Nie et al. (Citation2020) considered a horizontally oriented double-tube heat exchanger. They examined the impacts of the longitude fin array and its geometrical constraints, positioned within the PCM tanker, on the consecutive charging and discharging processes. According to their findings, the straight-fin arrangement has furthered natural convection effects when the number of fins is limited. They also found that neither very short nor long fins positively impacted the phase change process, while mid-length fins were much more efficient. Similarly, Deng et al. (Citation2019) tried uncovering the optimal layout of the fins in a double-pipe thermal exchanger using the Finite Volume Method (FVM) to reduce the melting time. Their study involved the finless cases, angled fin, straight fin, and lower and upper fin arrangements. The fin dimension, width, number, and fluid temperature impacts were investigated. They observed that the effect of fin arrangement on natural convection heat transfer rate is highly intertwined with the fin number. For the cases with a fin number below 6 (N < 6), a lower fin arrangement is the most efficient approach, while when N > 6, the angled fin is the best case.
Apart from the arrangement of fins and their dimension effects, the configuration of fins significantly impacts the PCM melting rate. Y-shaped fins have been widely investigated in different studies in the literature as one of the exemplary configurations by enlarging the heat transfer region compared with the straight fins using the same volume. In this regard, Saeed et al. (Citation2022) considered a pear-shaped latent thermal storage unit with longitudinal fins of different configurations, including rectangle, Y, and T-shaped fins, and other metals such as Al, Cu, and steel were examined to reach an optimum state of PCM melting performance. Also, aluminium nanoparticles with various volume fractions were dispersed within the PCM container to accelerate the melting process. According to their achievements, Y-shaped longitudinal fins showed superior melting performance compared with all configurations, and using aluminium nanoparticles with a 6% volume fraction could improve natural convection by 14%.
Similarly, Belazreg et al. (Citation2022) employed the longitudinal Y-shaped fins within the circular heat energy storage unit equipped with a nano-enhanced PCM and compared their findings with no fin case. Accordingly, they concluded that the Y-shape fin configuration accelerating the PCM melting performance by 48% considerably outweighs the nanoparticle dispersion effect, which led to only 19% enhancement in the case of an 8% volume fraction. Liu et al. (Citation2022) resolved the issue of the nonuniform melting behaviour of the PCMs by adding nonuniform Y-shaped fins that were vertically positioned within a latent heat storage system. They observed that the lower part of the PCM container took more than 50% of the total charging period, so more Y-shaped fins were concentrated in that region, resulting in a 21% enhancement in melting time performance. In another study, they (Liu et al., Citation2020) also achieved uniform melting performance using longitudinal Y-shaped fins uniformly distributed throughout the PCM container. In their research, they managed and allocated Y-shaped fins with longer parts on the lower side of the PCM enclosure to promote heat conduction while maintaining uniform fin distribution through the PCM container. This strategy caused a lower melting time than the PCM container, whose low part fins have wider widths. This aims to demonstrate a Y-shaped fin's superior impact over width. Wang, Abed, et al. (Citation2022) observed the impact of longitudinal Y-shaped fins horizontally installed within a rectangular cavity where Lauric acid was employed as a heat storage medium. For this purpose, they tuned the geometrical parameters of the Y-shaped configuration, including the base length, branch angle, and length, and found that the well-tuned case can accelerate the melting time by 23.3%.
Although some researchers have considered Y-shaped fins in their studies, the potential of circular Y-shaped fins for performance enhancement in double-pipe heat exchangers has not been explored until now. This study focuses on examining the melting performance of PCM using a double-pipe thermal exchanger equipped with circular Y-shaped fins. In order to determine the optimal fin configuration, the geometric parameters of the Y-shaped fins are adjusted and a sensitivity analysis is conducted. The main objective was to investigate how different fin configurations impact the melting performance of the system. This research presents a novel architecture for heat storage units during the design phase by considering the combined effects of fin shape and orientation. The study investigates the most influencing parameters such as the number of fins, height, thickness, and angle of the tributaries. To ensure meaningful analysis, the volumes of the PCM and fins are maintained at similar levels across all cases. Furthermore, the effects of the Reynolds number and the temperature of the heat transfer fluid (HTF) are evaluated after selecting appropriate dimensions. The study also involves analyzing the significant performance indicators including liquid fraction, temperature counters, charging period, and energy storage values for various scenarios.
2. System description
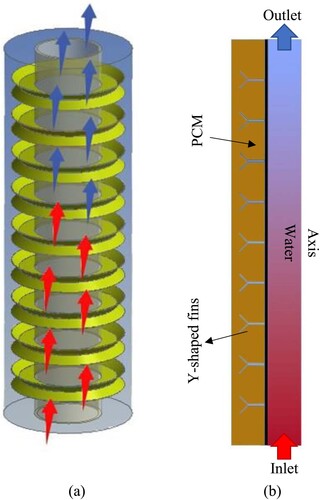
A double-pipe heat storage unit is examined in this study and equipped with Y-shaped circular fins, as illustrated in Figure A. Y-shaped fins are compared with regular circular fins and the system without fins. Due to the geometry of the system and the absence of a circumferential stream of the liquid PCM, the 2D axisymmetric model is used to simplify the 3D mode, as demonstrated in Figure B. The interior and exterior radii of the channel are 20 and 40 mm. The length of the pipe is also assumed to be 250 mm. Nine Y-fins are the maximum number that may be used, and they attach to the tube through the lower portion of the Y. Keep in mind that the (water) flows through the interior pipe in the opposite orientation of gravity. At the same time, the PCM is filled in the external tube. Both the inner and outer tubes of the HTF flow have a Reynolds number of 2000 (velocity of 0.0269 m/s). The proposed systems’ schematics show the HTF case with rectangular fins and different Y-fin sizes. The flow is thought to be axisymmetric based on the system’s configuration and the lack of circumferential flow changes. Figure B also indicates the boundary conditions and the unit's size. The dimension for the PCM area was chosen based on different studies on triplex tube latent thermal storage units published in the literature; it should be noted (Abed et al., Citation2022).
Figure 1. The representation of the proposed unit, (a) three-dimension of the domain, (b) axisymmetric two-dimension as the simulated model.
The Y-shaped fins’ geometrical characteristics, including the length and thickness of the stem and tributaries, as well as the angle of the tributaries with the horizontal axis, are evaluated. The number of fins is also assessed. The schematic of a Y-shaped fin inside the outer tube is shown in Figure . Half of the fin's stem is equal to its tributaries’ thickness. The fins’ thickness varies depending on the fins presented inside the domain. For a proper comparison between diverse scenarios, the total area of fins inside the field is also assumed to remain constant in all circumstances, considered equal to the location of the fins in the case of conventional circular fins with nine fins with dimensions of 9mm × 1 mm. Thus, the PCM's mass constant for all the studied simulations. The working fluid's Reynolds number and temperature impacts are also examined for the best-case scenario.
Figure 2. The schematic of a Y-shaped fin inside the outer tube shows the variable dimensions.
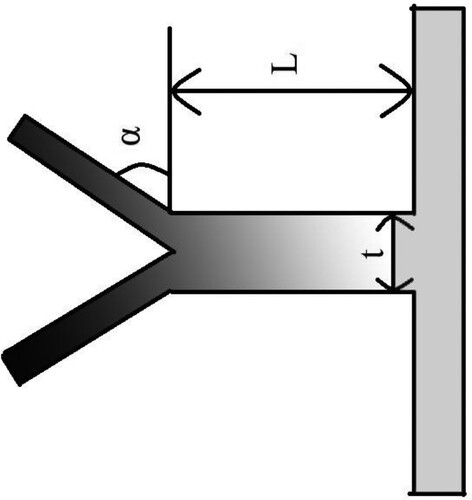
Table displays the fins’ measurements together with the name and explanation of each proposed instance. The case with conventional circular fins is called Case 0 in this paper. Different colours in Table indicate independent parameters investigated in this paper, i.e. fins’ stem, angle of tributaries with the horizontal line, and the number of fins. It should be mentioned that the case with conventional circular fins is called case 0. In case 2, where L = 5 mm and α = 45°, the total length of the fin is 10 mm, comparable with case 0 with the length of 10 mm and thickness of 2 mm.
Table 1. Fins sizes of the examined cases involving the number, length, thickness, and angle of the Y-fins head.
RT35 is a PCM utilized in the storage unit to store heat with a melting point suitable for solar energy systems and building applications. TES system is used in buildings for efficient space solar heating and warm water system applications. RT35, as the PCM, can be used directly in buildings in low-temperature heating systems such as underfloor heating systems or to preheat the water used in radiators and hot water systems. The storage unit optimized in this study is a simplified and scaled-down form of a complex unit that integrates several shell and tube heat exchangers with larger sizes. The units can be placed in parallel and in series to obtain the heating capacity required for the heating unit based on the size of the building. Figure depicts a schematic illustration of the operational configuration of a sample TES-based system designed for building applications. The system comprises three main components: a photovoltaic/thermal system (PV/T), a heat pump, and a TES unit. In this setup, the PV module serves the purpose of generating electricity to meet the power loods of the heat pump. Consequently, the heat pump fulfils the heating requirements of the building. Additionally, the TES unit can be directly charged by both the PV/T system and the heat pump. By integrating the TES unit with the heat pump, it becomes capable of supplying the necessary heat for the heating load and hot water demand of the building. This study is focused on the charging performance to improve the thermal rate from the working fluid to PCM for efficient hybrid utilization of the system in buildings. Table is a list of RT35's characteristics.
Figure 3. A schematic of system operation for building applications
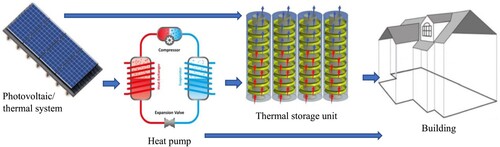
Table 2. Thermophysical characteristics of the PCM applied in this work, GmbH (Najim et al., Citation2022; Rubitherm, Citation2022).
3. Mathematical modelling
The following assumptions were used to drive the governing equations by the implementation of the enthalpy-porosity method during phase transition (Mat et al., Citation2013): (1) Boussinesq approximation for natural convection effect; (2) 2D axisymmetric model for the computational region due to the nature of the geometry; (3) Gravity in the downward direction since the heat exchanger is oriented in a vertical direction; (4) no-slip velocity on the walls; (5) Newtonian and incompressible stream for the liquid PCM. The temperature and fluid flow distribution are then determined by solving the following equations (Wang et al., Citation2015):
(1)
(1)
(2)
(2)
(3)
(3)
The last term in Equation (2) denotes the momentum sink, which is computed as (Brent et al., Citation1988):
(4)
(4) Am is the parameter of the mushy zone, which serves as a key factor for controlling velocity damping during phase transitions of PCMs. This parameter's value relies on the phase and temperature of the PCM in comparison to the phase and temperature of the HTF. Extensive studies in the literature have been conducted to identify the ideal value for this parameter (Fadl & Eames, Citation2019). The value of 105 is found to be the best fit for this parameter based on various investigations in the literature (Mahdi & Nsofor, Citation2017; Ye et al., Citation2011). The melt fraction is obtained based on the temperature of PCM as (Mat et al., Citation2013):
(5)
(5) To assess the melting phenamona, the instantaneous and mean rates of heat storage (melting) can be calculated as:
(6)
(6)
(7)
(7) where
and
is the time step size and discharge duration, respectively, and
is the whole PCM energy, which is the summation of sensible
and latent heat
.
4. Numerical study and validation
To simulate the thermofluidic behaviour and storage effectiveness of the PCM system, Ansys Fluent, a commercial computational fluid dynamics (CFD) solver, was used. Another software tool, Ansys Design Modeler, was used for grid generation. The computation domain was established on a fixed grid, incorporating initial and boundary conditions, as well as the application of governing equations. The QUICK differencing scheme was used to discretize the momentum and energy equations, while the pressure-velocity coupling was resolved using the PRESTO pressure discretization scheme. As per previous research, this approach allows for accurate and efficient modelling of the melting process, yielding valuable insights into the behaviour of PCMs in thermal energy storage systems (Dong et al., Citation2022; Mobedi et al., Citation2022).
To ensure issue independence from the grid size and time step scale, these investigations should be carried out before the main inquiry. For the current drive, for the base case with L = 5 mm, t = 2 mm, and α = 45° using eight Y-shaped fins, first, various sizes of 0.1, 0.2, and 0.4 mm are considered for the mesh, and the melting point results are compared in Table when the PCM liquid fraction reaches to 95%. The charging times for the mesh sizes of 0.1 and 0.2 mm are very similar (below 1% of the charging period was required to obtain the charging ratio of 95%). So, a 0.2 mm grid size is used. In the grid size research, note that the time step size is 0.1 s. The impacts of different time step sizes ranging from 0.05–0.4 s on the melting time are also shown in Table ; as can be examined, the outcomes for the time step sizes of 0.05 s and 0.1 s are similar, and thus the time step size of 0.1 s is considered for further investigations.
Table 3. Impact of mesh and time step sizes on the melting period.
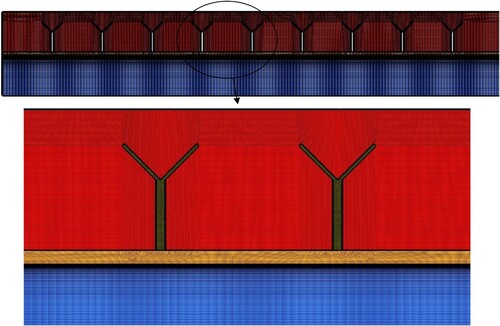
Figure shows the mesh after the mesh analysis for the selected mesh. As shown, in the HTF section, a boundary layer mesh was generated near the upper wall. Moreover, particular refinement for mesh on the interface of the two blocks was made due to the heat transfer between the two blocks of fin and PCM.
Figure 4. The shematic of the mesh generated after the mesh independence analysis
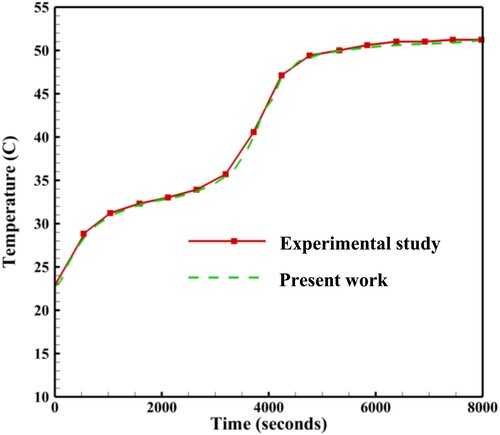
The experimental investigation of Longeon et al. (Citation2013) on the phase transition progress of RT35 in a double-pipe system were chosen to validate the present work. The heat exchanger was placed vertically when water was passed in the internal tube, and PCM was located in the annulus. Therefore, the experiment of Longeon et al. (Citation2013) and the current study are highly comparable related to the type of thermal management and PCM and HTF employed. Figure presents the mean PCM temperature for both the current work and Longeon et al. (Citation2013) during the melting. The results of the current study and the previous work are found to be in good agreement, demonstrating the accuracy and reliability of the recent research. The consistency of the findings obtained from both studies suggests that the numerical simulations employed in the current study are robust and effective. Moreover, the results obtained from the present study almost fit with the experimental outcome, indicating the validity of the code used. This high level of agreement between the numerical simulations and experimental results further enhances the confidence in the accuracy of the numerical model employed in the current research.
Figure 5. Melting time of the present work and the work of Longeon et al. (Citation2013).
5. Results and discussion
5.1. Comparison of straight and Y-shaped fins
The liquid and solid fraction contours for the system's discharge procedure of the TES are shown in Figure with different shapes of the fins (straight and Y-shape) at different time steps (up to 5400 s). Nine fins are added to each case's thermal system wall on the PCM region side, with a fixed space between each fin. The total height of the fins is considered 10 mm in this section.
Figure 6. The PCM liquid and solid fractions for cases 0 and 2 (Straight and Y-shaped fins) at different times.
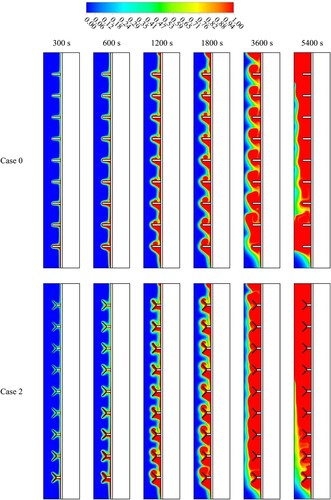
In both cases, a thin layer of the liquid PCM phase around the fins during the early melting process. The findings demonstrated that the charging process enhances by using Y-shaped fins by improving the surface area for exchanging the heat. Moreover, since the metal fins’ thermal conductivity is greater than the PCMs, the overall thermal conductivity of the storage unit enhances. Additionally, the heat from the HTF walls is delivered through the fins to the deep areas of the PCM domain. The melting process has the same behaviour in the Y-shaped Fin (45°) case, where a thin layer of liquid PCM generates around the fins more than in the case of the straight fin due to the Y-shaped fin having a wider surface area than the normal fin. Enlarging the heat exchange surface area (Y-shape) and effective thermal conductivity makes the charging process more efficient. In each case, the liquid layer progressively thickens due to absorbing more heat from the HTF. Due to the buoyancy effect, the solid phase remains in the lower levels of the domain for times up to 5400 s while the liquid accumulates at the top.
Figure shows the temperature profiles for cases 0 and 2 (straight and Y-shaped fins) and time steps (up to 5400 s). According to the findings for all the cases with fins included, the fins themselves cannot establish thermal balance with the HTF even after 5400 s because they operate as heat transfer bridges, transferring heat from the HTF to the PCM. The liquid PCM with higher temperature rises to the upper side of the domain in both straight and y-shaped fins due to thermal convection and the buoyancy effect. Because of the increased surface area for thermal in the unit with Y-shaped fins, the PCM's heat temperature is often higher than that of the straight fin.
Figure 7. The PCM temperature profiles for the cases 0 and 2 (Straight and Y-shaped fins) at different time.
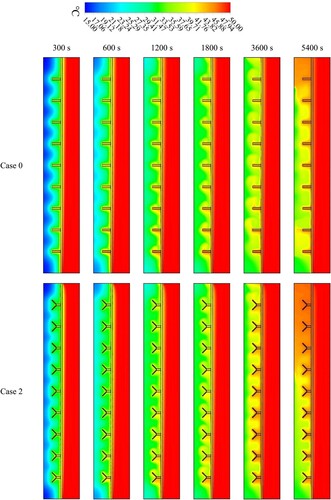
Figure represents the velocity counters for two configurations based on the fin’s shape (straight and Y-shape) at 3600 s. For the case of a straight fin, the circulation of the melted PCM between every two fins refers to the phase transition from solid to liquid, and the circulation zone decreases towards the top of the system. On the other hand, in the system with Y-shaped fins, a higher velocity can be observed. Several circulation zones inside the liquid PCM reflect higher natural convection effects in the system using Y-shaped fins compared to straight fins.
Figure 8. The PCM velocity contours for cases 0 and 2 (Straight and Y-shaped fins) at 3600 S.
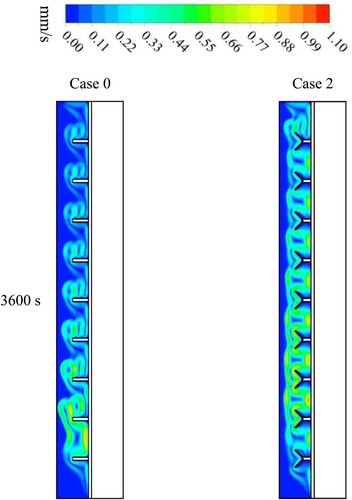
Figure demonstrates the development of the whole charging procedure for the cases of various fin shapes (straight and Y-shape) at different times. The findings reveal that both types of fins behave the same way, with the charging process increasing the PCM's liquid phase progressively as it melts at increasing time steps. Because of the increase in the average thermal conductivity and heat transfer surface area, fins often improve the systems’ thermal responses, which lead to a faster rise in the melting line.
Figure 9. Development of the liquid fraction of the PCM for cases 0 and 2 (Straight and Y-shaped fins).
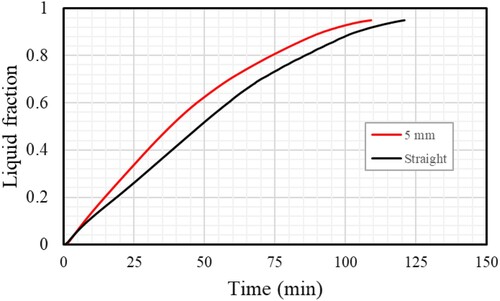
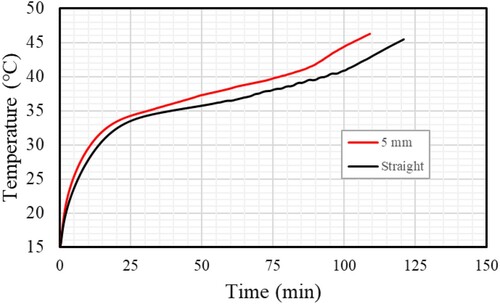
The progression of the PCM's temperature profile for cases 0 and 2 (straight and Y-shaped fins) and various periods is shown in Figure . Due to conduction effect at the initial stage of the process, the mean temperature rises dramatically. Because free convection begins to form in the molten PCM, the previously growing heat transfer rate slows down. Because of the Y-shaped fin's (5 mm) larger area for heat transfer, the maximum temperature was found compared to a straight fin. In contrast, the mean temperature for the forms (linear and Y-shape) cases reaches 45.5°C at 121 min and 46.5°C at 109.5 min, respectively, as shown in Figure . Even with complete melting, only some systems can achieve precise thermal equilibrium.
Figure 10. Development of the PCM temperature profile for cases 0 and 2 (Straight and Y-shaped fins).
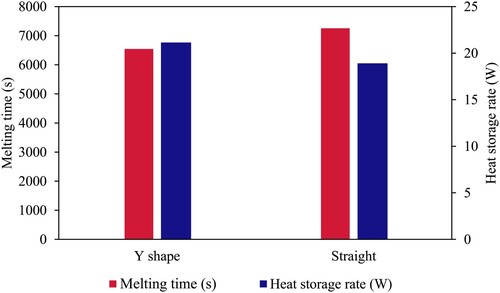
The charging period and the heat storage rate for cases 0 and 2 (straight and Y-shaped fins) are shown in Figure . The heat storage rate is 18.90 W for the case with a straight fin and 21.15 W with a Y-shaped fin (∼12% higher than the case with straight fins). According to the section's summary, the Y-shaped fin enhances the system's thermal performance by (1) supplying a larger energy exchange area, (2) delivering energy to a deeper region inside the PCM domain, and (3) raising the system's average thermal conductivity.
Figure 11. The melting period and the thermal storage rate of the PCM for cases 0 and 2 (Straight and Y-shaped fins).
5.2. Effect of fin’s height
Figure illustrates the melting process of the TES unit for various Y-shape fin lengths (2.5, 5, and 10 mm) at different time steps. As mentioned, by enlarging the heat transfer surface and effective thermal conductivity of the storage unit, the charging process's efficiency is improved. By the use of fins, the deep sections of the PCM get heat from the HTF walls. In each case, nine fins with a fixed spacing were implemened to the inner area of the outer tube. In this research, Y-shaped fins are arranged in three rows of varying lengths. The 10 mm Y-shaped fin outperforms others due to providing a wider area of heat transfer and also higher penetration of heat inside the PCM domain through the fins. The PCM starts to melt between the fins and the pipe. Because of the density fluctuation, the molten PCM surrounding the fins rises and collects at the top. The solid PCM breaks into a couple of parts; one sink at the bottom and the other flutes in the PCM liquid in the domain's centre.
Figure 12. The liquid and solid fractions of the PCM for the system with Y-shaped fins with various lengths at different time steps.
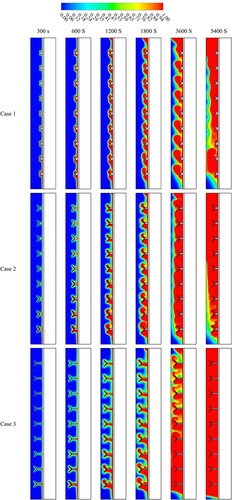
Figure 13. The temperature distributions of the PCM for the system with Y-shaped fins with various lengths at various time steps.
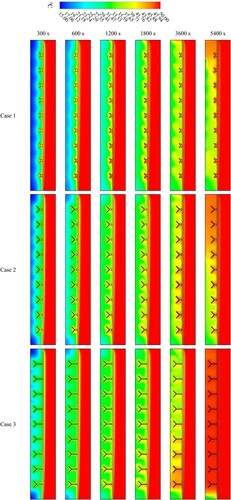
The temperature distributions for cases 1, 2 and 3 are shown in Figure . The results show that for all cases in the HTF domain, the PCM temperature rises in the direction of the wall but remains below the HTF temperature and is incapable of reaching thermal equilibrium (50°C) even after 5400 s. The PCM temperature for 10 mm-long Y-shaped fins was greater than it was for the other cases because the increasing length of fins leads to an increased surface area, improving the system's thermal performance. Due to their function as heat transfer bridges, the fins themselves are unable to establish thermal equilibrium with the HTF even after 5400 s. The higher-temperature liquid PCM grows to the top of the domain because of thermal convection and the buoyancy effect. Because of a higher surface area for thermal transmission, the heat temperature of the PCM is often directly proportional to the length of the fin.
The velocity counter for cases 1, 2 and 3 at the time of 3600 s is in Figure . The findings show that 10 mm-long Y-shaped fins circulate at a lower velocity than in other cases because lengthening the fins reduces the flow's movement, which reduces velocity. As the fins become longer, they produce more minor and larger swirls in the gaps between them.
Figure 14. The PCM velocity profile for cases 1, 2 and 3 at the time of 3600 s.
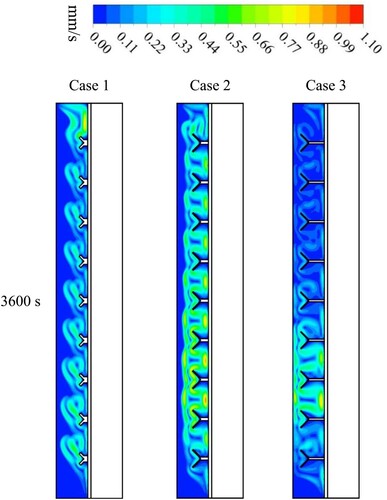
Figure illustrates the development of the whole charging progress for different Y-shaped fin lengths and time steps. The fins enlarge the average thermal conductivity and surface area of the heat transfer, which in turn causes a greater rise in the melting line. The melting process takes 142 min if you use 2.5 mm fins, 109 min if you use 5 mm fins, and 72 min if you use 10 mm fins. The mean temperature also rises considerably at the start of the charging operation because of the conduction heat transfer created in the solid PCM (Figure ). Due to the emergence of free convection in the molten PCM, the heat transmission rate decreases as it increases. The case with the most extended fins was determined to have the highest temperature because of the significant thermal transfer surface area (10 mm). Also, the systems’ average temperatures can only partially approach thermal equilibrium with complete melting. However, in the cases of fins with lengths of 2.5, 5, and 10 mm, the average temperature becomes 42.8, 46.5, and 47°C, respectively.
Figure 15. Development of the PCM liquid fraction for cases 1, 2 and 3.
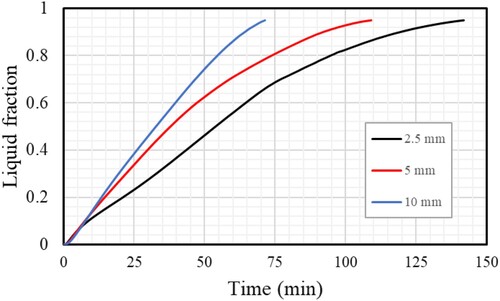
Figure 16. Development of the PCM temperature profile for cases 1, 2 and 3.
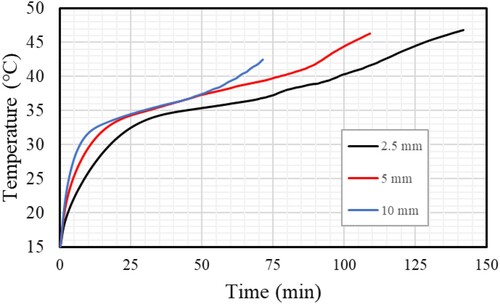
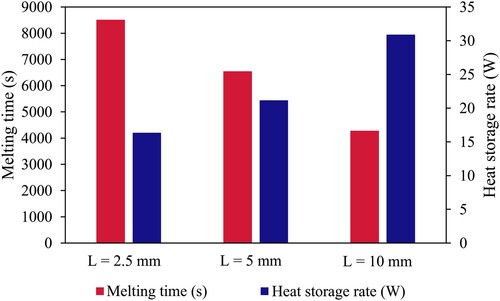
Figure displays the PCM's charging period for various cases of fin length. The case with the most extended fins (10 mm) performs best, revealing that the system's thermal performance increases with system length. This behaviour is produced by the most significant heat transfer surface area for extended fins and heat delivery to the PCM's deepest region. The best case (10 mm) melts in 72 min less than the cases with 2.5 and 5 mm fin lengths, respectively, by 142 and 109 min. Figure also demonstrates the heat storage rate of the TES system for different cases of fin length during the melting process. The longest-finned case has a heat storage rate of 30.89 W, greater than the rates for cases with 2.5 and 5 mm fins by 16.35 and 21.15 W, respectively. It means that by reducing the length of the fins from 10 mm to 5 and 2.5 mm, the heat storage rate reduces by 31.5% and 47.1%, respecetively. The outline of this part reveals that the most extended fins has the highest thermal performance.
Figure 17. Melting time and the thermal storage rate for cases 1, 2 and 3.
5.3. Effect of fins’ angle
Figure depicts the melting of the TES system at various time steps for various Y-shaped fin angles (67.5°,45°, 22.5°). According to the data, decreasing the fin angle increases the PCM's liquid fraction and effective thermal conductivity by expanding the heat transfer zone. At the fin angle of 22.5°, the fins are very close, increasing heat transfer to the PCM solid. Because of the free convection impact, the molten PCM surrounding the fins then rises and gathers more at the top of the domain. On the other hand, for the different fin angles (67.5°,45°), a related trend can be seen; though the PCM is melted for a case with a lower fin angle (22.5°) compared with that of the other systems.
Figure 18. The PCM liquid and solid fractions for cases 3, 4 and 5 at various times.
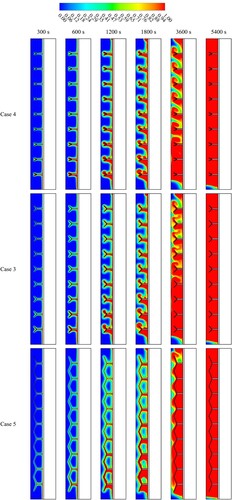
The temperature distributions are shown in Figure for scenarios with different time steps and Y-shaped fin angles (67.5°,45°, 22.5°). The results show that for all cases in the HTF domain, the PCM temperature increases in the direction of the wall. The temperature for case 5 was greater than in the other cases because, at 22.5° angles, nine fins become one by contacting each other and forming a bridge, which improves heat transfer to the PCM solid. The molten PCM surrounding the fins then rises and collects at the top more than in other cases.
Figure 19. The PCM temperature distributions for cases 3, 4 and 5 using various angles of the fin’s tributaries at various times.
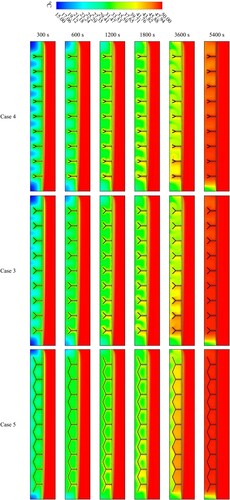
The velocity counter for different angles of Y-shaped fin’s tributaries (67.5°,45°, 22.5°) at the time of 3600 s is shown in Figure . The findings show that the 22.5° angle of Y-shaped fins has a higher circulating velocity than in other cases, creating larger swirls in the gaps between them.
Figure displays the development of the melting process for cases 3, 4 and 5. The fins generally enhance the heat transfer surface area and average thermal conductivity, which causes the melting line to increase more rapidly. When using fins with an angle of 22.5°,45°, and 67.5°), the melting process takes 68.5, 71.5, and 75.5 min, respectively. Due to the conduction heat transfer induced in the solid PCM, the mean temperature also significantly increases at the beginning of the charging process (Figure ). The heat transfer rate diminishes as it rises when free convection develops in the molten PCM. The outcome showed that, in all cases, a decrease in fin angle was associated with an increase in PCM's mean temperature.
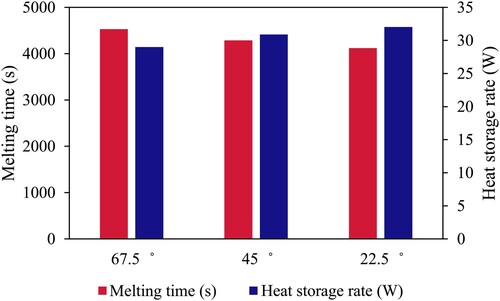
Figure displays the PCM's melting time for various fin angles. The case with the smallest angle of fins (22.5°) performs the best among the others, revealing that the system's thermal performance increases with decreasing angle of fins. The largest heat transfer surface area produces this behaviour for the smallest angle of fins and heat delivery to the PCM's deepest region. The best case (22.5°) melts in 68.5 min less than the cases with 45° and 67.5° fin angles, respectively, by 71.5 and 75.5 min. Figure also demonstrates the heat storage rate of the TES system for different cases of the fin angle during the melting process. The smallest angle-finned case has a heat storage rate of 32.04 W, greater than the cases with 45° and 67.5° fins which have the heat storage rates of 30.89 and 28.99 W, respectively. In the other words, by increasing the angles of the tributaries from 22.5° to 45° and 67.5°, respectively, the heat storage rate reduces by 3.6% and 9.5%.
Figure 20. The PCM velocity counter for case 3, 4 and 5 with various angles of the fin’s tributaries at the 3600 s.
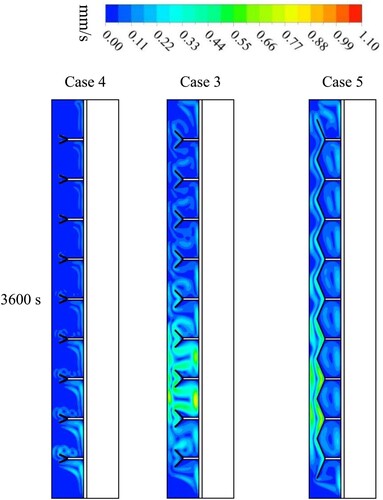
Figure 21. Liquid fraction of the PCM for various angles of the fin’s tributaries at different time
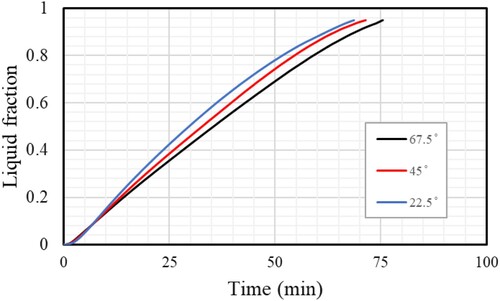
Figure 22. Mean PCM temperature for case 3, 4 and 5 as a function of time
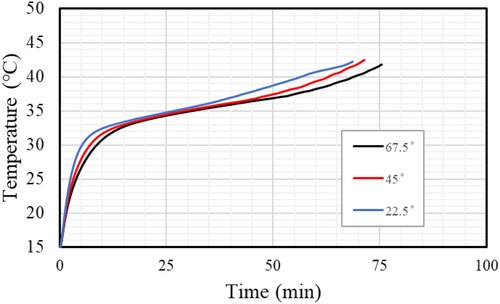
Figure 23. Melting time and heat storage rate of the PCM for various angles of the fin’s tributaries at different time
5.4. Effect of the number of fins
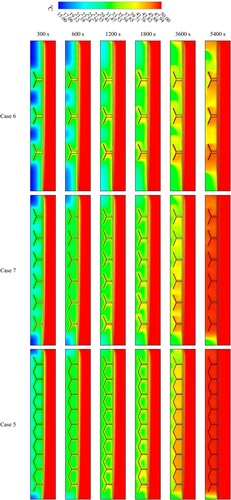
Impact of the fin numbers (3, 6, and 9) on melting performance when the size of the fins is maintained fixed for all the cases shown in Figure . Initially, next to the wall and around the fins, the melting process quickly increases as it absorbs additional heat from the HTF. The solid PCM progressively decreases and separates, forming a solid area among the neighbouring fins. All cases exhibit the same basic behaviour; a thin layer of liquid PCM first covers most of the domain, and this layer progressively thickens. The buoyancy effect causes the liquid component to collect on the unit's upper side while the solid part sinks to the lower side. In two different approaches, the allocation of the fins with uniform spaces also affects how much heat is distributed inside the PCM: first, the PCM receives heat more equally, and second, the top and bottom fins are located nearer the highest and lowest points within the system. Increasing the fins’ surface area, more thermal convection is transmitted to the PCM simultaneously. The liquid PCM's circulation results from free convection formation; however, the fins function as a barrier to this movement, restricting natural convection.
Figure 24. The liquid and solid fraction development for cases 5, 6 and 7.
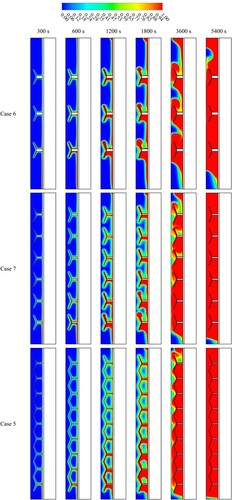
Figure displays the contours of the temperature profile during different time steps when 3, 6, and 9 fins are used. The unit's short length maintains the HTF's thermal properties throughout the melting process. The PCM temperature increases at the fin area near the pipe. Due to the fins’ ability to take heat from the HTF and then release it to the PCM, they cannot achieve heat balance with the HTF during either the early or full melting stages in the case of three fins. For the most current stages of the 6 and 9 fin scenarios, the fins temperature has nearly achieved a stable state with the HTF. The PCM field eventually approaches thermal stability, and due to natural convection, it reaches equilibrium faster in the upper area. The average PCM temperatures in the systems with 3, 6, and 9 fins are 42.1, 44, and 46.8 °C, respectively. The temperature here records less than the other regions due to the area's base gathering the solid phase. Additional fins generally result in a larger surface area for energy exchanging, which enhances conduction at the initial stage and enhances convection owing to the larger surface area after that. As a result, the average temperature rises as fins grow.
Figure 25. The PCM temperature profile development for cases 5, 6 and 7.
The obstacles provided by the fins significantly impact how the molten PCM moves. As seen in Figure , adding more fins restricts movement in the spaces between neighbouring fins. At 3600 s into the melting procedure, most PCM melts, and movement is seen across the domain when three fins are used due to the large area between the two neighbouring fins. However, PCM movement, when employing more fins, is restricted to the small spaces between the fins. Furthermore, the case with more fins has a faster melting rate, which naturally should have a higher movement rate. It is obvious that as the number of fins increases, there is a rise in the circulation between each pair of fins. In this case, the liquid PCM's circulation accelerates the heat transfer rate.
Figure 26. The PCM velocity for case 5, 6 and 7 at the time of 3600 s.
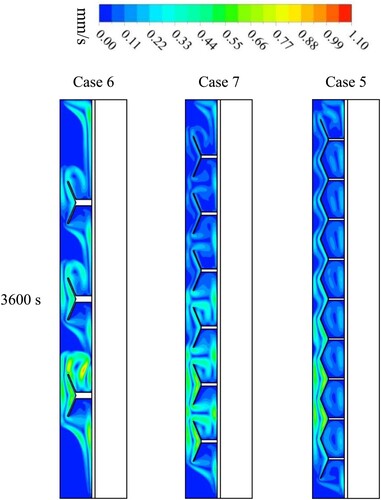
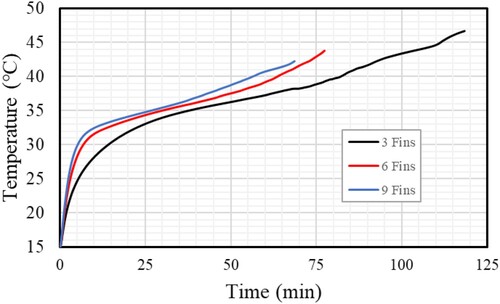
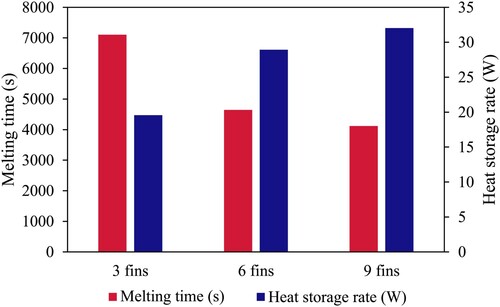
Figure indicates the melting process for various fin numbers for 125 min. In every case, conduction in the solid phase causes the melting process to progress quickly. The melting slope steadily decreases because of producing thermal convection. Since the system with a greater number of fins has a bigger heat transfer area, the overall time for the melting in the case of using three fins is 119 min, but in the case of using nine fins, the entire time for the melting is 69 min. As seen in Figure , the initial time causes the mean temperature to rise quickly owing to thermal conduction. In the case of utilizing nine fins, the heat transfer surface area is more considerable; hence, the temperature is higher than that of the other cases at a given time. The PCM's average temperature is 42.1°C at 118 min, 44°C at 79 min, and 46.8°C at 68 min in the cases of using 3, 6, and 9 fins, respectively, as shown in Figure .
Figure 27. Development of the PCM liquid fraction for case 5, 6 and 7.
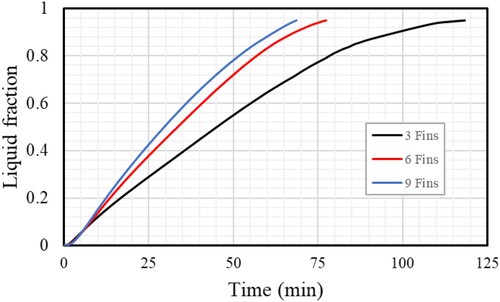
Figure 28. Average temperature of the PCM for case 5, 6 and 7.
The heat storage rate for various fins is also presented in Figure . The heat storage rates are 19.57, 28.93, and 32.04 W in the cases of using 3, 6, and 9 fins, respectively. It means that by reducing the number of fins from 9 to 6 and 3, the heat storage rate reduces by 9.7% and 38.9%, respectively. According to the findings, adding more fins improves the system's thermal performance by (a) enhancing the average thermal conductivity, (b) providing a greater thermal exchange area, and (c) transferring heat to a deeper location.
Figure 29. The melting time and heat storage rate of the PCM for the various numbers of fins.
5.5. Effect of working fluid’s Reynolds number
The velocity of the HTF, which Re represents, impacts how the PCM melts. Extra energy is transported to the PCM by the greater flow rate, which improves temperature differential between the PCM and HTF and causes the PCM to melt more quickly. The liquid component accumulates at the unit's upper side in the case with a lower Re, while the solid PCM remains contained to the bottom of the area. The melting process is accelerated by raising Re, which causes the solid PCM to contract even more. When Re equals 2000, most of the PCM (98%) melts, with just a few minor patches remaining solid. This behaviour is further shown for the case with the greater flow rate showing a higher temperature. The Re number of 2000 results in a system average temperature of 47.9°C. It has been noted that a rise in Re causes the PCM phase liquid to circulate more freely between the fins.
The flow rate of the HTF influences the system's overall performance and the thermal rate of the PCM. Figure examines the effect of the HTF laminar movement using different Re (500, 1000, and 2000) for the case of nine fins. The faster flow improves the heat transfer performance and charging rate. The low values of the Re chosen to use the least amount of pumping power display the laminar flow rate of the HTF. The charging conduct lines have variable slopes but are comparable for various values of Re. For the cases of Re equal 500, 1000, and 2000, the needed total melting times are 86, 69.5, and 59.5 min, respectively. The faster flow offers a more uniform high temperature of the HTF, resulting in a greater temperature differential between the HTF and the PCM and a greater thermal exchange, which benefits the bigger Re during the complete charging of the PCM. The mean temperature increases of the PCM for the specified Re values are shown in Figure . The mean temperature is directly proportional to the Re. The temperature rises dramatically during the first stages of the charging procedure because of conduction heat transfer. The slope subsequently decreases due to increased thermal convection brought on by the charging process. The difference in the incline, which was exposed to all Re, started to appear after 25 min and was caused by the production of liquid, which had a free convection influence.
Figure 30. The liquid fraction generation of the PCM for different values of Re.
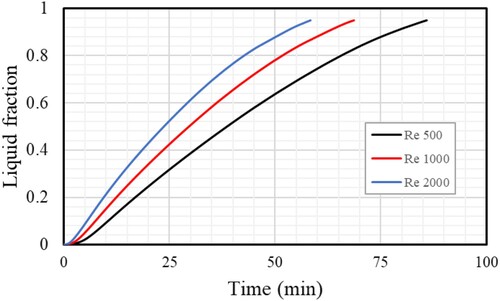
Figure 31. Mean PCM temperature for different values of Re.
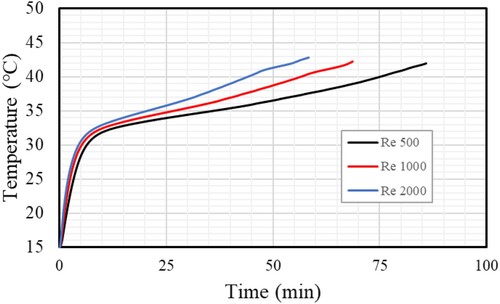
Table illustrates the PCM's melting time and the heat storage rate during the charging procedure for various values of Re. The required total melting durations are 86, 69.5, and 59.5 min, respectively, for the cases of Re equalling 500, 1000, and 2000. In the Reynolds numbers 500, 1000, and 2000, the heat storage rate is 25.54W, 32.04W, and 37.96W. Findings indicate that raising the Reynolds number increases thermal efficiency and melting rate.
Table 4. PCM's melting time and heat storage rate for various values of Re.
5.6. Effect of working fluid’s temperature
The fluid temperature significantly impacts the melting procedure in the TES units. The PCM melts more quickly when the HTF has a higher temperature because there is a greater heat transfer rate to the PCM because of the greater temperature differential between the PCM and the HTF. More than 99% of the PCM melts at the higher HTF temperature (55°C), with a small portion remaining trapped at the domain's bottom. The liquid percentage falls to 95% and 85% at 3600 s when the HTFs’ temperatures are brought down to 50 and 45°C, respectively, slowing the melting rate. When the HTF's initial temperature is greater (50 or 45°C), the mean temperature of the PCM registers higher values (54°C), decreasing to 49 and 44°C. Increasing inlet temperature indicates a growth in the circulation of the molten PCM between every two fins, which refers to the transfer of PCM from the solid to the liquid phase.
The HTF's inlet temperature significantly impacts the TES system's performance during the melting process. Figure shows the TES charging processes using three different HTFs’ inlet temperatures (45, 50, and 55°C). The figure depicts the direct relationship between the charging procedure rate and the HTF initial temperature. Compared to the PCM, which begins at the beginning temperature, higher HTF results in a more significant temperature differential. The higher the thermal exchange rate, the greater temperature differences produce a faster charging rate. When the initial temperature is raised from 45°C to 50 and 55°C, the melting time is reduced by 98 and 55 min, respectively. Using the hotter HTF and attaining thermal equilibrium more quickly, the PCMs’ temperature rose to a greater value (Figure ). The legal analysis was carried out until the PCM temperature equalled 45°C since the simulation's results were based on complete melting rather than thermal equilibrium.
Figure 32. Liquid fraction of PCM with three different HTFs’ inlet temperatures (45, 50, and 55°C).
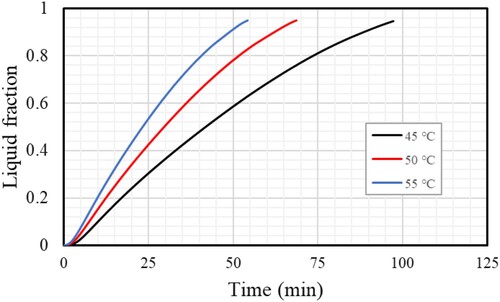
Figure 33. Mean temperature of PCM with three different HTFs’ inlet temperatures (45, 50, and 55°C).
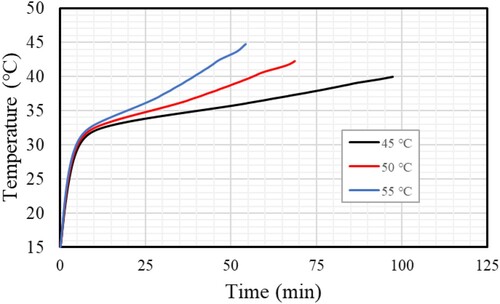
Table lists the PCM's melting time and the heat storage rate for three different HTFs at 45, 50, and 55°C inlet temperatures. The data indicate that for inlet temperatures of HTF 45°C to 50 and 55°C, respectively, the required PCM melting times are 98, 69, and 54 min. In the inlet temperatures of HTF 45°C to 50 and 55°C, respectively, the heat storage rate is 21.92W, 32.04W, and 41.73 W. Findings indicate that raising the inlet temperatures of HTF increases thermal efficiency and melting rate.
Table 5. PCM's melting time and the heat storage rate during the charging procedure for various values of inlet temperatures.
6. Conclusion
Using a double-pipe heat exchanger fitted with circular Y-designed fins, the charging time performance of the PCM was investigated in this work. The Y-shaped fin's geometrical characteristics are also adjusted, and a sensitivity analysis is carried out to produce the best fin configuration possible. The goal of this study was to better understand how the various fin shapes affect the system's melting performance. The main contribution of this study is to provide a unique design for a heat energy storage unit at the design stage by combining the impacts of the form and orientation of the fins. The main conclusions of the present research are as follows:
The creation of the liquid phase is accelerated by 109.5 and 121 min, respectively, when a 5 mm Y-shaped fin is used instead of a straight fin. The heat storage rate varies between 18.90 and 21.15 W depending on whether the fins are straight or Y-shaped (5 mm).
The 10 mm Y-shaped fin performs better than others owing to the characteristics of this length, giving a broad region of the liquid PCM circulation, which provides a larger heat transfer but has a lower heat transfer surface area.
By reducing the length of the fins from 10 mm to 5 and 2.5 mm, the heat storage rate reduces by 31.5% and 47.1%, respecetively.
Decreasing the angle of the fin enhanced the PCM's liquid content and effective thermal conductivity. Since at the angle of 22.5°, the nine fins form one fin through contact with each other and create a bridge, increasing the heat transfer to the PCM solid. The PCM temperature for the Y-shaped fins at this angle was higher than it was for the other cases. Additionally, molten PCM surrounding the fins rises and collects at the top more frequently than the other cases.
The Y-shaped fins at the angle of 22.5° have a higher circulation velocity than in other conditions, leading to larger vortices in the spaces between them. The optimal case (22.5°) melts in 68.5 min shorter than the cases with 450 and 67.50 fin angles, respectively, by 71.5 and 75.5 min.
The performance of melting is improved by the greater flow rate. For the Re numbers of 500, 1000, and 2000, the necessary melting times are 86, 69.5, and 59.5 min, respectively.
The PCM melts more quickly due to the greater Heat Transfer Fluid temperature. When the HTF is at 55 °C, the PCM's average temperature is higher (54 °C), but when the HTF is at a lower starting temperature (50 or 45 °C), it falls to 49 and 44 °C, respectively.
This work provided suggestions for improving the melting process, such as the effective use of fins and nanoparticles. Also the use of fins is a better approach to address the limitations brought on by PCM's low heat conductivity.
Acknowledgements
Dr Amir Keshmiri would also like to acknowledge the funding by the UK Engineering and Physical Sciences Research Council (EPSRC) under Impact Acceleration Account (IAA) provided to the University of Manchester, which has supported the present research.
Disclosure statement
No potential conflict of interest was reported by the author(s).
References
- Abed, A. M., Mohammed, H. I., Patra, I., Mahdi, J. M., Arshad, A., Sivaraman, R., Ibrahem, R. K., Al-Qrimli, F. A., Dhahbi, S., & Talebizadehsardari, P. (2022). Improving the melting performance in a triple-pipe latent heat storage system using hemispherical and quarter-spherical fins with a staggered arrangement. Frontiers in Chemistry, 10, 1018265. https://doi.org/10.3389/fchem.2022.1018265
- Albatayneh, A., Alterman, D., Page, A., & Moghtaderi, B. (2018). Renewable energy systems to enhance buildings thermal performance and decrease construction costs. Energy Procedia, 152, 312–317. https://doi.org/10.1016/j.egypro.2018.09.138
- Başal, B., & Ünal, A. (2013). Numerical evaluation of a triple concentric-tube latent heat thermal energy storage. Solar Energy, 92, 196–205. https://doi.org/10.1016/j.solener.2013.02.032
- Bazri, S., Badruddin, I. A., Naghavi, M. S., & Bahiraei, M. (2018). A review of numerical studies on solar collectors integrated with latent heat storage systems employing fins or nanoparticles. Renewable Energy, 118, 761–778. https://doi.org/10.1016/j.renene.2017.11.030
- Belazreg, A., Abderrahmane, A., Qasem, N. A. A., Sene, N., Mohammed, S., Younis, O., Guedri, K., Nasajpour-Esfahani, N., & Toghraie, D. (2022). Effect of Y-shaped fins on the performance of shell-and-tube thermal energy storage unit. Case Studies in Thermal Engineering, 40, 102485. https://doi.org/10.1016/j.csite.2022.102485
- Bilgen, S., Kaygusuz, K., & Sari, A. (2004). Renewable energy for a clean and sustainable future. Energy Sources, 26(12), 1119–1129. https://doi.org/10.1080/00908310490441421
- Brent, A., Voller, V., & Reid, K. (1988). Enthalpy-porosity technique for modeling convection-diffusion phase change: Application to the melting of a pure metal. Numerical Heat Transfer, Part A Applications, 13(3), 297–318. https://doi.org/10.1080/10407788808913615
- Bull, S. R. (2001). Renewable energy today and tomorrow. Proceedings of the IEEE, 89(8), 1216–1226. https://doi.org/10.1109/5.940290
- Chen, C., Zhang, H., Gao, X., Xu, T., Fang, Y., & Zhang, Z. (2016). Numerical and experimental investigation on latent thermal energy storage system with spiral coil tube and paraffin/expanded graphite composite PCM. Energy Conversion and Management, 126, 889–897. https://doi.org/10.1016/j.enconman.2016.08.068
- Coady, D., Parry, I., Sears, L., & Shang, B. (2017). How large are global fossil fuel subsidies? World Development, 91, 11–27. https://doi.org/10.1016/j.worlddev.2016.10.004
- Coyle, E. D., & Simmons, R. A. (2014). Understanding the global energy crisis. Purdue University Press.
- Deng, S., Nie, C., Jiang, H., & Ye, W.-B. (2019). Evaluation and optimization of thermal performance for a finned double tube latent heat thermal energy storage. International Journal of Heat and Mass Transfer, 130, 532–544. https://doi.org/10.1016/j.ijheatmasstransfer.2018.10.126
- Dincer, I., & Dost, S. (1996). A perspective on thermal energy storage systems for solar energy applications. International Journal of Energy Research, 20(6), 547–557. https://doi.org/10.1002/(SICI)1099-114X(199606)20:6<547::AID-ER173>3.0.CO;2-S
- Dincer, I., & Rosen, M. A. (2021). Thermal energy storage: Systems and applications. John Wiley & Sons.
- Ding, M., Chen, G., Xu, W., Jia, C., & Luo, H. (2020). Bio-inspired synthesis of nanomaterials and smart structures for electrochemical energy storage and conversion. Nano Materials Science, 2(3), 264–280. https://doi.org/10.1016/j.nanoms.2019.09.011
- Dong, X., Hao, G., & Yu, R. (2022). Two-dimensional smoothed particle hydrodynamics (SPH) simulation of multiphase melting flows and associated interface behavior. Engineering Applications of Computational Fluid Mechanics, 16(1), 588–629. https://doi.org/10.1080/19942060.2022.2026820
- Ebadi, S., Tasnim, S. H., Aliabadi, A. A., & Mahmud, S. (2018). Geometry and nanoparticle loading effects on the bio-based nano-PCM filled cylindrical thermal energy storage system. Applied Thermal Engineering, 141, 724–740. https://doi.org/10.1016/j.applthermaleng.2018.05.091
- Ellabban, O., Abu-Rub, H., & Blaabjerg, F. (2014). Renewable energy resources: Current status, future prospects and their enabling technology. Renewable and Sustainable Energy Reviews, 39, 748–764. https://doi.org/10.1016/j.rser.2014.07.113
- Fadl, M., & Eames, P. C. (2019). Numerical investigation of the influence of mushy zone parameter Amush on heat transfer characteristics in vertically and horizontally oriented thermal energy storage systems. Applied Thermal Engineering, 151, 90–99. https://doi.org/10.1016/j.applthermaleng.2019.01.102
- Fteiti, M. A., Ghalambaz, M., Younis, O., Sheremet, M., & Ismael, M. (2023). The influence of the metal foam layer shape on the thermal charging response time of a latent heat thermal energy storage system. Journal of Energy Storage, 58, 106284. https://doi.org/10.1016/j.est.2022.106284
- Hauer, A. (2007). Sorption theory for thermal energy storage. In H. Ö. Paksoy (Ed.), Thermal energy storage for sustainable energy consumption (pp. 393–408). Springer.
- Huang, G., Curt, S. R., Wang, K., & Markides, C. N. (2020). Challenges and opportunities for nanomaterials in spectral splitting for high-performance hybrid solar photovoltaic-thermal applications: A review. Nano Materials Science, 2(3), 183–203. https://doi.org/10.1016/j.nanoms.2020.03.008
- Huang, X., Guo, X., Ding, Y., Wei, R., Mao, S., Zhu, Y., & Bao, Z. (2021). Amorphous silicon from low-temperature reduction of silica in the molten salts and its lithium-storage performance. Chinese Chemical Letters, 32(2), 598–603. https://doi.org/10.1016/j.cclet.2020.11.041
- Karar, O., Emani, S., Marappa Gounder, R., Myo Thant, M. M., Mukhtar, H., Sharifpur, M., & Sadeghzadeh, M. (2021). Experimental and numerical investigation on convective heat transfer in actively heated bundle-pipe. Engineering Applications of Computational Fluid Mechanics, 15(1), 848–864. https://doi.org/10.1080/19942060.2021.1920466
- Karekezi, S., Kithyoma, W., & Initiative, E. (2003). Renewable energy development. Paper presented at the workshop on African Energy Experts on Operationalizing the NEPAD Energy Initiative, June.
- Kibria, M., Anisur, M., Mahfuz, M., Saidur, R., & Metselaar, I. (2014). Numerical and experimental investigation of heat transfer in a shell and tube thermal energy storage system. International Communications in Heat and Mass Transfer, 53, 71–78. https://doi.org/10.1016/j.icheatmasstransfer.2014.02.023
- Liu, Z., Liu, Z., Liu, G., Yang, X., & Yan, J. (2022). Melting assessment on the effect of nonuniform Y-shaped fin upon solid–liquid phase change in a thermal storage tank. Applied Energy, 321, 119330. https://doi.org/10.1016/j.apenergy.2022.119330
- Liu, Z., Liu, Z., Yang, X., & Yang, X. (2020). Melting performance analysis of phase change material in latent heat storage unit with Y-shaped fins. Energy proceeding, Volume 13: Low Carbon Cities and Urban Energy Systems: Part II, Tokio, Japan.
- Longeon, M., Soupart, A., Fourmigué, J.-F., Bruch, A., & Marty, P. (2013). Experimental and numerical study of annular PCM storage in the presence of natural convection. Applied Energy, 112, 175–184. https://doi.org/10.1016/j.apenergy.2013.06.007
- Mahdavi, M., Tiari, S., & Pawar, V. (2020). A numerical study on the combined effect of dispersed nanoparticles and embedded heat pipes on melting and solidification of a shell and tube latent heat thermal energy storage system. Journal of Energy Storage, 27, 101086. https://doi.org/10.1016/j.est.2019.101086
- Mahdi, J. M., Lohrasbi, S., Ganji, D. D., & Nsofor, E. C. (2019). Simultaneous energy storage and recovery in the triplex-tube heat exchanger with PCM, copper fins and Al2O3 nanoparticles. Energy Conversion and Management, 180, 949–961. https://doi.org/10.1016/j.enconman.2018.11.038
- Mahdi, J. M., Lohrasbi, S., & Nsofor, E. C. (2019). Hybrid heat transfer enhancement for latent-heat thermal energy storage systems: A review. International Journal of Heat and Mass Transfer, 137, 630–649. https://doi.org/10.1016/j.ijheatmasstransfer.2019.03.111
- Mahdi, J. M., & Nsofor, E. C. (2017). Melting enhancement in triplex-tube latent thermal energy storage system using nanoparticles-fins combination. International Journal of Heat and Mass Transfer, 109, 417–427. https://doi.org/10.1016/j.ijheatmasstransfer.2017.02.016
- Mahmoud, M., Mohammed, H., Mahdi, J., Bokov, D., Ben Khedher, N., Alshammari, N., Talebizadehsardari, P., & Yaïci, W. (2021). Melting enhancement in a triple-tube latent heat storage system with sloped fins. Nanomaterials, 11(11), 3153. https://www.mdpi.com/2079-4991/11/11/3153.
- Mat, S., Al-Abidi, A. A., Sopian, K., Sulaiman, M. Y., & Mohammad, A. T. (2013). Enhance heat transfer for PCM melting in triplex tube with internal–external fins. Energy Conversion and Management, 74, 223–236. https://doi.org/10.1016/j.enconman.2013.05.003
- Menni, Y., Ameur, H., Sharifpur, M., & Ahmadi, M. H. (2021). Effects of in-line deflectors on the overall performance of a channel heat exchanger. Engineering Applications of Computational Fluid Mechanics, 15(1), 512–529. https://doi.org/10.1080/19942060.2021.1893820
- Mobedi, M., Hooman, K., & Tao, W.-Q. (2022). Solid-Liquid thermal energy storage: Modeling and applications. CRC Press.
- Najim, F. T., Mohammed, H. I., Al-Najjar, H. M. T., Thangavelu, L., Mahmoud, M. Z., Mahdi, J. M., Tiji, M. E., Yaïci, W., & Talebizadehsardari, P. (2022). Improved melting of latent heat storage using fin arrays with non-uniform dimensions and distinct patterns. Nanomaterials, 12(3), 403. https://doi.org/10.3390/nano12030403
- Nie, C., Deng, S., & Liu, J. (2020). Numerical investigation of PCM in a thermal energy storage unit with fins: Consecutive charging and discharging. Journal of Energy Storage, 29, 101319. https://doi.org/10.1016/j.est.2020.101319
- Nithyanandam, K., & Pitchumani, R. (2014). Cost and performance analysis of concentrating solar power systems with integrated latent thermal energy storage. Energy, 64, 793–810. https://doi.org/10.1016/j.energy.2013.10.095
- Pahamli, Y., Hosseini, M., Ranjbar, A., & Bahrampoury, R. (2018). Inner pipe downward movement effect on melting of PCM in a double pipe heat exchanger. Applied Mathematics and Computation, 316, 30–42. https://doi.org/10.1016/j.amc.2017.07.066
- Pakrouh, R., Hosseini, M., Ranjbar, A., & Bahrampoury, R. (2015). A numerical method for PCM-based pin fin heat sinks optimization. Energy Conversion and Management, 103, 542–552. https://doi.org/10.1016/j.enconman.2015.07.003
- Pfleger, N., Bauer, T., Martin, C., Eck, M., & Wörner, A. (2015). Thermal energy storage–overview and specific insight into nitrate salts for sensible and latent heat storage. Beilstein Journal of Nanotechnology, 6(1), 1487–1497. https://doi.org/10.3762/bjnano.6.154
- Rostami, M. H., Najafi, G., Motevalli, A., Sidik, N. A. C., & Harun, M. A. (2021). Evaluation and improvement of thermal energy of heat exchangers with SWCNT, GQD nanoparticles and PCM (RT82). Journal of Advanced Research in Fluid Mechanics and Thermal Sciences, 79(1), 153–168. https://doi.org/10.37934/arfmts.79.1.153168
- Rubitherm, R. (2022). Product information, data sheet of RT35. https://www.rubitherm.eu/media/products/datasheets/Techdata_RT35_EN_02092022.PDF
- Saeed, A. M., Abderrahmane, A., Qasem, N. A., Mourad, A., Alhazmi, M., Ahmed, S. E., & Guedri, K. (2022). A numerical investigation of a heat transfer augmentation finned pear-shaped thermal energy storage system with nano-enhanced phase change materials. Journal of Energy Storage, 53, 105172. https://doi.org/10.1016/j.est.2022.105172
- Shafi, J., Ghalambaz, M., Fteiti, M., Ismael, M., & Ghalambaz, M. (2022). Computational modeling of latent heat thermal energy storage in a shell-tube unit: Using neural networks and anisotropic metal foam. Mathematics, 10(24), 4774. https://doi.org/10.3390/math10244774
- Tiji, M. E., Eisapour, M., Yousefzadeh, R., Azadian, M., & Talebizadehsardari, P. (2020). A numerical study of a PCM-based passive solar chimney with a finned absorber. Journal of Building Engineering, 32, 101516. https://doi.org/10.1016/j.jobe.2020.101516
- Wang, H., Fu, F., Huang, M., Feng, Y., Han, D., Xi, Y., Xiong, W., Yang, D., & Niu, L. (2022). Lignin-based materials for electrochemical energy storage devices. Nano Materials Science, https://doi.org/10.1016/j.nanoms.2022.01.002
- Wang, P., Wang, X., Huang, Y., Li, C., Peng, Z., & Ding, Y. (2015). Thermal energy charging behaviour of a heat exchange device with a zigzag plate configuration containing multi-phase-change-materials (m-PCMs). Applied Energy, 142, 328–336. https://doi.org/10.1016/j.apenergy.2014.12.050
- Wang, Y., Abed, A. M., Singh, P. K., Tag-Eldin, E., & Arsalanloo, A. (2022). Multi-Stage optimization of LHTESS by utilization of Y-shaped Fin in a rectangular enclosure. Case Studies in Thermal Engineering, 38, 102348. https://doi.org/10.1016/j.csite.2022.102348
- Xiang, J., Deng, L., Zhou, C., Zhao, H., Huang, J., & Tao, S. (2022). Heat transfer performance and structural optimization of a novel micro-channel heat sink. Chinese Journal of Mechanical Engineering, 35(1), 1–12. https://doi.org/10.1186/s10033-022-00704-5
- Yan, H., Yang, H., Luo, J., Yin, N., Tan, Z., & Shi, Q. (2021). Thermodynamic insights into n-alkanes phase change materials for thermal energy storage. Chinese Chemical Letters, 32(12), 3825–3832. https://doi.org/10.1016/j.cclet.2021.05.017
- Ye, W.-B., Zhu, D.-S., & Wang, N. (2011). Numerical simulation on phase-change thermal storage/release in a plate-fin unit. Applied Thermal Engineering, 31(17), 3871–3884. https://doi.org/10.1016/j.applthermaleng.2011.07.035
- Zhao, C., Lu, W., & Tian, Y. (2010). Heat transfer enhancement for thermal energy storage using metal foams embedded within phase change materials (PCMs). Solar Energy, 84(8), 1402–1412. https://doi.org/10.1016/j.solener.2010.04.022
- Zou, C., Zhao, Q., Zhang, G., & Xiong, B. (2016). Energy revolution: From a fossil energy era to a new energy era. Natural Gas Industry B, 3(1), 1–11. https://doi.org/10.1016/j.ngib.2016.02.001