
ABSTRACT
Atrophic glossitis is a common disease in oral mucosal diseases. The Current studies have found the human oral cavity contains numerous and diverse microorganisms, their composition and diversity can be changed by various oral diseases. To understand the composition and diversity of oral microbiome in atrophic glossitis is better to explore the cause and mechanism of atrophic glossitis. The salivary microbiome is comprised of indigenous oral microorganisms that are specific to each person, exhibits long-term stability. We used llumina MiSeq high-throughput sequencing based on the V3-V4 region of the bacterial 16S rRNA gene and the internal transcribed spacer (ITS) region of fungal rRNA genes from saliva in atrophic glossitis patients and healthy individuals to explore the composition and diversity of oral microbiome. In our reports, it showed a lower diversity of bacteria and fungi in atrophic glossitis patients than in healthy individuals. The data further suggests that Lactobacillus and Saccharomycetales were potential indicators for the initiation and development of atrophic glossitis. Moreover, we also discuss the relationship between the oral microbial ecology and atrophic glossitis.
Introduction
Atrophic glossitis is known as smooth tongue, tongues with it exhibit a smooth, glossy appearance with a red or pink background. The smooth quality is caused by the atrophy of filiform papillae. Histologically, atrophic glossitis is characterized by epithelial atrophy and varying degrees of chronic inflammation in the sub-epithelial connective tissue. It commonly occurs due to nutritional deficiencies such as vitamin B12, folic acid, iron deficiencies, or celiac disease [Citation1–3]. Other aetiological factors include hyposalivation and candidiasis infection [Citation4–6]. Currently, most studies suggested that Candida albicans was the primary component of the oral microbiota that was relevant to atrophic glossitis. Candida is the easiest genus to separate in the oral cavity and is one of the most common taxa of fungi that contribute to the early formation of in vitro biofilms [Citation7,Citation8]. However, apart from Candida albicans, little is known about other species in the oral microbiota that are correlated with atrophic glossitis. The oral microbiome, including bacteria and fungi, involved in atrophic glossitis should be explored.
Data from culture and molecular studies have collectively revealed that more than 700 species may live in the human oral cavity: approximately 600 bacterial species and 100 fungal species [Citation9–12]. A complex role of the oral microbiome and variations in its composition are thought to be correlated with oral diseases, including dental caries, halitosis, periodontal disease, and apical periodontitis [Citation13]. Therefore, an understanding of both oral microbial composition and diversity are crucial to evaluate their relationships with the healthy status of the host. Currently, there is no report about the oral microbial composition and diversity of atrophic glossitis, and we know only that Candida is most importantly related to atrophic glossitis.
Many strategies have been used to analyse the characterization and variability in the oral microbiota [Citation14]. Culture-based methods have been traditionally used to study the diversity of the oral microbiota, but early microscopy studies have already suggested that roughly one-half of the oral microbiota cannot be cultivated in vitro [Citation15,Citation16]. Currently, modern techniques are used to overcome these obstacles, and molecular methods for microbial identification can be directly used in clinical samples to detect unexpected (open-ended analysis) and target-specific taxa (closed-ended analysis) in a given environment, which found that 70% were cultivable and 30% uncultivatable [Citation13,Citation17,Citation18]. Oral sites, especially saliva, have the highest evenness, while buccal mucosa and keratinized gingiva have lower alpha diversity than the other oral sites [Citation19,Citation20]. Surprisingly, the salivary microbiome as revealed by 16S rRNA gene sequence-based analyses was significantly more robust [Citation21]. At present, broad-range polymerase chain reaction (PCR) amplification of 16S rRNA followed by cloning and Sanger-based sequencing to obtain a more comprehensive profile (abundance and diversity) of the oral microbiome V3-V4 regions are considered the most reliable and capable method of providing the entire picture of bacteria[B. Citation22]. A more comprehensive profile of the fungal microbiome can be obtained by amplifying the universal internal transcribed spacer (ITS) region of the rRNA gene (analogous to 16S rRNA sequencing in bacteria), which has broad fungal specificity, especially at low taxonomic levels [Citation23,Citation24].
In our study, we characterized the oral microbiome in 50 adults who had atrophic glossitis or were healthy, amplifying the V3-V4 region of the bacterial 16S rRNA gene and the ITS region of the fungal rRNA gene in saliva to describe the community structures and diversity of the oral microbiome.
Materials and methods
Study population
The study population is consisted of 76 women and 24 men with 40 years or older from Shanxi Provincial Peoples Hospital. The oral microbiome in 50 participants with atrophic glossitis and 50 healthy participants was characterized. For the atrophic glossitis subjects, their lingual papillae on the dorsum of the tongue decreased by more than 50%, and long-term areas of damage with pain persisted more than 2 months; none used any broad-spectrum antibiotics or antifungal medicine for nearly 2 weeks. None of the patients used glucocorticoids or immunosuppressants within the 3 months, and there was no tumour recurrence. All participants provided written informed consent for all study procedures, including questionnaires and saliva sample collection. Written informed consent was obtained from the all participants and ethical approval for the study was obtained from the Ethics Committee of Shanxi Provincial People’s Hospital (No-51).
Saliva sample collection
The participants were provided the Saliva DNA Sample Collection Kit (made in China) for collecting saliva according to the manufacturer’s instructions. At the time of consent, each participant provided descriptive phenotypic information, including their age, sample number, type, and time. The stimulated saliva sample produced during the last 2 min (2 ml) was collected in sterile plastic tubes, where upon receipt, they were immediately stored at −80°C in freezers for DNA extraction at the time of analysis.
DNA extraction and PCR amplification
DNA was extracted from saliva samples by using the QIAamp DNA Mini kit (Qiagen, Germany) following the manufacturer’s instructions. Genomic DNA quality was detected by a Thermo NanoDrop 2000 UV micro-ultraviolet spectrophotometer (Thermo Fisher Scientific, USA) and 1% agarose gel electrophoresis. Bacteria and fungi presenting these samples were identified with 16S probes and ITS-based probes, respectively. For bacterial identification, the V3-V4 region of 16S rRNA was amplified in triplicate using primers with the universal primer set (forward primer 341 F:5ʹ CCTACGGGNGGCWGCAG 3ʹ; reverse primer 805 R: 5ʹ GACTACHVGGGTATCTAATCC 3ʹ). For fungi, the ITS region from rRNA sample extracts was amplified in triplicate using fluorescently labelled forward primer ITS3 (5ʹ GCATCGATGAAGAACGCAGC 3ʹ) and unlabelled reverse primer ITS4 (5ʹ TCCTCCGCTTATTGATATGC 3ʹ). PCR amplification was carried out using a TopTap DNA polymerase kit (Transgen, China) under the following conditions: 94°C for 2 min; followed by 25 cycles of 94°C for 30 sec, 55°C for 30 sec, and 72°C for 1 min; and a final extension at 72°C for 10 min. PCR amplification products were purified using an Agencourt AMPure XP Kit (Beckman Coulter, Brea, CA, USA) according to the manufacturer’s instructions. The DNA products were pooled together with Agencourt AMPure XP PCR Purification Beads (Beckman Coulter, USA) at equal volumes for purification and then examined by 1% agarose gel electrophoresis to obtain the original library. The library was diluted properly. Quantification was performed using an Invitrogen Qubit3.0 Spectrophotometer (Thermo Fisher Scientific, USA), and samples were pooled together with corresponding proportions of DNA according to the sequencing throughput requirements of different samples. Library quality and fragment size were checked by an Agilent 2100 Bioanalyzer (Agilent Technologies, Palo Alto, CA, USA). The quantified and homogenized PCR products were sequenced on an Illumina MiSeq PE250 instrument (Illumina, USA).
Sequence read processing and OTU cluster analysis
Multiplexed paired-end sequences shorter than 20 bases and adaptor sequences were removed by using TrimGalore software to obtain long reads for hypervariable regions and exclude poor-quality reads. FLASH2 software [Citation25] was used to assemble the paired sequences to obtain a merged sequence. Mothur software was used to find and remove primers in the sequence. Sequences with a total base error rate greater than 2 reads in total bases and length less than 100 bp were removed by Usearch software to obtain clean reads. UPARSE software was used to discard singleton sequences. Sequences with similarity >97% were aggregated into the same operational taxonomic units (OTUs). An OTU table of raw counts was normalized to form an OTU table of relative abundance values. The same types of taxa were agglomerated at the phylum, class, order, family and genus levels. The resulting OTU table was used for subsequent species annotation and subsequent statistical analysis.
Bioinformatics analysis
Species abundance analysis uses visual analysis methods to show the species composition in each sample at a certain classification level. The species composition was plotted in a bar chart and displayed on a graph, which presents the composition, relative abundance and proportion of species in each sample and two groups more intuitively.
A heatmap diagram [Citation26] based on distance was used to cluster species of samples. It further displayed their relative abundance changes transformed by Z-score in the groups and reflected the similarities and differences in composition of species in all samples at a specific classification level [Citation27].
Alpha diversity analysis measured significant differences in oral microbial diversity and richness between the two groups. The most well-known and accepted alpha diversity indices were used to evaluate the diversity and richness of biological communities, including the Shannon and Chao1 indices respectively. The diversity and richness of samples for bacteria and fungi were compared from the atrophic glossitis and control groups by the Wilcoxon rank-sum test. The Chao1 and Shannon indices were calculated at 97% identity by mothur software [Citation17].
Beta diversity analysis is often characterized using the number of species shared between two communities. Principal coordinates analysis (PCoA) based on the data matrix using a Bray Curtis distance metric, which exhibited diversity within samples and similarity between samples. However, the significant differences of species between the atrophic glossitis group and control group were not observed in PCoA. ADONIS analysis [Citation28] was used to display the significant differences of species among groups based on Bray-Curtis distances by permutational multivariate analysis of variance. It was used to test for significantly differences between two groups at the P-value<0.05 level.
LEfSe was used to determine taxon differences. The enriched taxon differences between atrophic glossitis and control samples were defined by LEfSe analysis, which identified specific biomarkers discriminating the two study groups using relative abundances. The Cladogram of effect size (LEfSe) showed the taxonomic representation of significant differences between atrophic glossitis group and control group. The linear discriminant analysis (LDA) of effect size (LEfSe) supports high-dimensional classification comparison and was performed to determine the differently enriched taxa between two groups. The threshold for the logarithmic LDA score for distinguishing features was set to 2.0 (p-value<0.05) [Citation29].
Statistical analysis
For taxon assignments and measurements, forward and reverse sequences from the FASTQ files were analysed separately using the software package QIIME2.9. The reads identified in closed reference picking from the Ribosomal Database Project (RDP; http://rdp.cme.msu.edu/index.jsp) were used for the follow-up analysis. All diversity analysis were conducted using R (version 3.0.1). The Wilcoxon rank-sum test was used to compare the diversity and abundance between two groups, with p-value<0.05 considered a significant difference.
Result
Participant demographics
A total of 100 individuals were enrolled in the study, with 50 atrophic glossitis patients and 50 healthy individuals (24 males and 76 females). The mean age was 65.1 ± 10.4 years in the atrophic glossitis group (age range: 45–85) and 60.9 ± 11.6 years in the control group (age range: 41–89). Participants with atrophic glossitis did not differ significantly from control participants in age and sex distribution (all p-values > 0.05). The demographic and clinical characteristics of the subjects are displayed in (). Cigarette, Alcohol, Oral health status, Coronary disease (CAD), and Parageusia did not differ from atrophic glossitis group with control group (all p-values>0.05). Diabetes mellitus (DM), Hypertension, Degree of atrophic, Anemia, Wetness of tongue body, and Glossodynia were significantly different between the atrophic glossitis group and the control group (all p-values <0.05).
Table 1 Clinical characteristics of atrophic glossitis patients and healthy individuals
Microbial community structure
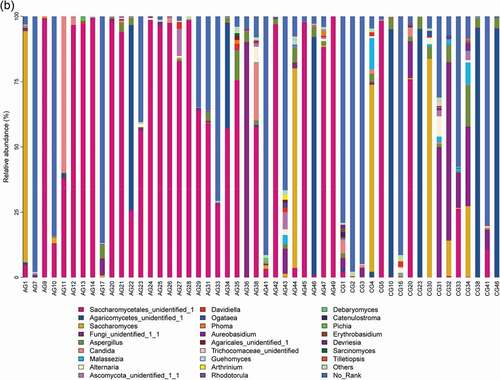
Our results showed that about main bacterial and fungal genera with relative abundance >1% in the oral microbiota of the study changed at the genus level . For bacteria, Streptococcus, Prevotella, Neisseria, Rothia, Veillonella, Haemophilus, Fusobacterium and Leptotrichia were the most common genera in the bar plot. For fungi, Saccharomycetales_unidentified_1, Agaricomycetes_unidentified_1, Saccharomyces, Fungi_unidentified_1_1, Aspergillus, Candida, and Malassezia were the most common genera.
Figure 1. Overall distribution and relative abundance (>1%) of the predominant bacteria at the genus level in oral rinse samples obtained from all participants. (a) Bacteria (b) Fungi
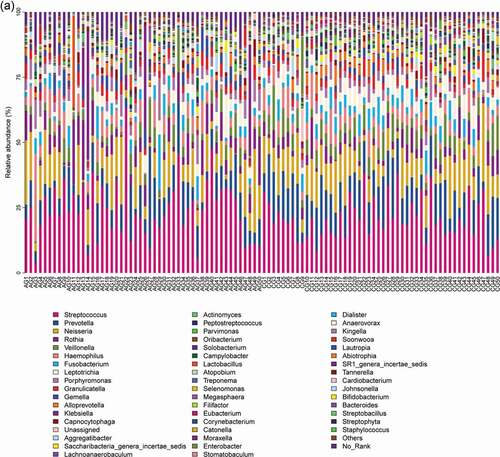
Figure 1. (continued)
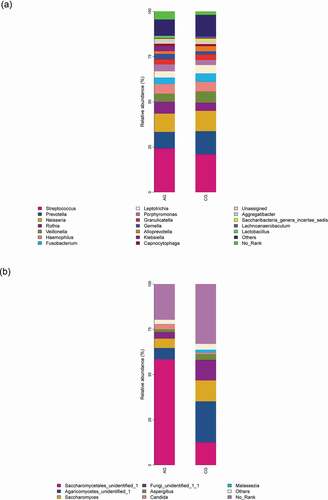
Comparing the two participant groups allows the relative abundance of bacteria and fungi to be visualized . For bacteria, Streptococcus, Rothia, Porphyromonas and Gemella were more relative abundant in the atrophic glossitis group than in the control; Prevotella, Neisseria, Veillonella, Fusobacterium, and Leptotrichia were less relative abundant in the atrophic glossitis group than in the control. For fungi, Saccharomycetales_unidentified_1, Candida was more relative abundant in the atrophic glossitis group than in the control; Agaricomycetes_unidentified_1, Saccharomyces, Aspergillus, and Malassezia were less relative abundant in the atrophic glossitis group than in the control.
Figure 2. Genus level relative richness comparison of two groups. Mean taxonomic profiles for the main microbiome abundant genera in saliva from the atrophic glossitis group and the control group subjects. (a) Bacteria (b) Fungi
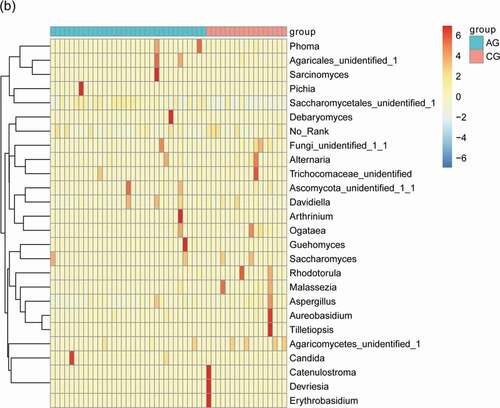
The main bacterial and fungal genera with relative abundance >1% at the genus level can be visualized in () where their relative abundance have Z-score values with color patterns. The discriminating species as well as the samples (atrophic glossitis group and control group) were arranged along the two dimensions (axes) based on hierarchical clustering. Notable patterns emerged when the distributions of taxa within distinct clusters were compared between the atrophic glossitis and control groups.
Figure 3. Heatmap shows the relative abundance (>1%) of species isolates (columns) in all samples (rows) and species are clustered accordingly at the genus level, normalized and Z-score transformed. Color gradient from blue to red indicates species abundance from small to large. (a) Bacteria (b) Fungi
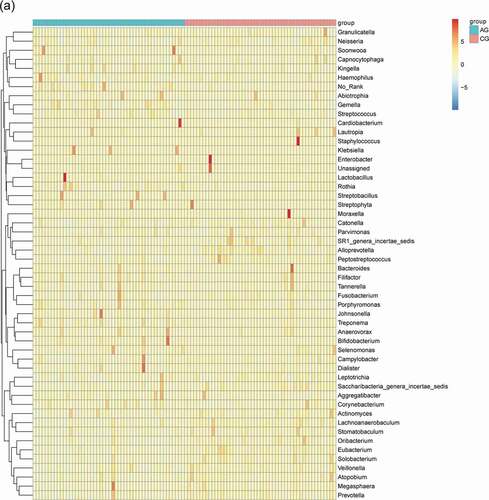
Figure 3. (continued)
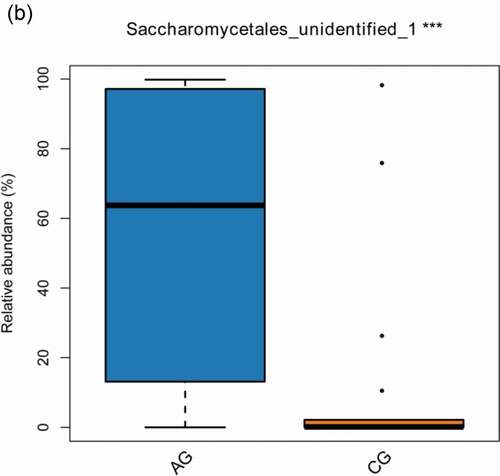
The consistency of the predominant genera among groups and their overall similarity in relative abundance can be seen intuitively in visual analysis in (a,b), but the significant difference of relative abundances among groups cannot be compared. We further screened the following species that differed significantly between groups by the Wilcoxon rank-sum test, including 19 bacterial genera at genus level (p-value<0.05) in total (Alloprevotella, Oribacterium, Solobacterium, Eubacterium, Saccharibacteria_genera_incertae_sedis, Lachnoanaerobaculum, Gemella, Actinomyces, Lactobacillus, Prevotella, Stomatobaculum, SR1_genera_incertae_sedis, Veillonella, Rothia, Treponema, Peptostreptococcus, Catonella, Atopobium, Leptotrichia) () and 1 fungal genera (p-value<0.05) (Saccharomycetales_unidentified_1) ().
Figure 4. The significant differences species with a box diagram at the genus level among the sample groups, showing species degree of dispersion within the group and their relative abundance between different groups. (a) Bacteria: the box-plot shows 19 significantly different bacterial species. (b) Fungi: the box-plot shows 1 significantly different fungal species
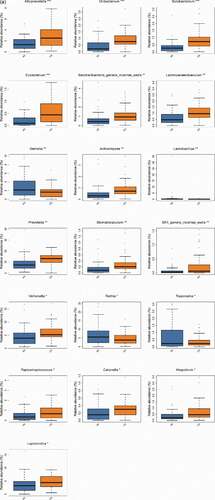
Figure 4. (continued)
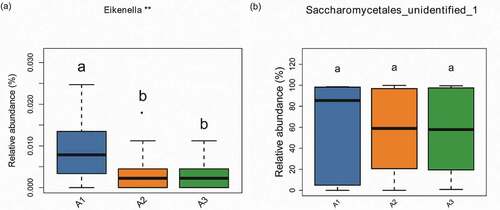
Our results showed the relationship between the degree of atrophic and oral microbial communities, including bacteria and fungi . The atrophic degree of glossitis patients was divided into three groups (slight, moderate, severe). For bacteria, our analysis showed that Eikenella have the correlation with the atrophic degree in atrophic glossitis patients. There was a decrease in relative abundance with the increasing of atrophic degree and a significant difference among groups respectively (slight VS moderate; slight VS severe) (). For fungi, the result showed that Saccharomycetales_unidentified_1 has no correlation with the atrophic degree and its relative abundance has no change with the increasing of atrophic degree ().
Figure 5. Alpha diversity comparisons in saliva from the atrophic glossitis group and the control group are shown. The Shannon indices revealed lower microbial diversity for saliva in the atrophic glossitis group than the control group. (a) Bacteria: p = 0.001899 (c) Fungi: p = 0.010085. The Chao1 indices revealed no difference in richness among two groups. (b) Bacteria: p > 0.05 (d) Fungi: p > 0.05
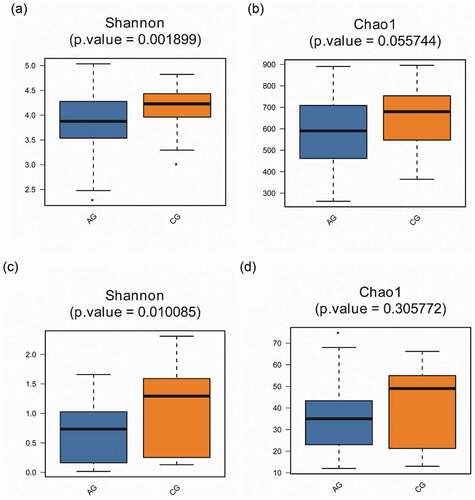
Figure 6. Beta diversity comparisons in the saliva from the atrophic glossitis group and the control group. PCoA of Bray Curtis distance express similarity or difference among two groups and within a group. Each sample is represented by a dot. Visualizing the Bray Curtis distances between samples in a scatterplot where points (representing samples) that are more distant from one another are dissimilar. The approximate proportion (%) of variance explained by each principal coordinate axis is reported in the axis label. (a) Bacteria: Axis1 explained 12.92% of the variation observed, Axis 2 explained 9.14% of the variation. (c) Fungi: Axis1 explained 34.58% of the variation observed, Axis 2 explained 16.72% of the variation. ADONIS tests further reveal that significant differences exist between two groups. (b) Bacteria: p = 1.00e-04. (d) Fungi: p = 1.00e-04
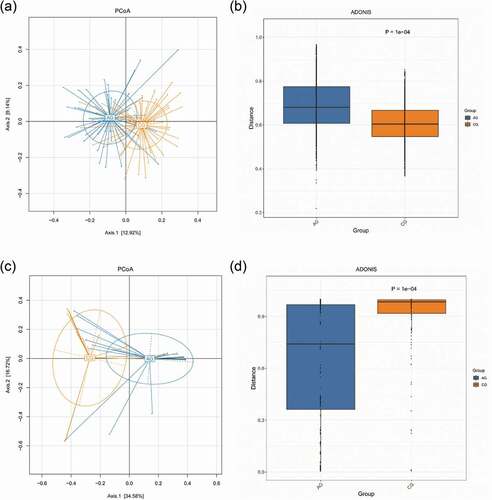
Figure 7. Biomarker analysis defined by LEfSe. Cladogram shows taxonomic representation of significant differences in relative abundance between the atrophic glossitis group and the control group. The significantly different taxa are signified by different color nodes between the atrophic glossitis group (red) and the control group (green). The diameter of the node is proportional to the relative abundance. The colored nodes from the inner to the outer circles represent taxa from the phylum to the genus level. Histogram of LDA scores show significant differences of abundant features among groups. (ab)Bacteria (cd) Fungi
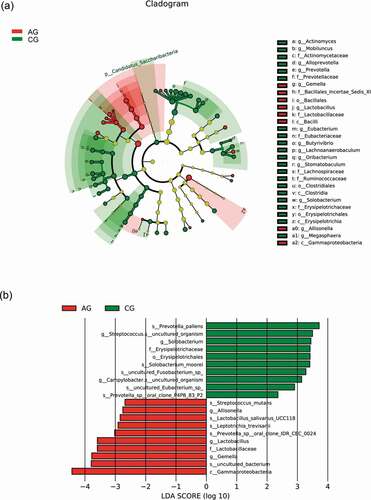
Figure 7. (continued)
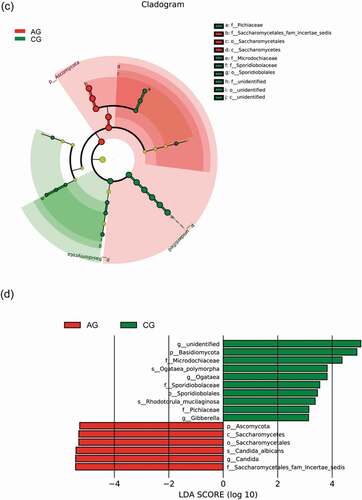
Figure 8. The correlation between the atrophic degree and oral microbiome with a box diagram at the genus level, showing the atrophic degree of some species between different groups and their relative abundance dispersion within the group. A1: slight group (n = 16); A2: moderate group (n = 21); A3:severe group (n = 13). Significantly different groups are indicated with asterisk*. (a) Bacteria (b) Fungi
Alpha and beta diversity analysis
An overview of biological alpha diversity indices calculated for the investigated atrophic glossitis and control groups are shown in (). We measured the Shannon indices and Chao1 indices of oral microbiome. The results from comparing samples of saliva were significantly different in terms of diversity between pair groups, with all samples collected from the atrophic glossitis group having slighter diversity than those from the control group, whether for bacteria (p-values = 0.001899; Shannon’s indices) or fungi (p-value = 0.010085; Shannon’s indices). However, we found no statistically significant difference in richness between the two groups, whether for bacteria or fungi (p-value >0.05; Chao1 indices).
Beta diversity was revealed in plots from PCoA showed the similarity between pairs of samples and the relationships of individual samples to each other in 2-dimensional space. ADONIS analysis found that there was statistical significant difference between the two groups, whether for bacteria or fungi (p-value = 1.00e-04) ().
The Cladograms of LEfSe representing the potential biomarkers of different groups (a,c). In the atrophic glossitis group, the most enriched bacteria were mainly g_Gemella, g_Lactobacillus and g_Allisonella at the genus level. The most enriched fungi was f__Saccharomycetales_fam_Incertae_sedis at the family level. In the control group, the most enriched bacteria were g_Actinomyces, g_Mobiluncus, g_Alloprevotella, g_Prevotella, g_Eubacterium, g_Butyrivibrio, g_Lachnoanaerobaculum, g_Oribacterium, g_Stomatobaculum, g_Solobacterium, and g_Megasphaera at the genus level. The most enriched fungi were f_Sporidiobolaceae and f_Pichiaceae at the family level.
Linear discriminant analysis (LDA) show significant differences abundant features represented by LDA score among groups . In the atrophic glossitis group, the significant bacterial differences were detected, with g_Gemella and g_Lactobacillus exhibited relatively higher abundances at genus level (LDA>2, p-value<0.05); The significant fungal differences were also detected, with f_Saccharomycetales_fam_Incertae_sedis exhibited relatively higher abundances at family level (LDA>2, p-value<0.05); with g_Candida exhibited relatively higher abundances at genus level (LDA>2, p-value<0.05). In the control group, the significant bacterial differences were detected, with g_Streptococcus.s_uncultured_organism exhibited relatively higher abundances (LDA>2, p-value<0.05). The significant fungal differences were also detected, with f_Sporidiobolacea and f_Pichiaceae exhibited relatively higher abundances at family level (LDA > 2, p-value<0.05); with g_Ogataea exhibited relatively higher abundances at genus level (LDA > 2, p-value<0.05).
Discussion
Atrophic glossitis has been a significant oral health issue in humans associated with several conditions, not directly attributable to mechanical damages of the mucosa, can occur in systemic or local conditions [Citation30]. With the ageing of the population, the elderly have increasingly suffered from atrophic glossitis in recent years. In previous studies, Candida albicans has been reported to have a higher prevalence in patients with atrophic glossitis, and it is essential in the initiation and progression of atrophic glossitis [Citation6–8,Citation31]. The oral cavity is home that hold one of the most complex microbial communities, comprising mainly bacteria, viruses, fungi, protozoa, archaea, phages and candidate phyla radiation (CPR), which has remained understudied, but several recent reports have illustrated that oral microbial diversity is important for oral health [Citation13,Citation32,Citation33]. The interactions and functions within a complex oral microbiome have become the focus of interest. Recent studies have analysed the oral microbial diversity in caries, periodontal disease, HIV, and irritable bowel syndrome and explored their relationship with the above diseases [Citation34–37]. Therefore, a comprehensive oral microbial study is needed. It is necessary to better understand the relationship between aetiology and diseases. However, an understanding about the relationship between shifts in the oral microbiota and atrophic glossitis pathogenesis are not fully cleared, as the microbial composition and diversity are still not fully known. Here, we searched for describing bacteria and fungi simultaneously in oral atrophic glossitis patients and health care of hosts, but found none in other study.
The diabetes and hypertension were significantly different between the atrophic glossitis group and control group (). A previous study showed that diabetic patients appeared an atrophic lesion of central tongue papillary, and there was a significant association with Candida [Citation38,Citation39]. It was generally acknowledged that patients with type I diabetes mellitus were more susceptible to fungal infections, particularly to Candida albicans [Citation40]. The study found that the presence of Candida pseudohyphae was related to elevated glycosylated hemoglobin; Hyperglycemia could contribute to the risk of Candida by increasing salivary glucose levels, which may promote overgrowth by Candida [Citation41]. However, other study found that the colonization of Candida have no significant difference between diabetic patients and healthy individuals, whether type I or II diabetic patients with atrophic glossitis were not related to Candida infection necessarily [Citation42]. Therefore, diabetes may also cause the occurrence or enhance the incidence of atrophic glossitis, but the view of resulting in changes of Candida is still controversial. In addition, about the relationship of hypertension and atrophic glossitis, there is a few research to study currently. One study found that some of patients with atrophic lesions who were taking hypotensive drugs have higher prevalence of central papillary atrophy [Citation38]. Thus, hypertension maybe confounded variables in our study.
Our study was a pilot report on salivary microbial diversity in atrophic glossitis patients and healthy individuals. In this study, bacteria were found more, but genera of fungi were few at genus level . We could see these species were clustered and a characteristic pattern for some of the species which assessed their relative abundance changes among groups (). The reason for this phenomenon was mainly the relative rareness of fungi (<0.1% of the microbiome, based on cfu); genetic material from fungi can be difficult to isolate, and many fungal species are uncultivable using current methods [Citation4]. However, bacteria are not the only factor causing changes in oral ecology; fungi is also important, which is consistent with significant proportions of the oral microbiota in recent years [Citation43]. Recently, bacterial-fungal ecological interactions have attracted researchers’ attention. Jonathon L. Baker. et al. suggested that fungi are numerically underrepresented, but the larger cell size of fungal species creates a structural ‘skeleton’ for fungal–bacterial multispecies biofilms. Fungal species stimulate the host immune system in a distinct manner with disparate immunological outcomes compared to those of their bacterial neighbours, which may cause systemic inflammatory disorder [Citation32,Citation44]. Atrophic glossitis has multiple causes, and it is generally accepted that the clinical symptoms of atrophic glossitis are a manifestation of chronic inflammation. Therefore, the interactions in bacterial-fungal multispecies biofilms may potentially affect the oral microbial ecology of atrophic glossitis patients.
Malassezia was almost absent from the atrophic glossitis group but was found in the control group . A recent study of the oral fungal mycobiome of saliva samples from 15 periodontal adults found a lower frequency (17%) of Malassezia species [Citation37]. Hajishengallis et al. suggested that specific low-abundance pathogens can be seen as ‘keystone pathogens’ that influence periodontal disease by altering the ‘healthy’ microflora into a disease state [Citation45]. Can low-abundance Malassezia influence the progression of atrophic glossitis? We need more research to understand this issue. However, in our previous study, Malassezia species were high-abundance fungi in the fevers among the elderly and it is an important genus of fungi that be worthy for attention [Citation46]. In addition, Dupuy et al. observed a high prevalence and abundance of the genus Malassezia from saliva, and include it to the core oral mycobiome; the role(s) that Malassezia species may play in oral health and disease, or in the dynamics of oral microbial communities, but remains to be determined [Citation47].At the same time, researchers have proposed that the variety of microbiomes should be better investigated based on age and these differences along with different diseases [Citation35]. Different oral diseases and age stages of patients may lead to differences in abundance and diversity in the same special oral microbiome. Perhaps this is the reason why few Malassezia species emerged in the atrophic glossitis group but it may have been the opposite for other oral diseases. Furthermore, the result of the high relative abundant fungal microbiome at the genus level in the control () were consistent with the results of a previous report: Candida, Saccharomycetales and Aspergillus were the most abundant, which isolated from 20 healthy participants [Citation10].
For a long time, acidogenic species of the genus Streptococcus have been considered the causative agent of dental caries which is highly active in caries progression [Citation48,Citation49]. In our study, we found that Streptococcus was the most abundant genus and its abundance was higher in the atrophic glossitis group than in the control group (), but there was no significant difference in its relative abundances between the two groups (). The result of LEfSe analysis was that g_Candida was the main genus in the atrophic glossitis group (). Jonathon L. Baker. et al. suggested that the capability of interspecies interactions between C. albicans and Streptococcus to exacerbate the severity of oral candidiasis, highlight the importance of interkingdom interactions in the pathogenesis of what are increasingly recognized as polymicrobial disease [Citation32]. Does it affect the progression of atrophic glossitis with the colonization C. albican? The interactions of C. albicans and Streptococcus could be as new idea to explore the pathogenesis of atrophic glossitis.
In our study, g_prevotella was the high relative abundance species in the atrophic glossitis and significant difference between two groups (, ). In many studies, Prevotella was a commonly observed member of the oral microbiome with considerable variation in its relative abundance [Citation20,Citation50]. It has been identified as a potential pathogen in the oral cavity, where it is associated with both carious lesions[Citation51] and periodontitis [Citation52,Citation53].The high Prevotella level could be related to local or systemic inflammatory disoders [Citation54]. Maybe it can cause inflammation of local tongue papilla of atrophic glossitis. However, a finding in our LEfSe analysis was that Prevotella was not the main genus in the atrophic glossitis group but in the control . It seems that there are no associations between Prevotella and atrophic glossitis. This may be attributed to the nonclinical nature of this study and the limatations of sample size.
In this study, based on the alpha diversity indices, the result demonstrated that the diversity of bacteria and fungi in atrophic glossitis patients was lower than that in healthy subjects . This could imply a higher degree of conformity of the microbial compositions along with physical health conditions, and mean that the oral ecology of the atrophic glossitis group may lead to a decrease in bacterial-fungal microbiome diversity. The inflammatory state of the oral mucosa may affect the changes in microorganisms in the atrophic glossitis group. Atrophic glossitis, an inflammatory disease, might influence bacterial-fungal composition and diversity. In contrast, the decrease in oral microbiome may change their diversity and cause inflammation in atrophic glossitis. Devine, D. A. et al. suggested that both inflammatory and anti-inflammatory responses may be induced in host tissues by members of the oral bacterial microbiota [Citation55]. All the above indicated that bacterial-fungal diversity had more complex and interconnected relationships with atrophic glossitis.
For bacteria, our work found that g_ Lactobacillus was the low relative abundance species at the genus in the atrophic glossitis (), but significant difference between two groups (). It was the main genus in the atrophic glossitis group . As we all know, Lactobacillus species were present at significantly higher levels in caries, and their acid-generating action caused the oral environment to form a low-pH state to play an important role in caries progression [Citation56]. Maybe, Lactobacillus could implicate atrophic glossitis development, too.
For fungi, Saccharomycetales_unidentified_1 was the high relative abundance species at the genus in the atrophic glossitis and significant difference between two groups (, ). The result showed that its relative abundance did not rise with the increasing of atrophic degree (). It seems that the increasing with the atrophic degree dose not promote overgrowth of Saccharomycetales_unidentified_1. However, the result showed that it was still the main genus in the atrophic glossitis group . Therefore, Saccharomycetales is a vital fungi for atrophic glossitis and may influence the progression of atrophic glossitis.
The results showed Eikenella have the correlation with the atrophic degree in atrophic glossitis patients (). According to our research, relative abundance of Eikenella is very low. This will remind us, whether the low-abundance species would cause changes of the atrophy degree. As we mentioned above, some low-abundance species can be influence the progress of disease.
Above all, the data displayed the community structure and diversity of the oral microbiome in all subjects. Our work showed that Lactobacillus and Saccharomycetales were the most potent oral microbial genera and were correlated with atrophic glossitis. However, we do not have enough evidence to indicate that the initiation or progression of atrophic glossitis related to these species. We also cannot completely attribute these pathological phenomena of atrophic glossitis to changes of the specific oral microbiome. On the one hand, few studies of the oral microbiome with atrophic glossitis have been reported. On the other hand, the small sample size may limit our power to detect identified oral microbial species involved with atrophic glossitis. Furthermore, other possible reasons may have influenced the results, including different incidences of atrophic glossitis in different regions and ethnicities, and differences in methodology (i.e. DNA extraction and sequencing technology). In addition, our research makes us speculate that changes occurring in the host may disrupt the harmonious balance with the oral microbiome and that changes in the oral microbiome may also influence disease progression as a risk factor. If we perturb the balance of the oral microbiome, it will result in disease. An unbalanced oral microbiome may be detrimental to general health. Maintaining a healthy oral ecological community is essential to health, and understanding how the host interacts with the oral microbiome has a profound meaning [Citation57, Citation58]. The relationship between overall health and the balance of the cohabiting groups of common predominant oral microbial genera is a topic that requires further investigation [58]. It is important to note that the relationship with the oral microbiome should be evaluated deeply, and studies of greater scale are necessary before any firm conclusions can be drawn.
Conclusion
This study focused on the salivary microbiome and was based on analysing the composition and diversity of bacteria and fungi in atrophic glossitis patients and healthy individuals, revealing the complex and interconnected relationships of the bacterial-fungal community in the oral cavity. It identified the predominant bacterial and fungal genera related to atrophic glossitis. In addition, more bacterial-fungal species are needed to investigate atrophic glossitis, and the relationship between the oral microbiome and health status should be taken into consideration. This study was expected to provide a clue for bacterial-fungal characterization in atrophic glossitis and attract more attention to the correlations of the oral microbiome and health status.
Acknowledgments
This work was supported by grants from the State Key Laboratory of oral Diseases (No.SKLOD2018OF05), the Research Project Supported by Shanxi Scholarship Council of China (No.2015-107).
Disclosure statement
The authors have no conflict of interest to report.
Correction Statement
This article has been republished with minor changes. These changes do not impact the academic content of the article.
Additional information
Funding
References
- Pastore L, Carroccio A, Compilato D, et al. Oral manifestations of celiac disease. J Clin Gastroenterol. 2008;42(3):224–17.
- Reamy BV, Derby R, Bunt CW. Common tongue conditions in primary care. Am Fam Physician. 2010;81(5):627–634.
- Sun A, Lin HP, Wang YP, et al. Significant association of deficiency of hemoglobin, iron and vitamin B12, high homocysteine level, and gastric parietal cell antibody positivity with atrophic glossitis. J Oral Pathol Med. 2012;41(6):500–504.
- Ellepola AN, Samaranayake LP. Oral candidal infections and antimycotics. Crit Rev Oral Biol Med. 2000;11(2):172–198.
- Kurnatowska AJ. Search for correlation between symptoms and signs of changes in the oral mucosa and presence of fungi. Mycoses. 2001;44(9–10):379–382.
- Terai H, Shimahara M. Atrophic tongue associated with Candida. J Oral Pathol Med. 2005;34(7):397–400.
- Janus MM, Crielaard W, Volgenant CM, et al. Candida albicans alters the bacterial microbiome of early in vitro oral biofilms. J Oral Microbiol. 2017;9(1):1270613.
- Terai H, Shimahara M. Partial atrophic tongue other than median rhomboid glossitis. Clin Exp Dermatol. 2007;32(4):381–384.
- Dewhirst FE, Chen T, Izard J, et al. The human oral microbiome. J Bacteriol. 2010;192(19):5002–5017.
- Ghannoum MA, Jurevic RJ, Mukherjee PK, et al. Characterization of the oral fungal microbiome (mycobiome) in healthy individuals. PLoS Pathog. 2010;6(1):e1000713.
- Paster BJ, Boches SK, Galvin JL, et al. Bacterial diversity in human subgingival plaque. J Bacteriol. 2001;183(12):3770–3783.
- Paster BJ, Olsen I, Aas JA, et al. The breadth of bacterial diversity in the human periodontal pocket and other oral sites. Periodontol 2000. 2006;42(1):80–87.
- Siqueira JF Jr., Rocas IN. The oral microbiota in health and disease: An overview of molecular findings. Methods Mol Biol. 2017;1537:127–138.
- Bikel S, Valdez-Lara A, Cornejo-Granados F, et al. Combining metagenomics, metatranscriptomics and viromics to explore novel microbial interactions: towards a systems-level understanding of human microbiome. Comput Struct Biotechnol J. 2015;13:390–401.
- Siqueira JF Jr., Rocas IN. As-yet-uncultivated oral bacteria: breadth and association with oral and extra-oral diseases. J Oral Microbiol. 2013;5(1):21077.
- Socransky SS, Gibbons RJ, Dale AC, et al. The microbiota of the gingival crevice area of man. I. total microscopic and viable counts and counts of specific organisms. Arch Oral Biol. 1963;8(3):275–280.
- Moon JH, Lee JH. Probing the diversity of healthy oral microbiome with bioinformatics approaches. BMB Rep. 2016;49(12):662–670.
- Verma D, Garg PK, Dubey AK. Insights into the human oral microbiome. Arch Microbiol. 2018;200(4):525–540.
- Human Microbiome Project, C. Structure, function and diversity of the healthy human microbiome. Nature. 2012;486(7402): 207–214.
- Zhou Y, Gao H, Mihindukulasuriya KA, et al. Biogeography of the ecosystems of the healthy human body. Genome Biol. 2013;14(1):R1.
- Zaura E, Brandt BW, de Mattos T, et al. Same exposure but two radically different responses to antibiotics: resilience of the salivary microbiome versus long-term microbial shifts in feces. mBio. 2015;6(6):e01693–01615.
- Yang B, Wang Y, Qian PY. Sensitivity and correlation of hypervariable regions in 16S rRNA genes in phylogenetic analysis. BMC Bioinformatics. 2016;17(1):135.
- Borman AM, Linton CJ, Miles SJ, et al. Molecular identification of pathogenic fungi. J Antimicrob Chemother. 2008;61(Suppl 1):i7–12.
- Landlinger C, Baskova L, Preuner S, et al. Identification of fungal species by fragment length analysis of the internally transcribed spacer 2 region. Eur J Clin Microbiol Infect Dis. 2009;28(6):613–622.
- Magoc T, Salzberg SL. FLASH: fast length adjustment of short reads to improve genome assemblies. Bioinformatics. 2011;27(21):2957–2963.
- Jami E, Israel A, Kotser A, et al. Exploring the bovine rumen bacterial community from birth to adulthood. ISME J. 2013;7(6):1069–1079.
- Walker AR, Datta S. Identification of city specific important bacterial signature for the MetaSUB CAMDA challenge microbiome data. Biol Direct. 2019;14(1):11.
- Chan AA, Bashir M, Rivas MN, et al. Characterization of the microbiome of nipple aspirate fluid of breast cancer survivors. Sci Rep. 2016;6(1). DOI:https://doi.org/10.1038/srep28061
- Zhang C, Li S, Yang L, et al. Structural modulation of gut microbiota in life-long calorie-restricted mice. Nat Commun. 2013;4(1):2163.
- Chiang C-P, Chang JY-F, Wang Y-P, et al. Atrophic glossitis: Etiology, serum autoantibodies, anemia, hematinic deficiencies, hyperhomocysteinemia, and management. J Formosan Med Assoc. 2020;119(4):774–780.
- Nakamura S, Okamoto MR, Yamamoto K, et al. The Candida species that are important for the development of atrophic glossitis in xerostomia patients. BMC Oral Health. 2017;17(1):153.
- Baker JL, Bor B, Agnello M, et al. Ecology of the oral microbiome: beyond bacteria. Trends Microbiol. 2017;25(5):362–374.
- Benn A, Heng N, Broadbent JM, et al. Studying the human oral microbiome: challenges and the evolution of solutions. Aust Dent J. 2018;63(1):14–24.
- Fourie NH, Wang D, Abey SK, et al. The microbiome of the oral mucosa in irritable bowel syndrome. Gut Microbes. 2016;7(4):286–301.
- Jiang Q, Liu J, Chen L, et al. The oral microbiome in the elderly with dental caries and health. Front Cell Infect Microbiol. 2018;8:442.
- Mukherjee PK, Chandra J, Retuerto M, et al. Oral mycobiome analysis of HIV-infected patients: identification of Pichia as an antagonist of opportunistic fungi. PLoS Pathog. 2014;10(3):e1003996.
- Peters BA, Wu J, Hayes RB, et al. The oral fungal mycobiome: characteristics and relation to periodontitis in a pilot study. BMC Microbiol. 2017;17(1):157.
- Farman AG. Atrophic lesions of the tongue: a prevalence study among 175 diabetic patients. J Oral Pathol. 1976;5(5):255–264.
- Goregen M, Miloglu O, Buyukkurt MC, et al. Median rhomboid glossitis: a clinical and microbiological study. Eur J Dent. 2011;5(4):367–372.
- Erriu M, Pili FM, Cadoni S, et al. Diagnosis of lingual atrophic conditions: associations with local and systemic factors. A descriptive review. Open Dent J. 2016;10(1):619–635.
- Guggenheimer J, Moore PA, Rossie K, et al. Insulin-dependent diabetes mellitus and oral soft tissue pathologies: II. Prevalence and characteristics of Candida and Candidal lesions. Oral Surg Oral Med Oral Pathol Oral Radiol Endod. 2000;89(5):570–576.
- Bremenkamp RM, Caris AR, Jorge AO, et al. Prevalence and antifungal resistance profile of Candida spp. oral isolates from patients with type 1 and 2 diabetes mellitus. Arch Oral Biol. 2011;56(6):549–555.
- Seed PC. The human mycobiome. Cold Spring Harb Perspect Med. 2014;5(5):a019810.
- Cui L, Morris A, Ghedin E. The human mycobiome in health and disease. Genome Med. 2013;5(7):63.
- Hajishengallis G, Darveau RP, Curtis MA. The keystone-pathogen hypothesis. Nat Rev Microbiol. 2012;10(10):717–725.
- Li H, Takeshita T, Furuta M, et al. Molecular characterization of fungal populations on the tongue dorsum of institutionalized elderly adults. Oral Dis. 2012;18(8):771–777.
- Dupuy AK, David MS, Li L, et al. Redefining the human oral mycobiome with improved practices in amplicon-based taxonomy: discovery of Malassezia as a prominent commensal. PLoS One. 2014;9(3):e90899.
- Krishnan K, Chen T, Paster BJ. A practical guide to the oral microbiome and its relation to health and disease. Oral Dis. 2017;23(3):276–286.
- Solbiati J, Frias-Lopez J. Metatranscriptome of the oral microbiome in health and disease. J Dent Res. 2018;97(5):492–500.
- Schwarzberg K, Le R, Bharti B, et al. The personal human oral microbiome obscures the effects of treatment on periodontal disease. PLoS One. 2014;9(1):e86708.
- Yang F, Zeng X, Ning K, et al. Saliva microbiomes distinguish caries-active from healthy human populations. ISME J. 2012;6(1):1–10.
- Faveri M, Mayer MP, Feres M, et al. Microbiological diversity of generalized aggressive periodontitis by 16S rRNA clonal analysis. Oral Microbiol Immunol. 2008;23(2):112–118.
- Suzuki N, Yoneda M, Hirofuji T. Mixed red-complex bacterial infection in periodontitis. Int J Dent. 2013;(2013:587279.
- Ozga AT, Sankaranarayanan K, Tito RY, et al. Oral microbiome diversity among Cheyenne and Arapaho individuals from Oklahoma. Am J Phys Anthropol. 2016;161(2):321–327.
- Devine DA, Marsh PD, Meade J. Modulation of host responses by oral commensal bacteria. J Oral Microbiol. 2015;7(1):26941.
- Kilian M, Chapple IL, Hannig M, et al. The oral microbiome - an update for oral healthcare professionals. Br Dent J. 2016;221(10):657–666.
- Kilian M. The oral microbiome - friend or foe? Eur J Oral Sci. 2018;126(Suppl 1):5–12.
- Yamashita Y, Takeshita T. The oral microbiome and human health. J Oral Sci. 2017;59(2):201–206.