
 ?Mathematical formulae have been encoded as MathML and are displayed in this HTML version using MathJax in order to improve their display. Uncheck the box to turn MathJax off. This feature requires Javascript. Click on a formula to zoom.
ABSTRACT
The initial microprocess of a major cariogenic bacterium Streptococcus mutans forming biofilm at a single-cell level via sucrose-dependent adhesion has not been observed because the cells’ high moisture content caused measurement challenges.
To develop a high-sensitivity biosensor chip and a real-time, label-free method to observe bioactive molecule interactions with single cells from oral biofilms.
We made the chips of immobilized bacteria by micronano-processing. A surface plasmon resonance imaging (SPRI) system was used to detect and record the association and dissociation microprocess of S. mutans with sucrose/dextran solutions of various concentrations, and the calculus model was adopted to treat the data.
At the location of S. mutans, a unique ‘comet-tail’ SPRI signal was observed. The binding patterns of S. mutans differed between individual cells exposed to the same solution as well as between sucrose and dextran. The different cells exhibited different affinities with dissociation constants for sucrose being 5.697 × 10⁻³ to 3.689 M and for dextran 1.235 × 10⁻³ to 1.282 M, indicating cell-to-cell heterogeneity.
Our SPRI detection method is effective in investigating microbial binding, initial biofilm formation, and oral microecology. It offers new possibilities for studying oral microorganism characteristics and development of oral diseases.
Introduction
Dental caries is the most common oral disease caused by dental plaque biofilm [Citation1]. Streptococcus mutans is a major cariogenic bacterium that colonizes the tooth surface via sucrose-dependent and sucrose-independent adhesion [Citation2,Citation3]. Sucrose is an essential source of extracellular polysaccharides in cariogenic dental plaque biofilm [Citation4]. The mechanism of sucrose-dependent adhesion in Mutans streptococci, including S. mutans, involves several glucan-binding proteins, comprising glucosyltransferases (GTFs) and non-enzymatic glucan-binding proteins (GBPs) [Citation5]. With the help of these proteins, S. mutans affects bacterial aggregation, adhesion, and extracellular matrix production to influence dental plaque biofilm formation/structure and cariogenicity [Citation6–9]. Therefore, continuous observation of sucrose-dependent adhesion and initial biofilm formation by S. mutans is essential in studying dental plaque biofilms and pathogenicity.
Biofilm is an aggregate of microorganisms and extracellular matrix adhering to living or non-living surfaces [Citation10]. It is widely present on biotic and abiotic surfaces in natural, industrial, and medical environments [Citation11,Citation12]. Biofilm formation can be divided into five stages: reversible adhesion, irreversible adhesion, microcolony formation, biofilm maturity, and dissemination [Citation13,Citation14]. The transition from weak and reversible to irreversible bacteria-surface adhesion involves complex physical, chemical, and biological processes [Citation15,Citation16], starting with the adhesion of individual cells, which is critical for biofilm formation, but remains poorly understood [Citation17].
Chemical, microscopic, and biological methods have been developed to study bacterial adhesion [Citation18], but most approaches are based on bulk cell analysis. The heterogeneity of individual bacterial cells has not been considered, nor have the microprocesses that drive initial cell adhesion been measured. Methods such as atomic force microscopy and Optical tweezers are currently available to study bacterial adhesion at the single-cell level [Citation19–22]. However, they measure one cell at a time, with limited throughput. Moreover, exerting external forces on cells, they interfere with the adhesion performance [Citation23]. Unlike such conventional optical methods as infrared spectroscopy and fluorescence assay, surface plasmon resonance imaging (SPRI) operates with stable optical signals, low biological toxicity, and high interference resistance. SPRI is designed to study the life phenomenon of single cells by using a micro-nano processed chip and microfluidic technology, and the calculus model ensures that the data obtained are of single-cell level [Citation24]. Conventional SPR has been employed to detect Escherichia coli and methicillin-resistant Staphylococcus aureus via the interactions of bacteriophage elements with bacterial cells [Citation25], and SPRI employed to study the interactions of individual E. coli cells with antibodies and to analyze the bacterial heterogeneity of these interactions [Citation26]. However, SPRI has not been reported in the study of sucrose-dependent adhesion of S. mutans at the level of individual cells.
In this study, we used SPRI to analyze the binding microprocesses of S. mutans to sucrose and dextran at the single-cell level. We sought to further understand the sucrose-dependent adhesion of S. mutans and the variability among individual cells from the same strain of bacteria. These results provide a crucial foundation for the further study of oral microorganisms and their activity, the biochemical features and formation of dental plaque biofilm, the occurrence and development of dental caries, and oral microecology.
Materials and methods
Materials
Experimental materials
The S. mutans type strain UA159 was from the State Key Laboratory of Oral Diseases, Sichuan University, China. Brain heart infusion broth, poly-L-lysine (PLL) solution, and bovine serum albumin (BSA) were purchased from Solarbio, Beijing, China, sucrose from Sinopharm (Beijing, China), dextran T2000 from BioLanxu, Hefei, China, acetone and anhydrous ethanol from Chongqing Chuandong Chemical Co. Ltd. (Chongqing, China). Sucrose and dextran were diluted with phosphate-buffered solution (PBS) for later use to the desired concentrations (For more details, see Section 2.2.2).
Instruments
Based on the Kretschmann-Raether configuration [Citation27], the SPRI system consists of an inverted microscope (Nikon Ti-E, Japan) equipped with a 60 x oil immersion objective with a high numerical aperture (1.49). The sensor chip was a 22 × 22 mm coverslip coated with 2-nm chromium and 47-nm gold. Oil with a matching refractive index was applied between the sensor chip and the objective lens. A 680-nm super-luminescent diode (Qphotonics, Ann Arbor, MI) was used to excite SPR, and images were recorded using a charge-coupled device (CCD) camera (Pike-032B, Allied Vision Technologies, Germany). A microchannel (12 × 2 × 1 mm) of polydimethylsiloxane attached to the chip surface allowed the buffer and sample solution to flow across the chip surface. A syringe pump (LSP01, Longer, Baoding, China) was used to deliver the sample solution to the chip surface at 200 μL/min.
Experimental methods
Bacterial culture
Lyophilized S. mutans cells were activated anaerobically in brain heart infusion broth for 6 h (37°C, 85% N2, 10% H2, 5% CO2) and collected by centrifugation at 3,500 g for 15 min at 25°C. The supernatant was discarded, and the cells were washed with phosphate-buffered solution (PBS) three times and then resuspended in PBS at 1 × 10⁶ colony-forming unit (CFU) mL−1.
Bacterial immobilization and binding
The gold chip was ultrasonically cleaned sequentially with acetone, absolute ethanol, and deionized water for 10 min each, rinsed three times with deionized water, and dried with nitrogen gas. Then the chip surface was immersed in 100 μg/mL PLL solution for 24 h, rinsed with ultrapure water, and dried under nitrogen. The microchannel was attached to the chip surface, and the bacterial broth was then added and allowed to stand for 1–2 h. The bacterial cells settled to the chip surface, where they were adsorbed by L-lysine. Free cells were removed by rinsing with PBS, and the chip surface was blocked by perfusion with a 5 mg/mL BSA solution on the gold chip surface, followed by incubation for 1 h. PBS was then applied to the chip surface at 200 μL/min, followed by sucrose or dextran T2000 solutions of various concentrations – 0.1, 0.5, 1.0, and 2.0 mg L−1 for sucrose, and 0.01, 0.02, and 0.1 mg L−1 for dextran T2000 – at the same flow rate. The association of S. mutans was then observed in real time. For dissociation, PBS was delivered to the chip surface at the same flow rate. For sucrose, the operations of the association stage lasted 200 s, and the operations of dissociation lasted 90s. For dextran T2000 the time was 280 s and 180 s, respectively. The process of dissociation was observed after the association process reached equilibrium. The procedures described above were performed on different chips, and each chip with bacteria was used only once to eliminate possible residual interference. The experiment was performed 4–6 times for each concentration.
Image and data processing methods
Theories and models of image data processing
The interaction between individual cells and attachment surface can be regarded as physisorption/chemisorption of binding of ligand B to receptor A [Citation28]. Assuming that the force field is uniform on the binding surface, receptor A and ligand B bind to the monolayer, the binding can be described by Equation (1):
The equation for the production rate of complex AB is
When bacteria adhere to a surface, the binding causes interfacial energy and mass change, and vibration on the surfaces [Citation16,Citation29]. Such a binding signal can be captured by an SPR sensor chip. In this study, we regarded S. mutans as receptor A and sucrose/dextran as ligand B. The concentration (CAB) of complex AB at time t is represented by response R, which is Rmax when the sensor chip surface is saturated with ligand B. According to Equation (1), the maximum concentration of complex AB formed on the sensor chip surface is Rmax, and the concentration of A on the sensor chip surface (CA) is Rmax − R. The concentration of ligand B is c, which is continuously injected by a terufusion syringe pump. The net rate of complex AB production can be expressed as
where ka is the association rate constant and kd is the dissociation rate constant. The initial time of complex AB formation is taken as the starting time (t0 = 0), and the baseline response value is set at zero (R0 = 0). Equation (3) can be integrated to obtain the SPR response R at time t:
where .
is replaced by Req (response at equilibrium), and Equation (4) is rearranged to
When the binding reaches equilibrium, the association rate equals the dissociation rate, and the SPR response R remains constant over time..
which is rearranged to . The dissociation constant is defined as
For the dissociation of complex AB, we assumed that receptor A does not detach from the surface and float into the liquid phase, and therefore its concentration (Rmax − R) is zero, and Equation (3) is simplified to
The integral form is
where t1 is the starting time of dissociation or the time of SPR response at equilibrium (Req), and R is SPR response at t2 (t2 > t1). According to the data obtained by real-time monitoring with SPRI and Equations (5), (9), and (7), the kinetic parameters ka,kd, and KD can be obtained.
Image acquisition and data processing
SPR images were acquired through a CCD camera at 6.06 frames per s and analyzed using the image processing software ‘Fiji’, which is based on ImageJ, to obtain the light intensity of the regions of interest (ROI) on the chip surface. During the experiment, the size of ROI was fixed at 10 pixel × 20 pixel and remained the same throughout the experiment. The single-frame image of the first PBS application was considered as negative control, and used as the reference signal. Meanwhile, the light intensity of the cell-free region (background) was used as blank control. The principle of the selection of ROI was based on published research. Within the signal region generated by the fixed bacteria, the selected ROI was located in the region with the most even distribution of SPRI intensity within the ‘comet tail’ shape caused by bacteria, and ROI of the same size was selected from the background area. Then the data were treated with the calculus model method that defined the time and space differential elements, and the data of the control groups were subtracted before the association kinetic analysis was performed [Citation30,Citation31]. By fitting the SPRI real-time detection signal of a single bacterium, the kinetic parameters ka,kd, and KD were calculated with formulas (5), (9) and (7) in section 2.3.1. The fitting curve of the bacterial SPRI detection signal was obtained with the Origin 9.0 software (OriginLab Corporation, Northampton, MA).
Results
SPRI of S. mutans
SPRI is the SPR microimaging method (SPR microscopy), which sends a parallel single wavelength beam at a certain angle on a micro-nano metal chip containing a sample of bacteria to be tested, and receives fully reflected light on the other side of the prism (). By monitoring the characteristic parameters of the reflected light, the properties of the chip’s metal film and samples and the interaction between them are characterized. In this study, the association and dissociation of S. mutans with sucrose and dextran altered the mass on the chip surface, as well as the refractive index and reflected light intensity at the bacterial location. The images and changes in light intensity were collected with the CCD camera to determine the association and dissociation of individual S. mutans and the intrinsic properties of S. mutans adhesion.
Figure 1. (a) Schematic of a surface plasmon resonance imaging device. (b) An optical bright-field image of S. mutans cells immobilized on a chip. (c) The ‘comet tail’ shaped patterns of time-differential plasmonic images corresponding to the same bacterial cells as in (b). The red box indicates the signal area, and the yellow box indicates the cell-free region.
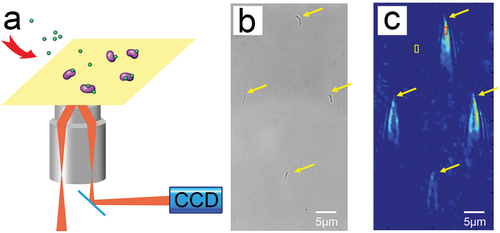
The incident light angle was adjusted prior to each experiment to maximize the contrast of the captured image and was fixed throughout the experiment. S. mutans cells were immobilized on the chip surface via PLL, free cells were washed away with PBS, and the chip surface was blocked with a 5 mg/mL BSA solution to avoid non-specific binding. Each S. mutans cell immobilized on the chip surface forms a unique ‘comet tail’ shape in SPR images () which corresponds to the position of the bacteria in the bright-field image (). This tail shape is generated by the plasmon waves scattered by the bacteria immobilized on the chip surface when SPRI is performed and is not intrinsic to S. mutans [Citation32]. This unique shape enables bacterial cells to be distinguished from the interference patterns and other spatial background noises generated by the device. The ‘comet tails’ of the bacteria recorded by SPRI fluctuated when PBS flowed through the chip surface before association (). For plasmonic image processing, the first frame of PBS flowing across the chip was used as the reference signal, which was subtracted to obtain images showing signal changes over time. From these plasmonic images, often referred to as time-differential images, information regarding binding kinetics can be extracted.
Association and dissociation of individual S. mutans cells
The chip containing immobilized S. mutans was placed on the SPRI device to investigate the binding of sucrose and dextran to individual S. mutans cells, including the entire process of association and dissociation. To observe the association process, PBS was allowed to flow across the chip surface, followed by solutions with different concentrations of sucrose/dextran at the same rate until the association reached equilibrium. Then, PBS was again allowed to flow across the chip surface to observe the dissociation of individual bacteria with sucrose/dextran. Representative images of the entire process of sucrose association and dissociation by S. mutans are shown in . The position of S. mutans () is visualized by the ‘comet tail’ signal generated with SPRI (). When the sucrose solution was applied across the chip surface, the light intensity of the ‘comet tail’ gradually increased (), indicating an increase in association of sucrose with the individual bacteria. Additionally, these changes in light intensity differed between cells, of which the specific values of the change of light intensity (Δ SPRI intensity) was obtained by image processing software. As the four representing light intensity change curves show in , the light intensity variation curves are different, suggesting cell-to-cell variability in sucrose association. When PBS was applied to rinse the sucrose solution, the light intensity of the ‘comet tail’ gradually decreased (), indicating dissociation of sucrose from the individual bacteria cells.
Figure 2. Time-differential plasmonic images of the binding process of two S. mutans cells to 1.0 mg/L sucrose. (a) A representative bright-field image. (b) The background image of S. mutans with the flow of PBS corresponding to the same cells as in (a). Time-differential plasmonic images captured during the association process at an earlier (c) and later (d) time point. Time-differential plasmonic images captured during the dissociation process at an earlier (e) and later (f) time point.
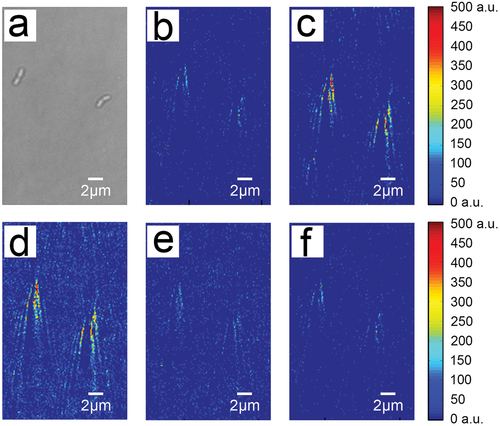
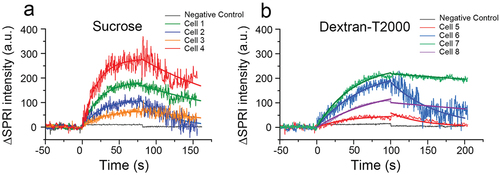
Figure 3. Sensorgrams of single bacterial cells exposed to 0.1 mg/mL sucrose (a) and 0.02 mg/L dextran (b) solutions, and the fitting curves of the bacterial SPRI signals according to formulas (5) and (9) in .Section 2.3.1
Kinetics of sucrose and dextran binding to S. mutans
We then generated sensorgrams to visualize changes in light intensity throughout the sucrose association and dissociation process, and found a clear trend of sucrose/dextran association and dissociation with S. mutans, confirming that SPRI is sensitive enough to detect these microprocesses. Interestingly, the binding patterns differed between individual cells exposed to the same solution as well as between the two substances. The equilibrium of sucrose binding was achieved in a shorter period of time, although the signal fluctuation was more obvious than that of dextran T2000. These variations in signal fluctuation correspond to differences in the strength of association at the microscopic level.
To characterize the unique binding responses in individual S. mutans cells, we developed mathematical models to obtain the association rate constant (ka), dissociation rate constant (kd), and dissociation constant (KD) of each cell. The kinetic constants of sucrose and dextran varied among individual cells from the same S. mutans strain, with some cells differing by an entire order of magnitude in KD, showing different strengths of binding and microscopic stability (). Overall, S. mutans demonstrated a lower dissociation constant for dextran T2000 than for sucrose. This is consistent with the patterns observed in the sensorgrams (): the greater the dissociation, the greater the fluctuations. This heterogeneity in binding kinetics among individual bacteria cells is consistent with reports of specific and non-specific binding of E. coli to antibodies [Citation26,Citation33].
Table 1. Kinetics of individual S. mutans cells
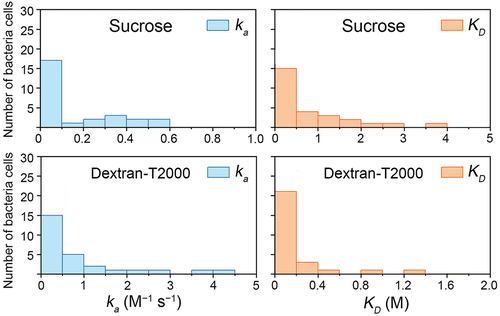
To further understand this heterogeneity, we calculated the ka and KD in a greater number of individual S. mutans cells (). The ka and KD of S. mutans with sucrose and dextran exposure varied greatly among individual cells, suggesting there is natural phenotypic diversity of individual cells in a bacterial population. Most of the KD of sucrose were lower than 1.5 M, and the overwhelming majority KD of dextran were lower than 0.4 M, indicating that homologous strains may also share common characteristics.
Figure 4. Distribution of the association rate constant (ka) and dissociation constant (KD) for individual bacteria cells (n = 27).
Discussion
In this study, we observed the whole process of association and dissociation of S. mutans with sucrose and dextran T2000 at the single-cell level. When PBS flowed through the chip surface before association, the ‘comet tail’ of bacteria recorded by SPRI fluctuated with time partly because association of bacteria with PLL is dominated by electrostatic force and is reversible [Citation34]. Even if there is no association and dissociation with external substances, basic metabolic activities and nanomotions can still be observed with SPRI, as was the case in studying the biomacromolecular interactions and biochemical analyses [Citation35], including DNA-DNA/RNA, DNA-protein, and protein-sugar interactions [Citation36,Citation37].
Methodologically speaking, the SPRI optical path observes the mass change on the chip surface in the thickness of 0–300 nm, a range too small to be sensitive to the whole process of bacteria swallowing other molecules into themselves and metabolizing. In addition, the time taken to reach the equilibrium state was very short (within 200 s), and the metabolism and matrix synthesis processes related to sucrose/dextran would only take place after the recognition of the molecule, that is, after the microprocess of binding and recognition. Therefore, it seems that uptake and metabolism could not be completed below 200 s in Gram-positive bacteria with thick cell walls. In addition, basic metabolic activities that are not related to sucrose/dextran are presented in the negative control. In this case, the data of SPRI mainly represented the microprocess of S. mutans binding with sucrose/dextran, rather than the metabolism.
Changes in light intensity corresponding to binding differed with exposure to different substances. Sucrose has a shorter binding equilibrium time and a greater fluctuation (). The sensorgrams showed that the association of dextran with S. mutans was stronger than that of sucrose at the microscopic level. This is perhaps because sucrose has a smaller molecular weight, while dextran T2000 contains more glucose repeat units with more association sites and thus has a tighter association with glucan-binding proteins (GBPs) and a longer binding equilibrium time. This mirrors the structural and biochemical characteristics of GBPs on the surface of mutans streptococci including S. mutans [Citation38]. The mechanism of sucrose-dependent adhesion is of great significance in the process of dental plaque biofilm formation. This process involves several glucan-binding proteins, including GTFs and non-enzymatic GBPs. GTFs synthesize glucans from sucrose, and free GTFs can attach to the acquired salivary pellicle on the enamel surface to synthesize glucans in situ, providing binding sites for a variety of microorganisms. GTFs can also bind to other oral microorganisms to convert them into glucan producers, facilitating their colonization of biofilm. GBPs can affect adhesion strength and biofilm structure and confer a colonization advantage in the presence of sucrose [Citation2,Citation39,Citation40]. As previous studies have shown, the different bacteria strains express these proteins at different levels, while the adhesion force of S. mutans were consistent with the severity of caries in vivo [Citation41].
Differing from cell to cell, the dissociation constants of S. mutans of sucrose and dextran that we obtained were in the range of 5.697 × 10⁻³–3.689 M and 1.235 × 10⁻³–1.282 M respectively. The sensitivity of the SPRI technique to different substances is a good indication of its potential application in any bacteria that form biofilms. The unique responses we observed among individual cells may result from differences in the expression levels of GTFs and non-enzymatic GBPs on the surface of S. mutans cells, or differences in the growth stages and the biochemical metabolic activities of individual bacteria. Regardless of the cause, these differences suggest the existence of intrinsic heterogeneity and phenotypic variability among individual cells in a bacterial population.
Conclusions
SPRI was used to study the binding kinetics of individual S. mutans cells to sucrose and dextran during sucrose-dependent adhesion. The results showed that SPRI can be used to monitor the kinetics of biological macromolecules at the single-cell level. The dissociation constants of S. mutans of sucrose and dextran were in the range of 5.697 × 10⁻³–3.689 M and 1.235 × 10⁻³–1.282 M, respectively. Our results revealed varied interactions of individual cells from a bacterial strain with a specific substance. This cell-to-cell variability provides a new perspective for understanding the formation of dental plaque biofilm and the prevalence of caries among individual patients. SPRI would be useful in investigations studying microbial binding within the oral cavity, biofilm formation in the human body, and oral micro-ecology. Our findings offer new possibilities for studying the occurrence and development of diseases, as well as the development of new therapies.
Author contribution statement
Yuhao Guo contributed to conception, design, data acquisition and interpretation, drafted and critically revised the manuscript; Bo Li contributed to conception, design, interpretation and critically revised the manuscript; Tengfei Ma contributed to conception, design, data acquisition, analysis, interpretation and drafted the manuscript; Emily R. Moore contributed to conception, data interpretation and critically revised the manuscript; Huixu Xie contributed to conception, design and critically revised the manuscript; Chenzhou Wu contributed to conception, design and critically revised the manuscript; Longjiang Li contributed to conception, design, data acquisition, interpretation, drafted and critically revised the manuscript. All authors have given final approval and agreed to be accountable for all aspects of the work.
Conflict declaration
The authors declare no conflict of interest.
Acknowledgments
We would like to thank Cao Lideng, Yan Yujia, and Hu Liru for their collaboration and help with bacterial culture. We are grateful to the State Key Laboratory of Stomatology of the Sichuan University for bacteria culture conditions and experiments and the Public Experimental Center of the National Bioindustry Base (Chongqing) for use of their SPRI instruments and assistance with the measurements.
Disclosure statement
No potential conflict of interest was reported by the author(s).
Additional information
Funding
References
- Pitts NB, Zero DT, Marsh PD, et al. Dental caries. Nat Rev Dis Primers. 2017;3(1):17030.
- Bowen WH, and Koo H. Biology of Streptococcus mutans-derived glucosyltransferases: role in extracellular matrix formation of cariogenic biofilms. Caries Res. 2011;45(1):69–9.
- Loesche WJ. Role of Streptococcus-mutans in human dental decay. Microbiol Rev. 1986;50(4):353–380.
- Lemos JA, Palmer SR, and Zeng L, et al. The biology of Streptococcus mutans. Microbiol Spectr. 2019;7(1). DOI:10.1128/microbiolspec.GPP3-0051-2018
- Banas JA. Virulence properties of Streptococcus mutans. Front Biosci. 2004;9(1–3):1267–1277.
- Bowen WH, Burne RA, Wu H, et al. Oral biofilms: pathogens, matrix, and polymicrobial interactions in microenvironments. Trends Microbiol. 2018;26(3):229–242.
- Klein MI, Hwang G, and Santos PH, et al. Streptococcus mutans-derived extracellular matrix in cariogenic oral biofilms. Front Cell Infect Microbiol. 2015;5:10.
- Lamont RJ, Koo H, Hajishengallis G. The oral microbiota: dynamic communities and host interactions. Nat Rev Microbiol. 2018;16(12):745–759.
- Nobbs AH, Lamont RJ, and Jenkinson HF. Streptococcus adherence and colonization. Microbiol Mol Biol Rev. 2009;73(3):407–450. Table of Contents.
- Costerton JW, Stewart PS, Greenberg EP. Bacterial biofilms: a common cause of persistent infections. Science. 1999;284(5418):1318–1322.
- Arciola CR, Campoccia D, Montanaro L. Implant infections: adhesion, biofilm formation and immune evasion. Nat Rev Microbiol. 2018;16(7):397–409.
- Hook AL, Chang CY, Yang J, et al. Combinatorial discovery of polymers resistant to bacterial attachment. Nat Biotechnol. 2012;30(6):868–875.
- Satpathy S, Sen SK, Pattanaik S, et al. Review on bacterial biofilm: an universal cause of contamination. Biocatal Agric Biotechnol. 2016;7:56–66.
- Sauer K. The genomics and proteomics of biofilm formation. Genome Biol. 2003;4(6):5.
- Tuson HH, Weibel DB. Bacteria-surface interactions. Soft Matter. 2013;9(17):4368–4380.
- Vissers T, Brown AT, Koumakis N, et al. Bacteria as living patchy colloids: phenotypic heterogeneity in surface adhesion. Sci Adv. 2018;4(4):8.
- Berne C, Ellison CK, Ducret A, et al. Bacterial adhesion at the single-cell level. Nat Rev Microbiol. 2018;16(10):616–627.
- Azeredo J, Azevedo NF, Briandet R, et al. Critical review on biofilm methods. Crit Rev Microbiol. 2017;43(3):313–351.
- Beaussart A, El-Kirat-Chatel S, Sullan RMA, et al. Quantifying the forces guiding microbial cell adhesion using single-cell force spectroscopy. Nat Protoc. 2014;9(5):1049–1055.
- Pan RR, Xu MC, Burgess JD, et al. Direct electrochemical observation of glucosidase activity in isolated single lysosomes from a living cell. Proc Natl Acad Sci U S A. 2018;115(16):4087–4092.
- Pan RR, Xu MC, Jiang DC, et al. Nanokit for single-cell electrochemical analyses. Proc Natl Acad Sci U S A. 2016;113(41):11436–11440.
- Simpson KH, Bowden G, and Hook M, et al. Measurement of adhesive forces between individual Staphylococcus aureus MSCRAMMs and protein-coated surfaces by use of optical tweezers. J Bacteriol. 2003;185(6):2031–2035.
- Rasmussen MB, Oddershede LB, and Siegumfeldt H. Optical tweezers cause physiological damage to Escherichia coli and Listeria bacteria. Appl Environ Microbiol. 2008;74(8):2441–2446.
- Chen ZX 2015. Surface plasmonic resonance based microscopy for biochemical analysis [ dissertation]. Nanjing University.
- Tawil N, Sacher E, and Mandeville R, et al. Surface plasmon resonance detection of E. coli and methicillin-resistant S. aureus using bacteriophages. Biosens Bioelectron. 2012;37(1):24–29.
- Syal K, Wang W, Shan XN, et al. Plasmonic imaging of protein interactions with single bacterial cells. Biosens Bioelectron. 2015;63:131–137.
- Jorgenson RC, Yee SS. A fiberoptic chemical sensor-based on surface-plasmon resonance. Sens Actuator B-Chem. 1993;12(3):213–220.
- Kim J. Mathematical modeling approaches to describe the dynamics of protein adsorption at solid interfaces. Colloid Surf B-Biointerfaces. 2018;162:370–379.
- Liu YN, Chen HB, Liu XW. Rapid assessment of water toxicity by plasmonic nanomechanical sensing. Anal Chem. 2020;92(1):1309–1315.
- Jiang D, Jiang Y, and Li Z, et al. Optical imaging of phase transition and Li-ion diffusion kinetics of single LiCoO2 nanoparticles during electrochemical cycling. J Am Chem Soc. 2017;139(1):186–192.
- Xiang Z, Li Z, and Ren Z, et al. EzrA, a cell shape regulator contributing to biofilm formation and competitiveness in Streptococcus mutans. Mol Oral Microbiol. 2019;34(5):194–208.
- Wang S, Shan X, Patel U, et al. Label-free imaging, detection, and mass measurement of single viruses by surface plasmon resonance. Proc Natl Acad Sci U S A. 2010;107(37):16028–16032.
- Torun O, Boyaci IH, Temur E, et al. Comparison of sensing strategies in SPR biosensor for rapid and sensitive enumeration of bacteria. Biosens Bioelectron. 2012;37(1):53–60
- Hannig C, Hannig M. The oral cavity–a key system to understand substratum-dependent bioadhesion on solid surfaces in man. Clin Oral Investig. 2009;13(2):123–139.
- Ma TF, Chen YP, Guo JS, et al. Cellular analysis and detection using surface plasmon resonance imaging. Trac-Trends Anal Chem. 2018;103:102–109.
- Chen TH, Hong Y, Reinhard BM. Probing DNA stiffness through optical fluctuation analysis of plasmon rulers. Nano Lett. 2015;15(8):5349–5357.
- Zhang P, Chen YP, Qiu JH, et al. Imaging the microprocesses in biofilm matrices. Trends Biotechnol. 2019;37(2):214–226.
- Komatsu H, Katayama M, and Sawada M, et al. Thermodynamics of the binding of the C-terminal repeat domain of Streptococcus sobrinus glucosyltransferase-I to dextran. Biochemistry. 2007;46(28):8436–8444.
- Banas JA, Vickerman MM. Glucan-binding proteins of the oral streptococci. Crit Rev Oral Biol Med. 2003;14(2):89–99.
- Lynch DJ, Michalek SM, and Zhu M, et al. Cariogenicity of Streptococcus mutans glucan-binding protein deletion mutants. Oral health and dental management. 2013;12(4):191–199.
- Lei L, Zhang B, Mao M, et al. Carbohydrate metabolism regulated by antisense vicR RNA in cariogenicity. J Dent Res. 2020;99(2):204–213.