
ABSTRACT
The number of dengue fever incidence and its distribution has increased considerably in recent years in Africa. However, due to inadequate research at the continental level, there is a limited understanding regarding the current and future spatial distribution of the main vector, the mosquitoAedes aegypti, and the associated dengue risk due to climate change. To fill this gap we used reported dengue fever incidences, the presence of Ae. aegypti, and bioclimatic variables in a species distribution model to assess the current and future (2050 and 2070) climatically suitable areas. High temperatures and with high moisture levels are climatically suitable for the distribution of Ae. aegypti related to dengue fever. Under the current climate scenario indicated that 15.2% of the continent is highly suitable for dengue fever outbreaks. We predict that climatically suitable areas for Ae. aegypti related to dengue fever incidences in eastern, central and western part of Africa will increase in the future and will expand further towards higher elevations. Our projections provide evidence for the changing continental threat of vector-borne diseases and can guide public health policy decisions in Africa to better prepare for and respond to future changes in dengue fever risk.
Introduction
Dengue fever incidence is the greatest public health problem for more than half of the population globally. The disease is the foremost cause of illness and mortality, mainly in endemic areas [Citation1]. Recent literatures suggested that around 3.9 billion people are under risk of dengue fever, with about 390 million infections per year, resulting in over 100 million symptomatic cases, and 10,000 deaths [Citation2–Citation4]. The disease burden has increased 30-times over the past five decades [Citation5,Citation6], and the number of endemic countries for the disease increased from 9 to 125 over the last four decades [Citation5]. The geographic distribution of dengue fever incidence is predicted to expand in the future due to climate change [Citation7,Citation8].
By the end the 21st century, the mean global temperature is predicted to increase between 1.8°C (low scenario) and 4°C (high scenario) [Citation9]. Africa is a highly vulnerable to climate change. Overall, in Africa the temperature has increased by 0.7°C over the 20th century and is predicted to increase further with 0.2°C (low scenario) to 0.5°C (high scenario) per decade [Citation9,Citation10]. Precipitation patterns are also uneven in Africa; however, records from 1951 to 2010 showed that there has been an increase in rainfall in parts of southern, eastern and central Africa and a decrease in western Africa and parts of southern Africa, particularly Zimbabwe and Zambia [Citation11]. Under the high emission scenario, annual precipitation is expected to increase in many parts of eastern Africa by 5 to 75%, while it is predicted to decrease across parts of southern Africa by 15–45% and western Africa up to 15% by 2100 [Citation12]. Thus, knowing the relationships between climate changes and climate-sensitive infectious diseases, such as dengue fever in Africa, where disease prevention measures are minimal, is crucial for improving public health and for early preparedness.
Dengue fever incidence is driven by climate factors as part of the different stages that the virus has to go through in the mosquito vector during the transmission of the disease [Citation2,Citation5,Citation13]. The life cycle of Ae. aegypti is directly influenced by climate changes [Citation3,Citation14–Citation16]. Increased temperature can increase the dengue fever epidemic by increasing availability of habitat suitable for mosquito development and by decreasing the virus incubation time, and thereby increasing the transmission rate [Citation2,Citation4,Citation17,Citation18]. However, very high temperatures may also lead to increased mosquito mortality and thus decrease dengue fever incidence risk (Ebi and Nealon, 2016; Sonia et al., 2013). Rainfall can have contrasting effects on dengue fever incidence [Citation2,Citation17]. Heavy rainfall may flush out eggs, larvae, and pupae [Citation19,Citation20]. However, in Africa, people store water in containers in the dry season, which can offer suitable breeding sites for Ae. aegypti [Citation6,Citation15,Citation16,Citation19]. Thus, climatic variability may affect the virus and/or the vector directly and indirectly. Climate change can therefore also trigger latitudinal and altitudinal shifts in the distribution of vector-borne infectious diseases [Citation2]. However, empirical relationships between climate variables, dengue fever incidence, and the distribution of Ae. aegypti, the main vector for dengue fever in Africa, have not been strongly established for the African context. Thus, understanding how the changing climate may influence the geographic expansion of Ae. aegypti and dengue fever incidence into new areas is vital to support the ongoing dengue management strategies and to improve further surveillance and interventions.
Species distribution models (SDMs) offer an empirical tool for understanding and simulating the spatial distributions of species, assessing the potential responses of species to climate changes, and establishing the environmental factors that determine a species’ niche dimensions [Citation21]. These models have been used by several studies (Acharya et al. 2018; Mweya et al. 2016; Kraemer et al. 2015), and are able to increased our knowledge not only on the current distribution of dengue fever and Ae. aegypti, but also on possible impact of expected climate changes [Citation19]. Although many studies have been conducted to examine the effect of climate variability on Ae. aegypti distribution, most of the studies have focused on either a global scale [Citation7,Citation8,Citation19,Citation22], or have been limited to a smaller geographical area in Africa [Citation16,Citation17]. More studies are required to better understand the impact of current environmental conditions on Ae. aegypti distribution and dengue fever incidence, and on the role of future climatic conditions in determining potential risk areas at the continental level. Moreover, currently, there is no treatment for dengue fever. The most commonly used methods to control dengue fever all start with regular monitoring and surveillance of vectors [Citation5]. Thus, information on how changing climatic conditions affect the spatial distribution and geographic expansion of Ae. aegypti related to dengue fever incidence is required. This, together with the identification of high risk areas, will support public health authorities in setting up effective surveillance programs and control strategies. The aim of this study was to explore the current and future climatically suitable ranges for A. aegypti in relation to dengue fever incidence in Africa, as well as to identify the most important predictor variables.
Materials and methods
Occurrence data collection
Continental presence records of Ae. aegypti were retrieved from the Global Biodiversity Information Facility (GBIF; www.gbif.org/), VectorMap and scientific publications [Citation3]. Continental sites or areas where dengue was reported were extracted from Simo et al [Citation3] and Messina et al [Citation4]. Several studies only use vector data, i.e. presence/absence of a vector, to model and predict the spatial heterogeneity in disease risk [Citation22], whereas other studies only use epidemiological data, i.e. the presence/absence data on disease cases [Citation4,Citation23,Citation24]. However, World Health Organization (WHO) recommends to integrate epidemiological and entomological information for the analyses of vector-borne diseases [Citation25]. Thus, we integrated epidemiological and entomological data to model the suitability of Ae. aegypti. In the first step, the locations with dengue fever incidences were mapped using ArcGis 10.8, and then presence records of Ae. aegypti were overlaid. In the second step, Ae. aegypti presence records were selected in the areas where dengue was reported, and these locations were used for constructing the model. This generated a total of 753 records of Ae. aegypti related to 62 records of dengue fever incidence.
Predictor variables
Nineteen bioclimatic variables from1950 to 2000 with a 10arc-min spatial resolution were obtained from the WorldClim database (http://www.worldclim.org) to represent the current climatic conditions. The improved fifth version of the atmosphere-ocean General Circulation Model (GCM), from the Model for Interdisciplinary Research on Climate (MIROC) from the Worldclim database was used for projection of the continental future climate. GCM is one of the most frequently used models to examine the impact of climate on species distribution (Phillips et al., 2006). Currently, it is not clear which future climate change scenario provides the best predictions for species [Citation26], thus we used two Representative Concentration Pathways-RCP4.5 and RCP8.5 for the greenhouse gas concentration trajectories of 2050 and 2070. RCP 4.5 represents a stabilization scenario, while RCP8.5 represents a worst case scenario with very high greenhouse gas emissions, atmospheric concentrations, air pollutant emissions and large land use changes. Thus, we used both RCP4.5 and RCP8.5 climate change scenarios in our analysis.
Bioclimatic variables were selected based on three criteria [Citation18]: those that (1) are statistically important in predicting Aedes presence data, (2) are biologically relevant for Aedes mosquito survival, and (3) do not show collinearity with other variables. Using Variance Inflation Factors (VIF), we tested collinearity among predictors. We used a stepwise procedure to remove predictor variables with VIF larger than 3. Finally, seven non-correlated bioclimatic variables were used as model input variables (). Further, we assessed the contribution of the variables by using the area under the curve (AUC).
Table 1. List of bioclimatic variables used for modelling the distribution of Ae. aegypti and dengue occurrence.
Species distribution model
Several algorithms are available for species distribution modelling, and performances of these algorithms vary considerably [Citation27]. The predictive power of a single model is low, thus, an ensemble of several models is recommended to produce accurate species distribution model [Citation28]. Thus, our modelling framework was based on five modelling algorithms implemented in the sdm package in R; (1) generalized linear model (GLM), (2) a random forest algorithm (RF), (3) multivariate adaptive regression splines (MARS), (4) boosted regression trees (BRT), and (5) support vector machine (SVM). We combined those five modelling algorithms into an ‘ensemble’ by averaging the models with a true skill statistic (Allouche et al. 2006; Acharya et al. 2018) larger than 0.8 to produce a ‘consensus model’. The consensus model is important to reduce the predictive uncertainty of single-models, since modelling approaches to predict species distributions vary significantly. Indeed, ensemble prediction generates a more robust model that overcomes the uncertainties obtained from individual models [Citation28].
Evaluating model performance
We randomly split our occurrence data into training (70%) for model calibration, and validation datasets (30%) to evaluate the performance of the model [Citation29]****. We randomly obtained pseudo-absence points outside the areas where both dengue virus and Ae. aegypti were not reported, as suggested by Allouche et alv [Citation21] and Elith et al ([Citation27]. Model performance was assessed based on the threshold-independent area under the receiver operating characteristic curve (AUC; Liu et al., 2005) and the threshold-dependent true skill statistic (TSS0 [Citation21]. The AUC values range between 0–1, where values >0.9, 0.7–0.9, 0.5–0.7 and <0.5 are considered as high performance, moderate performance, low performance and no better than random, respectively [Citation30]. TSS values range from −1 to 1, where value close to 1 indicates better performance, and values below zero indicate no better than random [Citation29]. Calibrated models, using the current conditions of predictor variables, were then used to predict future distributions using the RCP 4.5 and RCP 8.5 climate change scenario for 2050 and 2070. All modelling analyses were performed using the sdm package for R.
Results
Predictors and model performance
The bio6 accounted for the largest relative contribution to the model, with 27.4%, followed by bio7 (23.2%) and bio13 (11.8%). Bio14 was also an important predictor with a mean contribution of 11.6% ().
Figure 1. Variable importance (bio1 = annual mean temperature, bio5 = maximum temperature of warmest month, bio6 = minimum temperature of coldest month, bio7 = annual temperature range (Bio05–Bio06), bio12 = annual precipitation, bio13 = precipitation of wettest month, and bio14 = precipitation of driest month).
The mean AUC of the model was 0.96, indicating that the model had a high performance. MARS received the highest AUC score, whereas a GLM received the lowest AUC score (). The mean TSS values (0.83) were roughly in line with AUC values, indicating a good reliability of model predictions. The RF had the highest TSS score, and the GLM received the lowest among the 5 SDMs.
Table 2. Accuracy assessments (AUC and TSS) of five models used for predicting current and future habitat suitability for Ae. aegypti in Africa.
Predicted current and future risk areas
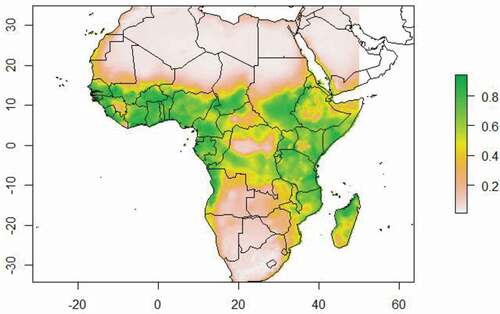
Model prediction under the current climate scenario indicated that the total highly and moderately suitable areas for Ae. aegypti in relation to dengue fever incidence are 15.2% and 11.2%, respectively. Low suitable area for the species is 14.2%, whereas the majority of Africa (59.3%) is not suitable for Ae. aegypti ()
Table 3. Percentage of coverage by the 4 classes of habitat suitability under the current and future (2050 and 2070) climate scenarios (RCP4.5 and RCP8.5) for Ae. aegypti in relation to dengue fever incidence in Africa.
Future scenario model projections revealed possible increase in the potential distribution of Ae. aegypti. Under RCP4.5 and RCP8.5 climate scenarios, in 2050 s, the highly suitable area for Ae. aegypti is predicted to increase by 21.8% and 23.3%, respectively, while the moderately suitable area is expected to increase by 21.8% and 28.0%, respectively. The areas covered by low suitable habitat decreased by 13.6 and 19.2% in 2050 under these two scenarios (). The total non suitable areas would decrease by 11.9% and 14.3% under RCP4.5 and RCP8.5, respectively, in 2050 s.
Table 4. Percentage of % change of habitat suitability in 2050 and 2070 climate scenarios (RCP4.5 and RCP8.5) for Ae. aegypti compared to the current climatic condition.
Compared to the current climatic condition, in 2070, the highly suitable areas for Ae. aegypti is projected to increase by 40.1% and 55.8%, under RCP4.5 and RCP8.5 scenarios, respectively while the moderately suitable area is projected to increase by 30.7% and 35.1%, under RCP4.5 and RCP8.5 climate scenario, respectively. In the same period, the total low suitable area for Ae. aegypti under RCP4.5 and RCP8.5 scenarios is projected to decrease with 9.4% and 11.5%, respectively (). Overall, areas considered with non suitable in Africa would decrease by 13.8% and 18.2% compared to the current climatic condition under RCP4.5 and RCP8.5 scenarios in 2070, respectively ().
Based upon the current climatic conditions, we found that the areas with low climatic suitable for Ae. aegypti in relation to dengue fever incidence were mainly found in northern and southern Africa, while high to moderate suitability areas were predicted for western and part of central Africa (). Under the predicted future climatic scenarios (), African countries with the highest to moderate suitable for infectious Ae. aegypti in relation to dengue fever incidence are Kenya, Ethiopia, Tanzania, South Sudan, Somalia and Uganda for eastern Africa and Nigeria, Cameroon, Equatorial Guinea, Gabon, Benin, Togo, Ghana, Burkina Faso, Cote-d’Ivoire and Sierra Leone from western Africa. On the other hand, countries with unsuitable or low suitable habitat for Ae. aegypti and dengue outbreaks are Egypt, Libya, Algeria and Morocco from northern, Mali and Mauritania from western, and South Africa, Botswana, Zimbabwe, Angola and Zambia for southern Africa.
Figure 2. Map showing the current habitat suitability for Ae. aegypti in relation to dengue fever incidences in Africa. Grey to green colours illustrate gradients of habitat suitability from low to high.
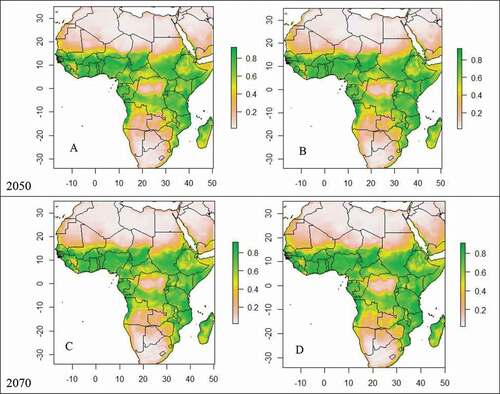
Predicted risk maps for the years 2050 and 2070 under both climate scenarios (RCP4.5 and RCP8.5) showed an increase in risk of dengue fever incidence compared to current climatic conditions. Under these two RCP emission scenarios, the ensemble model predicted an increase in the high suitability classes by the year 2050, and a further increase in 2070 (). In both periods, the projected increases in suitable areas (moderate to high) for Ae. aegypti in relation to dengue epidemic was predicted to increase particularly in central, eastern and south-eastern Africa. In contrast, in south-western and northern Africa, range losses were projected to be greater than range gains (). African countries such as Kenya, Ethiopia, Angola, Madagascar, Mozambique, Chad, South Sudan, Niger and Guinea will become more suitable for infectious Ae. aegypti in relation to dengue fever incidence in the future due to climate change.
Figure 3. Future continental suitability for Ae. aegypti associated with dengue fever incidences in Africa by 2050 under RCP4.5 (A) and RCP 8.5 (B) and by 2070 under RCP4.5 (C) and RCP 8.5 (D). Grey to green colours illustrate the gradient of suitability from low to high.
Discussion
Climate change is a major factor determining vector-borne diseases epidemics [Citation3,Citation6,Citation14,Citation31,Citation32]. Thus, in this study, we used species distribution model to identify current and future continental suitability for Ae. aegypti related to dengue fever incidence in Africa. Previous studies demonstrated that climate changes have increased the burden of many vector-borne diseases [Citation18,Citation31,Citation33,Citation34]. Studies indicating that the risk of dengue fever incidence is expected to increase globally under future climate change predictions [Citation6,Citation31,Citation35]. Similarly, our findings demonstrated that climatic suitability for Ae. aegypti in relation to dengue fever incidence will increase in the future in Africa, which is in agreement with other studies [Citation4,Citation7,Citation8,Citation19].WHO also stated that the endemicity of dengue fever incidence will increase, and outbreak could occur in areas where they are currently unknown due to climate changes [Citation36].
Changes in temperature have been predicted to determine mosquito-borne disease occurrence, primarily through changes in mosquito reproduction, development and survival, and pathogen incubation rates and survival [Citation2,Citation6,Citation14,Citation17,Citation37,Citation38]. Our study identified that temperature is the most important climatic variable, which collectively determined 70.8% of the potential distribution of Ae. aegypti in relation to dengue fever incidence in Africa. Similarly, other studies also found that in areas with higher temperatures the rate of larval development will increase, which can boost mosquito populations, and increase the probability of eggs being hatched, and thereby increase the dengue fever incidence risk [Citation3,Citation4,Citation6,Citation8,Citation17,Citation19,Citation20,Citation28,Citation39]. At high temperature, the feeding behaviour of the mosquito is also expected to increase, further increasing dengue fever incidence risk [Citation6]. Precipitation is also vital for creating suitable habitat for the aquatic stages in the mosquito life cycle, and strongly influences vector distribution [Citation6,Citation17,Citation20]. Therefore, the two bioclimatic factors, temperature and precipitation, largely determine the suitability of the areas for Ae. aegypti in relation to dengue fever incidence through their influence on the distribution, abundance, and behaviour of the vector (SI-Figure 1).
Tun-Lin et al [Citation40] experimental study showed that the suitable temperature range for the survival of Ae. aegypti is between 20°C and 30°C. According to other studies, optimal Ae. aegypti development and survival, including suitable sites for egg deposition, occurs in habitat with at least 500 mm of annual rainfall and a temperature between 25°C and 30°C [Citation32,Citation35,Citation41], which is consistent with the results of our study, which indicated that countries with similar ranges for rainfall and temperature were highly to moderately suitable for infectious Ae. aegypti under current and future climatic conditions (SI-Figure 1). On the other hand, high temperatures with low moisture can increase mosquito mortality and decrease the incubation time for the virus, and thereby decrease the risks of dengue fever incidence [Citation5]. Similarly we found that no to low climatic suitable habitat for infectious Ae. aegypti were areas with higher temperatures and low levels of precipitation, and areas with low temperatures and high levels of precipitation (SI-Figure 1). Thus, the expected gradual increasing temperature and precipitation in the continent caused by global warming could promote Ae. aegypti development and survival, which could increase the successful propagation of dengue fever incidence in the future. Therefore the results of our study also indicate that we should be alert for an epidemic of dengue fever as precipitation and temperatures continue to increase.
We observed that high and moderate suitable areas under the current climate conditions were found in low elevation areas. The projected results showed that in the future (2050 and 2070) under both climate scenarios (RCP4.5 and RCP8.5), the expected range expansion for infectious Ae. aegypti would be primarily in higher elevation areas along the edges of the current distribution (SI-Figure 1). Low and moderately suitable areas would be predicted to change into moderate and highly suitable areas, respectively. This indicates that the possibility of large and frequent dengue outbreaks in high elevation areas can be anticipated in the future. Ae. aegypti range shift towards high elevation related to dengue fever incidence is generally similar with other studies, which reported that the vector might move toward higher elevations in response to climate change [Citation2,Citation17].
Conclusions
It is now widely accepted that climate change will affect our health through a variety of pathways. Africa is a highly vulnerable to climate variability. Due to climate change, dengue fever incidences are expected to increase in eastern, central and western Africa. The suitable range for Ae. aegypti would shift towards high elevation, where large numbers of human population live. Thus understanding the spatial suitability for Ae. aegypti in relation to the human risk of exposure to dengue fever is crucial for improving early detection and the application of proactive vector control measures. The results of this study may also help in assisting public health policy makers in prioritizing sites for surveillance and control of Ae. aegypti. Moreover knowledge on the basic spatial risk patterns can also be used to raise awareness of vector-borne disease risk among public health communities and the general public in an effort to reduce dengue related mortality. These research findings also call for regional coordination of active monitoring and surveillance programs of vectors, and cross-border collaboration with neighbouring countries to reduce the dengue exposure risk.
Supplemental Material
Download TIFF Image (19.6 KB)Disclosure statement
No potential conflict of interest was reported by the authors.
Supplementary material
Supplemental data for this article can be accessed here.
Additional information
Notes on contributors
Dejene W. Sintayehu
Dejene W. Sinatyehu is an assistant professor at Haramaya University, Ethiopia.
Nega Tassie
Nega Tassie is an assistant professor at Bahir Dar University, Ethiopia.
References
- Gubler DJ. The economic burden of dengue . Am J Trop Med Hyg. 2012;86(5):743–7.
- Acharya BK , Cao C , Xu M , et al. Present and future of dengue fever in Nepal: mapping climatic suitability by ecological niche model . Environ Res Public Heal. 2018;15:187–198.
- Simo FBN , Bigna JJ , Kenmoe S , et al. Dengue virus infection in people residing in Africa: A systematic review and meta-analysis of prevalence studies. Sci Rep. 2019;9:1–9.
- Messina JP , Brady OJ , Golding N , et al. The current and future global distribution and population at risk of dengue. Nat Microbiol. 2020;4:1508–1515.
- Naish S , Dale P , Mackenzie JS , et al. Climate change and dengue: A critical and systematic review of quantitative modelling approaches. BMC Infect Dis. 2014;14:1–14.
- Ebi KL , Nealon J . Dengue in a changing climate. Environ Res. 2016;151:115–123.
- Ryan SJ , Carlson CJ , Mordecai EA , et al. Global expansion and redistribution of Aedes - borne virus transmission risk with climate change. PLoS Negl Trop Dis. 2019;13:1–20.
- Campbell-lendrum D , Manga L , Bagayoko M , et al. Climate change and vector-borne diseases: what are the implications for public health research and policy? Philos Trans R Soc B. 2015;370:370.
- IPCC , C LIMATE C HANGE 2001 :, Sci. Basis. Contrib. Work. Gr. I to Third Assess. Rep. Intergov. Panel Clim. Chang. Cambridge Univ. Press. Cambridge, UK New York, NY, USA (2001)
- Hulme M , Doherty R , Ngara T , et al. African climate change: 1900-2100. Clim Res. 2001;17:145–168.
- Girvetz EH , Zganjar C . Dissecting indices of aridity for assessing the impacts of global climate change. Clim Change. 2014;126:469–483.
- Sillmann J , Kharin VV , Zwiers FW , et al. Climate extremes indices in the CMIP5 multimodel ensemble: part 2. Future climate projections. J Geophys Res Atmos. 2013;118:2473–2493.
- Morin CW , Comrie AC , Ernst K . Climate and dengue transmission: evidence and implications. Environ Health Perspect. 2013;121(11–12):1264–1272.
- Fouque F , Reeder JC . Impact of past and on-going changes on climate and weather on vector-borne diseases transmission: A look at the evidence. Infect Dis Poverty. 2019;8:1–9.
- Mweya CN , Kimera SI , Kija JB , et al. Predicting distribution of Aedes aegypti and Culex pipiens complex, potential vectors of Rift Valley fever virus in relation to disease epidemics in East Africa. Infect Ecol Epidemiol. 2013;8686:1–7.
- Ochieng AO , Nanyingi M , Kipruto E , et al. Ecological niche modelling of Rift Valley fever virus vectors in Baringo, Kenya. Infect Ecol Epidemiol. 2016;6:1–9.
- Mweya CN , Kimera SI , Stanley G , et al. Distribution of infected Aedes aegypti co- occurrence with dengue epidemics risk areas in Tanzania. PLoS One. 2016;1–13.
- Ren Z , Wang D , Ma A , et al. Predicting malaria vector distribution under climate change scenarios in China : challenges for malaria elimination. Nat Publ Gr. 2020;6:1–13.
- Kraemer MUG , Sinka ME , Duda KA , et al. The global distribution of the arbovirus vectors Aedes aegypti and Ae. albopictus. Elife. 2015;4:1–18.
- Gu H , Leung RKK , Jing Q , et al. Meteorological factors for dengue fever control and prevention in South China. Int J Environ Res Public Health. 2016;13:1–12.
- Allouche O , Tsoar A , Kadmon R . Assessing the accuracy of species distribution models: prevalence, kappa and the true skill statistic (TSS). J Appl Ecol. 2006;43:1223–1232.
- Leta S , Fetene E , Mulatu T , et al. Modeling the global distribution of Culicoides imicola : an ensemble approach. Sci Rep. 2019;9:1–9.
- Hii YL , Zhu H , Ng N , et al. Forecast of dengue incidence using temperature and rainfall. PLoS Negl Trop Dis. 2012;6(11):e1908.
- Jain R , Sontisirikit S , Iamsirithaworn S , et al. Prediction of dengue outbreaks based on disease surveillance, meteorological and socio-economic data. BMC Infect Dis. 2019;19:1–16.
- WHO . Global Vector Control Response 2017–2030 ; 2017.
- Hayes MA , Piaggio AJ . Assessing the potential impacts of a changing climate on the distribution of a rabies virus vector. PLoS One. 2018;13:1–17.
- Elith J , Graham CH , Anderson RP , et al. Novel methods improve prediction of species’ distributions from occurrence data. Ecography (Cop). 2006;29(2):129–151.
- Araújo MB , New M . Ensemble forecasting of species distributions. Trends Ecol Evol. 2007;22:42–47.
- Chalghaf B , Chemkhi J , Mayala B , et al. Ecological niche modeling predicting the potential distribution of Leishmania vectors in the Mediterranean basin : impact of climate change. Parasit Vectors. 2018;11:1–9.
- Phillips RES , Steven J , Anderson RP . Maximum entropy modeling of species geographic distributions. Ecol Modell. 2006;190:231–259.
- Butterworth MK , Morin CW , Comrie AC . An analysis of the potential impact of climate change on dengue transmission in the southeastern USA. EnvironHealth Perspect. 2017;125:579–585.
- Goindin D , Delannay C , Ramdini C , et al. Parity and longevity of aedes aegypti according to temperatures in controlled conditions and consequences on dengue transmission risks. PLoS One. 2015;10:1–21.
- Liu B , Jiao Z , Ma J , et al. Modelling the potential distribution of arbovirus vector Aedes aegypti under current and future climate scenarios in Taiwan, China. Pest Manag Sci. 2019;75:3076–3086.
- Simons RRL , Croft S , Rees E , et al. Using species distribution models to predict potential hot-spots for Rift Valley Fever establishment in the UK. PLoS One. 2019;14(12):e0225250.
- Jácome G , Vilela P , Yoo C . Present and future incidence of dengue fever in Ecuador nationwide and coast region scale using species distribution modeling for climate variability’s effect. Ecol Modell. 2019;400:60–72.
- WHO . Treatment, prevention and control global strategy for dengue prevention and control. WHO, Geneva 27, Switzerland. 2; 2012.
- Akpan GE , Adepoju KA , Oladosu OR . Potential distribution of dominant malaria vector species in tropical region under climate change scenarios. PLoS One. 2019;14:1–21.
- Fouque F , Carinci R , Gaborit P , et al. Aedes aegypti survival and dengue transmission patterns in French Guiana. J Vector Ecol. 2006;31:390–399.
- Campbell LP , Luther C , Moo-llanes D , et al. Climate change influences on global distributions of dengue and chikungunya virus vectors. Campbell. 2015;370:1–9.
- Tun-Lin W , Burkot TR , Kay BH . Effects of temperature and larval diet on development rates and survival of the dengue vector Aedes aegypti in north Queensland, Australia. Med Vet Entomol. 2000;14:31–37.
- Medlock JM , Hansford KM , Versteirt V , et al. An entomological review of invasive mosquitoes in Europe. Bull Entomol Res. 2018;105:637–663.