
ABSTRACT
Outer membrane vesicles (OMVs) are spherical membrane nanoparticles released by Gram-negative bacteria. OMVs can be quantified in complex matrices by nanoparticle tracking analysis (NTA). NTA can be performed in static mode or with continuous sample flow that results in analysis of more particles in a smaller time-frame. Flow measurements must be performed manually despite the availability of a sample changer on the NanoSight system. Here we present a method for automated measurements in flow mode. OMV quantification in flow mode results in lower variance in particle quantification (coefficient of variation (CV) of 6%, CV static measurements of 14%). Sizing of OMVs was expected to be less favorable in flow mode due to the increased movement of the particles. However, we observed a CV of 3% in flow mode and a CV of 8% in static measurements. Flow rates of up to 5 µL/min displayed correct size and particle measurements, however, particle concentration was slightly lower than in static measurements. The automated method was used to assess OMV release of batch cultures of Neisseria meningitidis. The bacteria released more OMVs in stationary growth phase, while the size of the vesicles remained constant throughout the culture. Taken together, this study shows that automated measurements in flow mode can be established with advanced scripting to reduce the workload for the user.
Responsible Editor Paul Harrison, University of Birmingham, United Kingdom
Introduction
Bacterial derived nanoparticles, known as outer membrane vesicles (OMVs), have gained more and more attention in the development of bacterial vaccines [Citation1,Citation2]. These OMVs are 20–200 nm spherical particles that resemble the outside of the bacterium [Citation3]. OMVs are complex nanoparticles consisting of proteins, lipopolysaccharides, phospholipids, and DNA that are involved in cellular communication, toxin delivery, surface modifications, removal of undesired components, and polysaccharide degradation [Citation4–Citation7].
The quantification of OMVs has been challenging since indirect methods had to be used for detection of the particles. Often, the total protein concentration of the OMV sample was used as a measure of the number of vesicles [Citation8–Citation12]. Another indirect method was based on the integration of a hydrophobic dye in vesicle membrane, resulting in a measurable change in absorbance [Citation13]. These indirect methods can be largely influenced by impurities and are thus not suited to measure unpurified and intermediate samples.
Direct measurement of OMVs by nanoparticle tracking analysis (NTA) can be used for the quantification and sizing of OMVs [Citation14]. Besides measurement of the number and size of the particles, the refractive index of individual particles can be calculated [Citation15]. NTA can be performed in static mode by measuring the particles trapped in the measurement chamber or in flow mode by slowly flowing the nanoparticle sample through this measurement chamber. Static measurements allow the analysis of single nanoparticles in time, for example the study of nanoparticle aggregation by elevated temperatures [Citation16]. Flow mode NTA measurements for nanoparticle quantification are advantageous over static measurements since more particles can be measured in a smaller time-frame resulting in less variance in particle quantitation [Citation17]. NTA can be used to measure specifically fluorescent labelled particles [Citation18]. In this fluorescence measurement, continuous measurement is advantageous since the sample flow prevents photobleaching of the fluorescent label [Citation19].
Despite the availability of both a syringe pump and a sample changer on the NanoSight NS500, there is no option for automated measurements in flow mode available. As a result, the analysis of samples under flow mode require more time than automated static measurements. In this work we describe a method that combines the measurement of samples in flow mode with the sample changer to allow high throughput measurement under flow. For this, we have compared the accuracy of NTA measurements of OMVs in static measurements and in flow mode. The influence of the flow rate on the NTA analysis has been assessed. Lastly, we applied the automated measurement method to quickly assess a large set of samples to research the OMV formation in batch cultivations.
Material and methods
Preparation of OMV stock
A highly purified Neisseria meningitidis spontaneous released OMV (sOMV) investigational vaccine was prepared from a batch culture of Neisseria meningitidis. From this culture broth, the vesicles were separated from the bacteria by tangential flow filtration using a 0.2 µm cut-off mPES hollow fibre module (Spectrum Labs, The Netherlands). Vesicles were concentrated by tangential flow filtration using a 100 kDa cut-off mPES hollow fibre module (Spectrum Labs, The Netherlands), and the sOMVs were subsequently purified by preparative size exclusion chromatography using SepharoseTM 6 Fast Flow resin (GE Healthcare Life Sciences, USA). Lastly, a dead-end sterile filtration step was performed to ensure sterility of the sOMV product before it was stored at 4°C. To assess the total protein content of the OMV stock, a Lowry protein assay with Peterson’s modification was used according to the manufacturer’s protocol (Sigma-Aldrich, The Netherlands). The sOMVs were diluted in freshly tapped MilliQ water up to a concentration of approximately 8.5 × 10⁸ particles/mL. This concentration was chosen so that the NTA measurements yield 40–50 particles per frame to ensure measurements are in the linear range of NTA measurements [Citation20].
Nanoparticle tracking analysis
A NanoSight NS500 with a 488 nm laser module and sCMOS camera module was used for all NTA measurements (Malvern Instruments, UK). Additionally, a Gilson 223 sample changer and a Harvard Apparatus syringe pump (Catalogue No. 98–4730) were connected to the NS500 by a four-way connector, as described in the results section. The syringe pump was equipped with a 500 µL glass syringe (Hamilton Model 1750 RN). Static measurements were obtained by capturing 10 measurements of 60 s of a sample loaded in the measurement chamber. Measurements in flow mode were performed with a flow rate of 25 (~2.6 µL/min), yielding a y-drift of 4.0 pixels per frame. Like the static measurements, these flow measurements consisted of 10 measurements of 60 s, but with an additional 30 s delay between measurements. The method for automated measurements in flow mode is described in the results section. The script file used for these automated measurements can be found in the Supplemental File 1. All measurements were performed with temperature controlled at 25°C, and the captured data of both static and flow measurements was analysed using NTA 3.2 software build 3.2.16. The capture settings and the analysis settings of the NTA software are shown in . The machine was calibrated by the NanoSight NTA concentration measurement upgrade. The NS500 is cleaned with Decon 90 monthly, according to the recommendations described in the manual. Before all sample measurements, we confirmed that the MilliQ diluent contained less than 1.0 particle per frame by measuring the MilliQ diluent for 60 s in static mode.
Table 1. NTA software settings.
Statistics
Statistics of the static and flow NTA measurements were performed in RStudio [Citation21], version 0.99.903. Significance of the static and flow NTA measurements was calculated by an exact, unpaired Mann-Whitney U test by using the exactRankTests package version 0.8–28 [Citation22].
Dynamic light scattering
Dynamic light scattering (DLS) measurements were performed by using a Zetasizer Nano-ZS (Malvern Instruments, UK). Measurements were made in disposable polystyrene semi-micro cuvettes (Greiner bio-one, 613101) using the Zetasizer 7.11 software. A standard operating procedure (SOP) was used for the measurements with sample set as protein with a refractive index of 1.450 and an absorption of 0.001. Water was used as dispersant with a viscosity of 0.8872 cP and refractive index of 1.330. Three measurements were performed using a measurement angle of 173° (backscatter), auto measurement duration and “seek for optimal position” as positioning setting. Data processing was performed with the general purpose (normal resolution) analysis model.
Bioreactor cultivations
Batch cultivation for OMV stock production was performed in a 3 L working volume dished bottom bioreactors with a H/D ratio of 1.0 based on working volume (Applikon Biotechnology, The Netherlands). Cultures were controlled at 35 ± 0.5°C, pH 7.2 ± 0.05 with 1M HCl and 1M NaOH, and a dissolved oxygen tension of 30% using a Trytoni controller (Pierre Guerin, France). Dissolved oxygen tension was controlled by the agitation rate (300–1000 RPM) and the concentration of oxygen in the headspace gas flow of 1 NL/min. Culture samples were sterile filtered with a disposable syringe filter with 0.22 µm cut-off and stored at 4°C.
Results
Static vs. flow measurements
NTA can be performed by static measurements or by measurements in flow mode. Sample flow allows more particles to be analysed in a single capture, but the software has to correct for the particle drift in the measurement. To assess the most accurate method for OMV enumeration and OMV sizing, we compared static and continuous flow NTA measurements. From a N. meningitidis OMV stock, 100 measurements were obtained in both static and in flow-mode, by manually capturing 10 videos of 60 s of 10 replicate samples.
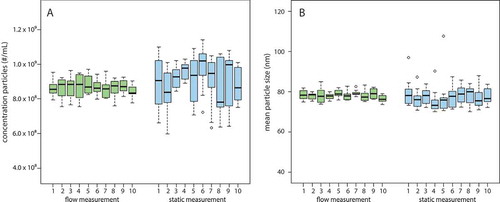
OMV quantification of the 100 static measurements showed a mean particle concentration of 9.07 × 10⁸ particles/mL with a coefficient of variation (CV) of 14% (). Flow measurements showed a mean concentration of 8.63 × 10⁸ particles/mL with a CV of 6%. Sizing of the particles showed a mean size of 77.6 nm (CV = 8%) and 78.2 nm (CV = 3%) for respective static and continuous flow measurements. The lower measurement variation in for both particle size and particle number in the flow measurements can be explained by the increased number of particles analysed due to the increased observation volume. The reduced variance in the size measurement under flow shows that the software is capable of correcting for the particle drift. Based on the lower variation in the continuous flow measurement, the number of captures per sample measurement could be reduced and we used this method of NTA for the automated quantification of OMVs.
Figure 1. Static (blue) and flow (green) measurements of outer membrane vesicles. Boxplot A shows the result of NTA particle concentration measurement and plot B of NTA particle sizing. Boxes represent 10 measurements of 60 s. Outliers represent measurements 1.5 times the interquartile range below the lower quartile or above the upper quartile.
Automated flow measurements
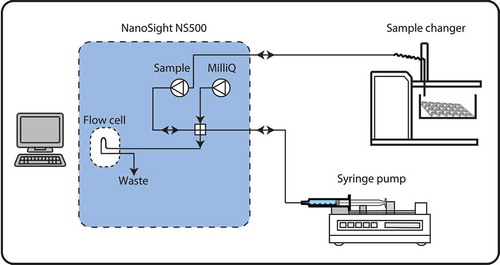
To automate the sample measurement in flow mode, we connected both the sample changer and the syringe pump to a NanoSight NS500 (). The connection was made with a four-way valve allowing the sample to be loaded in to the syringe pump before the sample was measured. The flow path through the four-way valve was controlled by the two pumps on the NanoSight and the syringe-pump. All pumps block their flow path when switched off so that the flow path can be directed by rational programming of the pumps. To realise the flow from the autosampler to the syringe pump, which crosses two pumps, the syringe pump was calibrated with the integrated pump of the NanoSight. The approach of this programming is described in this section and the developed script for automated continuous flow measurements can be found in Supplemental File 1.
Figure 2. The schematic setup of the NanoSight setup for automated flow measurements. Both the sample changer and the syringe pump are connected to the NanoSight by a four-way valve.
Automated continuous flow measurements start with an initialisation phase, followed by the measurement phase and end by a finalisation phase (). In the initialisation phase (INIT) the syringe pump, sample changer and the measurement cell are flushed with MilliQ. The MilliQ is measured to confirm the absence of particles in the MilliQ supply. During the measurement phase (MEAS) the number of measurements can be set by a loop from MEAS1 to MEAS7. Within this loop the sample is transferred from the sample changer to the syringe pump, before the sample is loaded in to the measurement chamber. A second loop is programmed in MEAS3 which determines the number of captures per sample. After each measurement, sample changer, the syringe, and the measurement chamber are washed with MilliQ water before a new sample is measured. In the finalisation phase (FINA) the captures are processed and the result can be exported.
Table 2. Schematic overview of the script for automated measurement in flow mode.
For a measurement in flow mode, the sample was loaded from the sample changer to the syringe in the syringe pump. We ensured the purity of the sample by setting the sample pump at a slightly higher rate than the syringe pump. As a result, a small fraction of the sample was directly flushed through the measurement chamber to the waste. Similarly, this methodology was used to flush the syringe pump and the measurement chamber with MilliQ.
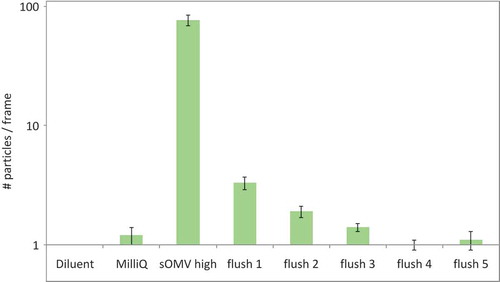
Washing of the syringe pump was required to prevent cross contamination between samples. A single flush cycle consists of emptying the syringe and loading the syringe with MilliQ. To complete the wash cycle, the syringe was emptied. Because of the inevitable holdup volume of the tubing and in the connection with the syringe, sample cross contamination could be detected. After one flush cycle, sample carryover of approximately 5% was observed. The cross contamination for up to five wash cycles was tested (). In the first two flushes particles derived from the measured OMV stock could be detected. The particle concentration after three flushes showed a similar background particle concentration as the MilliQ water. An excess of five flush cycles of the syringe was programmed in the script for automated continuous flow measurements to minimise the possibility of cross contamination between samples.
Figure 3. Automated cleaning of the syringe pump. NTA measurements were made from the diluent MilliQ water and MilliQ water loaded in the syringe to assess background particles. A OMV stock yielding 80 particles per frame was prepared and measured by recording a single 60 s capture. Next the syringe was emptied and filled with MilliQ and measured again (Flush 1). Flushes were repeated to assess the carry-over of particles.
Influence of the sample flow rate on NTA
NTA measurements in flow mode showed a significant lower (p = 0.0003) particle concentration of 5% compared to static measurements (). It is unknown which value resembles the exact value of the OMV stock solution the closest. To assess the possible influence of the flow rate on the particle quantification, we have measured the OMV stock at different flow rates.
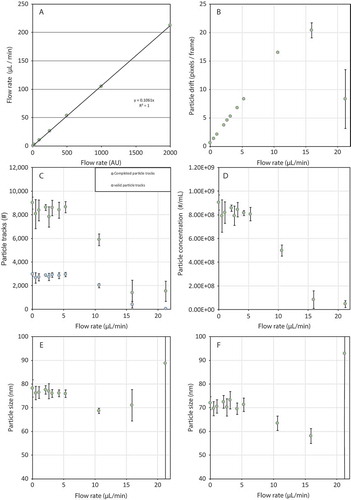
The OMV stock was measured in static mode and at flow rates up to 200 units of the NTA software. This maximum flow rate corresponds, in combination with the 500 µL syringe, to a liquid flow of 21 µL/min (Figure 4(a)). NTA analysis showed that the detected particle drift linearly correlates to the flow rate up to a flow of 15 µL/min ((b)). The tracking of particles and the calculated particle concentration shows to be constant at flow rates up to 5 µL/min ((c, d)). Flow rates of 10 µL/min and higher showed to result in unrealistic low particle concentrations. The mean size of the OMVs analysed in flow measurements up to 5 µL/min was comparable to measurements by DLS. Similar to concentration measurements, size measurements were not accurate at flow measurements of 10 µL/min and higher ((e, f)). The flow rate of 2.6 µL/min showed to be in the proper range for both size and concentration measurements and is therefore used in the script for automated measurements in flow mode.
Figure 4. The influence of sample flow rate on NTA. The artificial flow rate of the NTA software has been calibrated using a 500 µL syringe (a). OMV stock was measured at different flow rates. The observed particle drift (b), total and valid particle tracks (c), concentration (d), mean size (e), and mode size (f) are plotted against the sample flow rate.
OMV release by Neisseria meningitidis
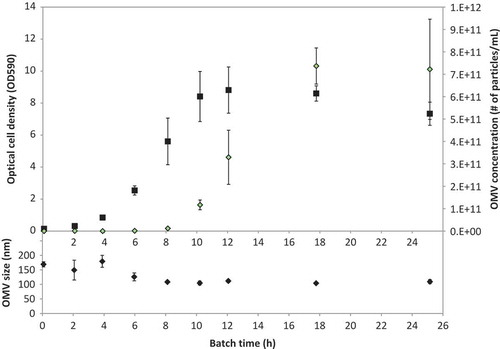
The script for automated measurements in flow mode was used to assess the OMV release during bacterial growth. Three N. meningitidis cultures were grown in benchtop bioreactors and supernatant samples were analysed by NTA (). Between 2 and 8 h the growth is exponential and the observed release of vesicles is low. The OMV release shows an increase in the stationary phase, 10–18 h. Interestingly the size of the vesicles remains similar during the whole duration of the cultivation ().
Figure 5. Growth of Neisseria meningitidis in benchtop batch cultivation. Upper panel shows the growth pattern of the bacteria (black squares) and shows that OMVs (green diamonds) are increasingly produced after the exponential growth phase. The lower panel shows the size of OMVs. The size of OMVs released in the exponential growth phase is similar to the size of OMVs produced in the stationary phase. The increased size of OMVs in the first 6 h of the cultivations deviates, possibly caused by the increased measurement error due to concentrations in the range of the lower limit of detection.
Discussion
Continuous flow NTA measurements were automated using the sample changer in combination with the scripting possibilities of the NTA software. NTA measurements of an OMV stock showed that continuous flow measurements are advantageous over static measurements in quantifying and sizing of OMVs. The automated method severely reduced the workload per measurement. Steppert et al. report that static NTA measurements on a NanoSight LM10 requires 30–45 min per sample [Citation23], which corresponds to our experience with static NTA on the NS500. A small fraction of this time is required for sample preparation, which makes it advantageous to automate the measurement. Automated NTA can also be used for samples of unknown concentration whereas serial dilutions can be processed by the automated method described here. Cross-contamination of too-concentrated samples is prevented by the number of syringe wash steps in the automated measurement. Overall the workload for analysing 24 samples by the automated method is roughly 2 h. Depending on the chosen capture settings, the required measurement time of the equipment is around 30 min per sample. The automated method is not limited to OMV samples and theoretically the method can be applied to all samples analysed by flow-mode NTA.
NTA at different flow rates showed that flow measurements applying flows of 10 µL/min or higher altered the measured particle concentration and the measured size for the N. meningitidis OMV stock. This effect has also been shown by NanoSight for the analysis of 100 nm polystyrene latex beads [Citation24]. In their measurement a higher flow rate of 20–50 AU (in combination with a 1 mL syringe, corresponding to approximately 4–11 µL/min) showed to be ideal [Citation17,Citation24]. The differences between these two measurements are the particles used and their refractive index, although the refractive index is not expected to influence the concentration measurement. Recent studies suggest that flow measurements alter the observed concentration of various extracellular vesicles already at low flow rates [Citation25–Citation27]. Here we also observed a minor difference between static and flow measurements. This study showed that flow rates below 10 µL/min are suited for OMV quantification and sizing.
The batch-wise cultivation of N. meningitidis showed an increased OMV release in the stationary growth phase. This pattern of release was similar to the previously described OMV release that was analysed by the hydrophobic dye Synaptored C2 [Citation28]. By using NTA, we showed that the size of OMVs remains constant during the cultivation, although in the first hours of the cultivation the size shows to be increased. This is probably caused by particle concentration near the limit of detection although it could be possible that the observed switch in the culture could affect the size of the produced OMVs. Gene regulation may be of possible influence to OMV size since it has been previously shown that OMV size differs between mutants with deletion of genes possibly involved in the OMV biogenesis [Citation29].
Alternative methods for combined OMV quantification and sizing are high-resolution flow cytometry (hFC) [Citation30] and tuneable resistive pulse sensing (TRPS) [Citation31,Citation32]. These two techniques have recently been compared to static NTA for the analysis of extracellular vesicles by two groups [Citation33,Citation34]. Both groups conclude that hFC, TRPS and NTA are suited to quantifying and sizing extracellular vesicles. The reduction in workload required for NTA measurements can be an important consideration in the choice of analysis techniques, whereas automated sample measurement is not available for TRPS.
The automated method of NTA reduced the workload, but several practical implications should be noted. The automated method can be used for large numbers of samples, but when samples were applied in open (Eppendorf) tubes, we observed increased concentrations of particles. It appeared that the increased concentration was caused by evaporation before the sample was loaded in the measurement chamber. The use of sample vials with a septum solved this issue. With this approach, diluted samples can be in the sample changer for extended periods of time prior to measurement. OMVs are highly stable, however less stable samples could benefit by automated sample dilution directly prior to the measurement. The current hardware could be compatible with automated sample dilutions and adding this feature will be an improvement to the NanoSight system. Furthermore, the extended time-span of using the equipment may cause gas bubbles in the measurement chamber. These bubbles can interfere with the measurement by expelling sample from the observation volume or by disturbing the liquid flow in the measurement chamber. Gas bubble formation was avoided by degassing the MilliQ water bottle by vacuum degasification. A last practical adjustment to the equipment was made by replacing the plastic syringe for a glass version to prevent particles from sticking to the syringe and to reduce the number of flushes required between the measurements of samples.
In conclusion, the automation of continuous flow measurements can be applied with the described script on all NanoSight equipment when connected to both a sample changer and a syringe pump. This method can improve both the quality of the measurement while the workload is reduced simultaneously. Furthermore, the script secures the measurement settings, which further standardises the use of NTA.
Script_automated_NTA_in_flow_mode.txt
Download Text (2.1 KB)Acknowledgements
We thank Patrick Hole for his constructive feedback on the particle concentration measurements at different flow rates.
Disclosure statement
No potential conflict of interest was reported by the authors.
Supplemental data
Supplemental data for this article can be accessed here.
Additional information
Funding
Related Research Data
References
- Acevedo R, Fernãndez S, Zayas C, et al. Bacterial outer membrane vesicles and vaccine applications. Front Immunol. 2014;5:1.
- van der Pol L, Stork M, van der Ley P. Outer membrane vesicles as platform vaccine technology. Biotechnol J. 2015;10(11):1689–9.
- Kulp A, Kuehn MJ. Biological functions and biogenesis of secreted bacterial outer membrane vesicles. Annu Rev Microbiol. 2010;64:163–184.
- Haurat MF, Elhenawy W, Feldman MF. Prokaryotic membrane vesicles: new insights on biogenesis and biological roles. Biol Chem. 2015;396(2):95–109.
- Schwechheimer C, Kuehn MJ. Outer-membrane vesicles from Gram-negative bacteria: biogenesis and functions. Nat Rev Microbiol. 2015;13(10):605–619.
- Mashburn LM, Whiteley M. Membrane vesicles traffic signals and facilitate group activities in a prokaryote. Nature. 2005;437(7057):422–425.
- McBroom AJ, Kuehn MJ. Release of outer membrane vesicles by Gram-negative bacteria is a novel envelope stress response. Mol Microbiol. 2007;63(2):545–558.
- van de Waterbeemd B, Zomer G, Kaaijk P, et al. Improved production process for native outer membrane vesicle vaccine against Neisseria meningitidis. Plos One. 2013;8(5):e65157.
- Serruto D, Bottomley MJ, Ram S, et al. The new multicomponent vaccine against meningococcal serogroup B, 4CMenB: immunological, functional and structural characterization of the antigens. Vaccine. 2012;30(Suppl 2):B87–B97.
- Salverda MLM, Meinderts SM, Hamstra HJ, et al. Surface display of a borrelial lipoprotein on meningococcal outer membrane vesicles. Vaccine. 2015;34:1025–1033.
- Fantappie, L., de Santis M, Chiarot E, et al. Antibody-mediated immunity induced by engineered Escherichia coli OMVs carrying heterologous antigens in their lumen. J Extracell Vesicles. 2014;3:24015.
- Daleke-Schermerhorn MH, Felix T, Soprova Z, et al. Decoration of outer membrane vesicles with multiple antigens by using an autotransporter approach. Appl Environ Microbiol. 2014;80(18):5854–5865.
- McBroom AJ, Johnson AP, Vemulapalli S, et al. Outer membrane vesicle production by Escherichia coli is independent of membrane instability. J Bacteriol. 2006;188(15):5385–5392.
- Malloy A, Carr B. NanoParticle tracking analysis – The halo™ system. Part Part Syst Characterization. 2006;23(2):197–204.
- Gardiner C, Shaw M, Hole P, et al. Measurement of refractive index by nanoparticle tracking analysis reveals heterogeneity in extracellular vesicles. J Extracell Vesicles. 2014;3:25361.
- Filipe V, Hawe A, Jiskoot W. Critical evaluation of nanoparticle tracking analysis (NTA) by nanosight for the measurement of nanoparticles and protein aggregates. Pharm Res. 2010;27(5):796–810.
- Malvern Instruments. NanoSight NTA concentration measurement upgrade, technical note TN150515. 2015. Available from: http://www.malvern.com/en/support/resource-center/technical-notes/TN150515NTAConcentrationUpgrade.aspx
- Malloy A. Count, size and visualize nanoparticles. Materials Today. 2011;14(4):170–173.
- Gardiner C, Ferreira YJ, Dragovic RA, et al. Extracellular vesicle sizing and enumeration by nanoparticle tracking analysis. J Extracell Vesicles. 2013;2(1):19671.incl Supplements.
- Dragovic RA, Gardiner C, Brooks AS, et al. Sizing and phenotyping of cellular vesicles using Nanoparticle Tracking Analysis. Nanomedicine. 2011;7(6):780–788.
- RStudio, T. RStudio: integrated development for R. Boston, MA: RStudio, Inc.; 2015. Available from: http://www.rstudio.com
- Hothorn T, Hornik K. exactRankTests: exact distributions for rank and permutation tests. R package version 0.8-28. 2015; Available from: http://CRAN.R-project.org/package=exactRankTests
- Steppert P, Burgstaller D, Klausberger M, et al. Quantification and characterization of virus-like particles by size-exclusion chromatography and nanoparticle tracking analysis. J Chromatogr A. 2017;1487:89–99.
- Malvern Instruments. Enhancing NTA accuracy and repeatability with flow mode measurements, technical note TN160808. 2016. Available from: http://www.malvern.com/en/support/resource-center/technical-notes/TN160808FlowModeNTAEnhancements.aspx
- Xu T, Li Y, Shi Z, et al. Efficient genome editing in clostridium cellulolyticum via CRISPR-Cas9 Nickase. Appl Environ Microbiol. 2015;81(13):4423–4431.
- Krueger AB, Carnell P, Carpenter JF. Characterization of factors affecting nanoparticle tracking analysis results with synthetic and protein nanoparticles. J Pharm Sci. 2016;105(4):1434–1443.
- Tong M, Brown OS, Stone PR, et al. Flow speed alters the apparent size and concentration of particles measured using NanoSight nanoparticle tracking analysis. Placenta. 2016;38:29–32.
- van de Waterbeemd B, Zomer G, Van Den Ijssel J, et al. Cysteine depletion causes oxidative stress and triggers outer membrane vesicle release by Neisseria meningitidis; implications for vaccine development. Plos One. 2013;8(1):e54314.
- Deatherage BL, Lara JC, Bergsbaken T, et al. Biogenesis of bacterial membrane vesicles. Mol Microbiol. 2009;72(6):1395–1407.
- van der Vlist EJ, Nolte-’T Hoen ENM, Stoorvogel W, et al. Fluorescent labeling of nano-sized vesicles released by cells and subsequent quantitative and qualitative analysis by high-resolution flow cytometry. Nat Protoc. 2012;7(7):1311–1326.
- Vogel R, Willmott G, Kozak D, et al. Quantitative sizing of nano/microparticles with a tunable elastomeric pore sensor. Anal Chem. 2011;83(9):3499–3506.
- Coumans FAW, van der Pol E, Boing AN, et al. Reproducible extracellular vesicle size and concentration determination with tunable resistive pulse sensing. J Extracell Vesicles. 2014;3:25922.
- van der Pol E, Coumans FAW, Grootemaat AE, et al. Particle size distribution of exosomes and microvesicles determined by transmission electron microscopy, flow cytometry, nanoparticle tracking analysis, and resistive pulse sensing. J Thromb Haemost. 2014;12(7):1182–1192.
- Maas SL, De Vrij J, van der Vlist EJ, et al. Possibilities and limitations of current technologies for quantification of biological extracellular vesicles and synthetic mimics. J Control Release. 2015;200:87–96.