
ABSTRACT
Extracellular vesicles, including exosomes, are released by all cells, including those of the nervous system. Capable of delivering lipid, protein and nucleic acids to both nearby and distal cells, exosomes have been hypothesized to play a role in progression of many diseases of the nervous system. To date, most analyses on the role of these vesicles in the healthy and diseased state have relied on studying vesicles from in vitro sources, such as conditioned cell culture media, or body fluids. Here we have taken a critical approach to the enrichment and characterization of exosomes from human frontal cortex. This method maintains the integrity of the vesicles and their cargo, and comprehensive proteomic and genomic characterization confirms the legitimacy of the resulting extracellular vesicles as endosome-derived exosomes. This method will enable neuroscientists to acquire more detailed information about exosomes in the brain and explore the role(s) this form of intercellular communication and unique source of lipid, protein and RNA has in healthy brain function and pathogenic conditions. Furthermore, this method may have important utility in the isolation of exosomes from other tissues.
Introduction
The last decade has seen a surge of interest around small vesicles, called exosomes, released constitutively and upon induction from eukaryotic cells. Unlike many other extracellular vesicles (EVs), exosomes originate from inside the cell at the multivesicular body (also called the late endosome). Exosomes develop from portions of the limiting endosomal membrane that invaginate and bud into the lumen of the multivesicular body (MVB), where they are referred to as intraluminal vesicles (ILVs) [Citation1,Citation2]. During this process a subset of protein, RNA and lipid are sorted into these vesicles, giving ILVs a unique molecular signature and imparting important biological functions. The ILVs have two fates, degradation via the lysosome or release from the cell as exosomes upon fusion of the MVB with the plasma membrane (for reviews on exosome biogenesis and release see [Citation3,Citation4]). Once outside the cell the principal function of an exosome is cell-to-cell communication. Exosomes can transfer their message to the same cell they were released from, to neighbouring cells or distant tissues via the systemic circulation.
A wide range of physiological and pathological functions have been attributed to exosomes in the nervous system Citation[5]. For instance, a role for exosomes in neural development and neuronal activity has been demonstrated Citation[6]. In disease, exosomes have been implicated in neurodegenerative diseases such as prion, Alzheimer’s and Parkinson’s disease and amyotrophic lateral sclerosis Citation[6]. At the anatomical level, misfolded neurodegenerative disease-associated proteins, such as amyloid-beta peptide (Aβ) and tau in Alzheimer’s disease and α-synuclein in Parkinson’s disease, spread in a non-random, topographically predictable manner in the brain Citation[7]. Currently we do not understand the processes that drive the spread of disease pathology between regions of the brain that are not obviously interconnected. It has been hypothesized that exosomes may traffic misfolded protein between cells, facilitating the spread of pathology and diseases through the brain Citation[8].
Understanding the physiological and pathological roles of exosomes in the brain is a fundamental scientific objective with clinical relevance. Realization of this goal, however, has been hampered by an inability to isolate genuine exosomes from the brain for further study. Relative to the routine isolation of exosomes from extracellular fluids, such as conditioned cell culture media, blood, urine or CSF, many technical issues must be overcome to limit co-isolation of vesicles with the same physical and/or molecular properties as exosomes. Cell integrity needs to be largely maintained to minimize co-isolation of membranous particles masking as exosomes, thorough vesicle characterization needs to be undertaken to confirm exosome enrichment relative to mimetics and the vesicles need to meet the biophysical and biochemical definition of an exosome [Citation4,Citation9–Citation12].
Previously published methods call for tissue disruption via homogenization or filtration, which can compromise the extracellular environment with intracellular vesicles and exosome mimetics [Citation13,Citation14]. The membranous material isolated using these methods (and variations thereof [Citation14–Citation18]) have been called “exosomes”; however, the requirements for the definition of an exosome were not met nor were the vesicles differentiated from potentially co-isolated intra- and extracellular vesicles. As a result, there is an urgent need to devise a method that enriches for genuine endosome-derived extracellular exosomes. Only when this has been achieved can we begin to discern the physiological and/or pathological roles for neural exosomes.
Here, we report an efficient protocol for the enrichment of exosomes from human brain tissue. The vesicles were rigorously characterized and defined as exosomes based on their size, morphology, density and proteomics and genomic content, fulfilling the experimental requirements as set out by the International Society for Extracellular Vesicles to be defined as exosomes [Citation4,Citation10,Citation11].
Methods
Reagents and chemicals
Hibernate®-E Medium and Dulbecco’s phosphate-buffered saline (PBS) were from ThermoFisher, PhosSTOP (PS) & Complete Protease Inhibitor (including EDTA) (PI) and D2O were from SigmaAldrich, collagenase type 3 (Worthington #CLS-3) and RNase A from Qiagen. Chemicals for proteomics were from SigmaAldrich. The antibodies BiP and flotillin-1 were from BD Biosciences, syntenin (#ab133267) and calnexin (ab22595) from Abcam, calreticulin, VDAC, RPL5, anti-mouse and anti-rabbit HRP from Cell Signalling Technology, TSG-101 from Sigma-Aldrich and CD81 (H-121) from Santa-Cruz.
Human tissue selection and preparation
Post-mortem tissues, stored at −80°C, were obtained from the Australian Brain Bank Network, together with accompanying histopathological data to select cognitively normal control cases. Samples of frontal cortex were dissected frozen, on a clean glass surface cooled with dry ice. All procedures were approved by The University of Melbourne human ethics committee and in accordance with the National Health and Medical Research Council guidelines. Tissues were stored at −80°C until required.
Exosome enrichment from tissue
Extracting exosomes from tissue while minimizing cell lysis and exosome mimetics is dependent on gentle manipulation of the tissue to avoid cell damage. Frozen (−80οC) human neurological healthy control frontal cortex (450 mg – 1 g) was sliced lengthways (to provide a greater surface area to volume ratio) on ice using a razor blade to generate 1–2 cm long, 2–3 mm wide sections of brain . A small (~20 mg) piece was placed in PBS (with PI and PS), homogenized and placed at −80οC for later use. The remaining cut sections of tissue were weighed and transferred while partially frozen to a 50 ml tube containing 75 U/ml of collagenase type 3 in Hibernate-E (at a ratio of 800 μl per 100 mg of brain). The tissue was then incubated in a shaking water bath at 37°C for a total of 20 min. During this time the tube was mixed once by gentle inversion (after 5 min incubation), returned to the water bath for a further 10 min and then gently pipetted twice up and down (using a 25 ml Stripette) before incubating for the remaining time. The tissue was returned to ice immediately after incubation and PI/PS added to a final concentration 1 ×.
The dissociated tissue was spun at 300 × g for 5 min at 4°C, the pellet was collected (nominated as “total brain with collagenase”) in PBS (with PI/PS), homogenized and stored at −80°C for later use. The supernatant from the 300 × g was transferred to a fresh tube, spun at 2000 × g for 10 min at 4°C, then the supernatant was spun at 10,000 × g for 30 min at 4°C. The supernatant was overlaid on a triple sucrose cushion (0.6 M, 1.3 M, 2.5 M). To make the triple sucrose cushion 1 ml of 2.5 M sucrose (F4) with a refractive index 1.4532 was overlaid with 1.2 ml of 1.3 M sucrose (F3) with a refractive index between 1.3978 and 1.3958 followed by 1.2 ml of 0.6 M sucrose (F2) with a refractive index between 1.3639 and 1.3622. The supernatant from the 10,000 × g spin was overlaid onto F2, the exact volume recorded (x ml). The gradient was spun for 3 h at 180,000 × g (average) at 4°C (SW41 Beckman, ultra-clear tubes with 13.2 ml capacity). A blank gradient was made and spun at the same time as the sample containing gradient. After the spin the top of the gradient was removed and discarded (x ml – 1.2 ml = volume removed) leaving exactly 1.2 ml above F2. This was designated fraction 1 (F1). Fractions 2 and 3 were subsequently collected and the refractive index was measured to confirm the gradient and collection of fractions were successful. Each fraction was diluted with ice-cold PBS and spun at 100,000 × g (average) at 4°C (Ti 70.1 Beckman) for 1 h to pellet the vesicles. Following spin completion, the supernatant was discarded and pellets were collected in ice-cold PBS (with PI/PS). The vesicles in fractions 1–3 were characterized by a suite of techniques to determine the nature of the vesicles and meet the requirements to be called exosomes
Note – some tissue samples will not be amenable to this method. Post-mortem delay, storage time and the number of freeze-thaw cycles will negatively impact on tissue quality and result in contamination of the fractions with cellular debris and non-exosome vesicles. Immunoblotting the fractions is the best quality-control measure we have come across, with proteins such as BiP and calnexin appearing in the fractions if the tissue is heavily degraded.
Preparation of brain homogenates
Homogenates were generated using a needle and syringe. Brain tissue or the collagenase-treated 300 × g pellet in ice-cold PBS containing PI and PS were sequentially passed through an 18-gauge, 21-gauge, 23-guage and 26-gauge needle attached to a plastic syringe at least five times until a homogeneous lysate was achieved. Homogenates were sonicated on ice for 20 min and then submitted to a clarification spin.
Western blot
Brain homogenate (total and total with collagenase) and vesicle fractions were lysed [0.5% deoxycholate, 0.5% Triton X-100, 150 mM NaCl, and 50 mM Tris (pH 7.5)] and sonicated for 20 min. Brain homogenate was clarified (5 min 13,000 × g 4°C) before the protein concentration of the brain homogenate supernatant and vesicle fractions were determined by BCA assay (Pierce). Equivalent amounts of brain or vesicle proteins in Laemlli sample buffer (without reducing agent) were electrophoresed on 4–12% Bis-Tris gels (NuPage; ThermoFisher) or 4–20% Criterion© TGX stain-free precast gels (Biorad) and then transferred onto nitrocellulose membrane (Biorad). Membranes were probed with primary antibody diluted in PBS-T overnight at 4°C and then with horseradish peroxidase conjugated secondary antibody for 1 h, and immunoreactivity was detected using enhanced chemiluminescence (ECL) solutions (Biorad). To allow for visualization of total protein and ensure equal loading in the absence of an exosomal housekeeping protein, gels (Biorad) were activated by UV light to allow trihalo compounds within the gel to react with tryptophan residues of proteins in a UV-induced reaction to produce fluorescence which was visualized using a Biorad ChemiDoc™ MP imaging system upon transfer onto nitrocellulose membranes (stain-free method) or membranes were stained with ponceau S (1% (w/v) ponceau S in 5% acetic acid).
Electron microscopy
An aliquot of each fraction in PBS was fixed with 1% glutaraldehyde for 30 min or overnight at 4°C, and 6 μl was absorbed onto glow-discharged 300-mesh heavy-duty carbon-coated formvar Cu grids (ProSciTech, Kirwan, QLD, Australia) for 5 min, and excess was blotted on filter paper (Whatman, Maidstone, UK). Grids were washed twice with MilliQ water and negative stained with 2.5% uranyl acetate. Images were taken on a Tecnai G2 F30 (FEI, Eindhoven, The Netherlands) transmission electron microscope operating at 300 kV. Wide-field images encompassing multiple vesicles were captured to provide an overview of the fraction in addition to close-up images. The electron microscopy was performed at the Bio21 Advanced Microscopy Facility, The Bio21 Molecular Science and Biotechnology Institute, The University of Melbourne.
Dynamic light scattering
Vesicle size/diameter was estimated by dynamic light scattering (DLS). The mean hydrodynamic diameter of exosomes was calculated by fitting a Gaussian function to the measured size distribution. Prior to the DLS measurements, each sample was spun at 300 × g for 10 s to pellet large aggregates; 50 μl of sample at room temperature was added to a ZEN00400 cuvette and DLS measurements were conducted at 25°C using a Nano ZSP Zetasizer (Malvern Instruments Ltd., UK) operating at 633 nm and recording the back-scattered light at an angle of 175°. The sample was allowed to equilibrate for 2 min before each measurement. The light scattering was recorded for 200 s with three replicate measurements. DLS signal intensity was transformed to volume distribution, assuming a spherical shape of the exosomes, using the Malvern Instruments Ltd. software.
RNA isolation and RNase treatment
Vesicle fractions were treated with or without 0.3% Triton-X 100 and/or 10 µg/ml of RNase A (Qiagen) for 20 min at 37°C in a heat block), to digest RNA not contained within membrane vesicles. RNA in brain homogenate or the vesicle fractions was extracted using the Qiagen miRNeasy with the use of TRIzol-LS (ThermoFisher) for organic phase separation. The amount, quality and composition of isolated small RNase A treated RNA were analysed by an Agilent 2100 Bioanalyzer using Small RNA Chips (Agilent Technologies) and RNA 6000 assay to measure total RNA in whole brain samples
Small RNA deep sequencing
Small RNA libraries were constructed using 100 ng of RNA using the Ion Total RNA-Seq Kit V2 (Life Technologies, Australia) and ligated to adapters containing a unique index barcode (Ion Xpress™ RNA-Seq Barcode 1–16 Kit, Life Technologies, Australia) according to the manufacturer’s protocol. The yield and size distribution of the small RNA libraries were assessed using the Agilent 2100 Bioanalyzer™ instrument with the DNA 1000 chip (Agilent Technologies). Equally pooled libraries were prepared for deep sequencing using the Ion Chef system (Life Technologies) and sequenced on the Ion Torrent S5™ using Ion™ 540 chips (Life Technologies) and 200 bp chemistry (Life Technologies). Pre-processing of reads and removal of adapters and barcodes were performed using the Torrent Suite (v.5.0.2). Sequences were analysed for quality control (FASTQC), aligned to the human genome (HG19) using the Torrent Suite and files were transferred to the Partek Genomic Suite and Flow (Partek Incorporated, Singapore) for mapping against miRBase V.210 and Ensembl Release 75 to identify miRNA and non-coding and coding RNA species. Reads were normalized to reads per million reads (RPM). miRNAs identified with at least 10 reads were used for further analysis on the Partek Genomic suite, which included statistical analysis and hierarchical clustering. Enriched miRNA species consistently observed in exosomes (n = 3) were subjected to GO and KEGG analysis using DIANA-microT web server (http://www.microrna.gr/webServer) to identify miRNA-mRNA targets for functional and pathway analysis.
Proteomics
Samples were lysed in radioimmunoprecipitation assay (RIPA) buffer (0.1% SDS, 0.5% Na-DOC, 20 mM HEPES buffer, pH 7.5, 150 mM NaCl, containing PI and PS). The supernatant was then precipitated with ice-cold acetone at −20°C overnight before resuspension in 8 M urea (in 50 mM ammonium bicarbonate buffer). A BCA assay was carried out to determine the protein concentration and samples (containing equivalent amounts of total protein) were treated with 10 mM dithiothreitol for 30 min at 37°C followed by the addition of 55 mM iodoacetamide for 45 min at room temperature. The solution was diluted to a final concentration of 1 M urea before addition of sequencing-grade modified trypsin (Pierce) at a ratio of 1:50 (enzyme:protein) and digested overnight at 37°C. The protein digest was stopped by addition of formic acid to a final 1% v/v concentration. The peptide mix was cleaned up through solid-phase extraction (SPE) with a SepPak C18 Cartridge (Waters) as per the manufacturer’s instructions. Eluted peptides were freeze-dried before being resuspended with an equal volume with 2% acetonitrile and 0.05% TFA before analysis by mass spectrometry.
Samples were analysed by LC-MS/MS using a Q-Exactive plus mass spectrometer (Thermo Scientific) fitted with nanoflow reversed-phase HPLC (Ultimate 3000 RSLC, Dionex). The nano-LC system was equipped with an Acclaim Pepmap nano-trap column (Dionex – C18, 100 Å, 75 μm × 2 cm) and an Acclaim Pepmap RSLC analytical column (Dionex – C18, 100 Å, 75 μm × 50 cm). Typically for each LC-MS/MS experiment, 1 μl of the peptide mix was loaded onto the enrichment (trap) column at an isocratic flow of 5 μl/min of 3% CH3CN containing 0.1% formic acid for 6 min before the enrichment column was switched in-line with the analytical column. The eluents used for the LC were 0.1% v/v formic acid (solvent A) and 100% CH3CN/0.1% formic acid v/v. The gradient used was 3% B to 20% B for 95 min, 20% B to 40% B in 10 min, 40% B to 80% B in 5 min and maintained at 80% B for the final 5 min before equilibration for 10 min at 3% B prior to the next analysis. All spectra were acquired in positive mode with full-scan MS spectra from 375 to 1400 m/z at 70,000 resolution. The MS1 AGC target was 3e Citation[6] with maximum accumulation time of 50 ms. A lockmass of 445.120024 was used. The 15 most intense peptide ions with charge states ≥2–5 were isolated with an isolation window of 0.7 m/z then fragmented with normalized collision energy of 30 at 35,000 resolution. The MS2 AGC target was at 1e Citation[5] with maximum accumulation time of 120 ms. The underfill threshold was set to 2% for triggering of precursor for MS2. Dynamic exclusion was activated for 30 s. The data can be accessed in the PRIDE data repository.
Proteomic data analysis
Data were analysed using Proteome Discoverer (Thermo Scientific version 2.1) with the Sequest HT search engine coupled with Percolator against the SwissProt human database (build September 2016). Search parameters were precursor mass tolerance of 10 ppm and fragment mass tolerance of 0.05 Da. Trypsin with a maximum of two missed cleavages was used as the cleavage enzyme. Carbamidomethyl of cysteine was set as fixed modification and oxidation of methionine was set as variable modification. The Percolator results were set to reflect a maximum of 1% false discovery rate (FDR) at both the peptide and protein level with two unique peptides being required for positive identifications. The Database for Annotation, Visualization, and Integrated Discovery (DAVID) (version 6.8) was used to identify gene functional annotation terms that are significantly enriched in cellular components with the whole human genes as the background Citation[19]. DAVID calculates a modified Fisher’s exact p-value to demonstrate gene ontology, where p-values less than 0.05 after Benjamini multiple test correction were considered to be enriched in the category. A count threshold of 5 and the default value of 0.05 for the EASE (enrichment) score settings were used. GO FAT was used to minimize the redundancy of general GO terms in the analysis to increase the specificity of the terms. Venn diagrams were made using FunRich Citation[20].
Results
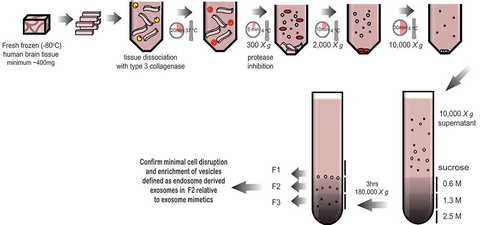
The first challenge in isolating exosomes from brain tissue, in this case neurologically healthy human frontal cortex (FC), is to break down the tissue without causing cell disruption. To achieve this, we utilized collagenase type III. This approach is commonly used to dissociate cells from human and animal tissues that are sensitive to damage, including primary tumours and metastases, brain and other tissues Citation[21]. Following digestion, the FC tissue was subject to a low centrifugal force 300 × g spin to pellet the cells, while the supernatant was subjected to series of centrifugation steps to remove cellular debris and microvesicles. Given the tendency of exosomes to aggregate when pelleted at 100,000 × g [Citation22,Citation23], which may inhibit their ability to float to density, the 10,000 × g supernatant was first applied to a triple sucrose cushion for 3 h to separate vesicles based on a density of 1.02 g/ml (fraction 1, F1), 1.08 g/ml (fraction 2, F2) or 1.17 g/ml (fraction 3, F3) prior to pelleting vesicles at 100,000 × g ().
Figure 1. Schematic of the exosome isolation protocol from solid brain tissue. Fresh frozen (−80°C) human frontal cortex was sliced with a razor blade on ice while frozen to generate 1–2 cm long, 2–3 mm wide sections. The cut sections are dissociated while partially frozen in 75 U/ml of collagenase type 3 in Hibernate-E at 37°C for a total of 20 min. The tissue is returned to ice immediately after incubation and protease and phosphatase inhibitors are added. The tissue is spun at 300 × g for 5 min at 4°C (pellet is used as the brain homogenate + collagenase control), the supernatant transferred to a fresh tube, spun at 2000 × g for 10 min at 4°C, then at 10,000 × g for 30 min at 4°C. The EV-containing supernatant is overlaid on a triple sucrose cushion (0.6 M, 1.3 M, 2.5 M) and ultracentrifuged for 3 h at 180,000 × g to separate vesicles based on density. The top of the gradient is discarded and fractions designated 1, 2 and 3 are collected and the refractive index is measured. Each fraction is further ultracentrifuged at 100,000 × g to pellet the vesicles contained in each fraction. Each preparation is validated by a combination of techniques including electron microscopy and RNA and protein analysis. Note – some tissue samples will not be amenable to this method. Post-mortem delay, storage time and the number of freeze-thaw cycles will negatively impact on tissue quality and result in contamination of the fractions with cellular debris and non-exosome vesicles.
Cells secrete many EVs into their environment. The extracellular milieu, however, can also house intracellular vesicles released because of cell death and vesicles generated because of homogenization or shear stress. These various types of vesicles cannot be distinguished based on a single characteristic. To that end, a series of criteria that represent the characterization of EVs have been outlined [Citation4,Citation9–Citation11]. Accordingly, the vesicles in fractions 1–3 were characterized by a suite of techniques including transmission electron microscopy (TEM), dynamic light scattering (DLS), immunoblotting, RNA analysis and proteomics to determine the exosome-containing fraction(s).
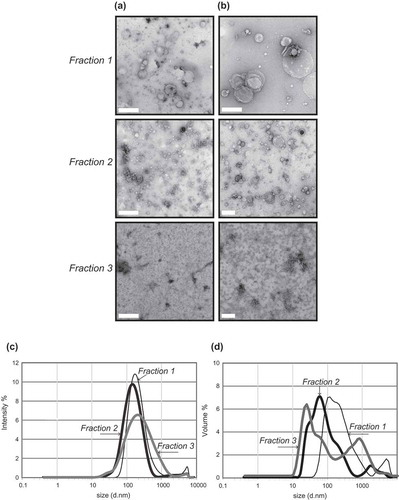
Transmission electron micrographs revealed that F1 contained large vesicles between 200 nm and 1 μm in diameter, F2 contained a heterogeneous population of vesicles between 50 nm and 200 nm in diameter, whilst F3 was enriched in small vesicles approximately 20–30 nm in size (,)). Dynamic light scattering, which takes advantage of the Brownian motion of vesicles, whose speed of motion is related to size, was used to demonstrate a distribution of vesicle size across the fractions. These data showed a similar finding to the TEM, with F1 containing the largest vesicles and F3 containing the smallest vesicles (,)). Some vesicle clumping was visualized by TEM, which was detected by DLS with peaks at or above 1000 nm in size.
Figure 2. Transmission electron microscopy (a + b) and dynamic light scattering (b + c) of frontal cortex vesicles. Vesicle fractions 1–3 were visualized by negative-staining transmission electron microscopy: (a) scale bar represents 500 nm or (b) 200 nm. TEM is representative of 5 images taken of each fraction from 30 independent human tissue samples. To further corroborate the diameter of the vesicles, fractions were subject to dynamic light scattering to determine the relative size distribution. DLS signal intensity (c) was transformed to percentage volume distribution (d). The thin black line represents F1, thick black like F2 and thick grey line F3. The analysis was performed in size mode with all measurements made in triplicate. An average of three independent tissue samples is shown.
To determine the relative enrichment of cell- to vesicle-associated proteins, brain tissue homogenate (with and without collagenase treatment) and the vesicle-containing fractions were separated by gel electrophoresis and immunoblotted. Each fraction had a unique protein profile as visualized by total protein (). The fractions were immunoblotted for proteins known to be either absent or enriched in exosomes Citation[10]. Frontal cortex brain tissue homogenate (BH) was enriched in Golgi (BiP), endoplasmic reticulum (calnexin) and mitochondrial proteins (VDAC) as expected, while these proteins were either not detectable (BiP, calnexin) or present in low levels (VDAC) in an equivalent amount of fractions 1–3 total protein (). This indicates that the fractions were not heavily contaminated with cellular debris and suggests the procedure results in minimal cell lysis. The protein RPL5 was heavily enriched in F3, suggesting the small vesicles in this fraction may be ribosomes which have previously been reported to be extraneuronal Citation[24] or non-endosome-derived high-density exosomes [Citation11,Citation25].
Figure 3. Western blot analysis of frontal cortex and associated vesicles. Equivalent protein from human frontal cortex brain homogenate without (BH) and with collagenase (BH + C) and three vesicle fractions were separated by gel electrophoresis and the total protein load was visualized using stain-free technology or ponceau S membrane staining. Immunoblotting was carried out using antibodies to BiP, calnexin, calreticulin, VDAC,, flotillin-1, syntenin, TSG101 and CD81. Immunoblots are representative of at least five independent experiments.
Co-enrichment of tetraspanins, including CD81, and the endosomal markers TSG101 and syntenin are used to distinguish exosomes from other vesicles of the same diameter and density Citation[11]. Immunoblotting of brain tissue homogenate and vesicles demonstrated that syntenin, TSG101 and CD81 were present in the fractions, with F2 highly enriched in syntenin and CD81 relative to the same concentration of brain homogenate protein. This illustrates that F2 is enriched in vesicles abundant in proteins typical of endosome-derived exosomes (). Flotillin-1 was heavily relied upon in the past as an exosome marker; however, it is now identified as a general marker of EVs, not specifically enriched in exosomes relative to other EVs Citation[11]. Indeed, the absence of endosomal enrichment in F3 together with the presence of flotillin-1 suggests that a predominantly non-endosome-derived vesicle population exists in F3, while endosome-derived vesicles are largely found in F2 (). Together these results suggest that fraction 2 contains vesicles that are consistent with the density, morphology, size and protein co-enrichment of endosome-derived exosomes.
To further establish vesicle composition proteomic analysis was performed on the fractions. Qualitative analysis was performed evaluating the presence of proteins identified in each fraction. To be certain of the presence of proteins in these fractions, we’ve employed stringent selection criteria, requiring less than 1% false discovery rate (FDR) at the peptide and protein level together with the presence of at least two peptides per protein. The distribution of identified proteins between three biological replicates is shown, in and Supplementary Table 1, and reveals a common subset of 571 proteins present in F1, 1144 in F2 and 815 in F3. Of the 1144 common proteins identified in F2, 353 proteins were unique to this fraction (Supplementary Figure 1) and include proteins involved in exosome biogenesis, the endosomal pathway and trafficking (CD63, CHMP4B, CHMP6, VPS26, VPS29, VPS50, PDC6IP, STX12, STX7, SORT1) in addition to ADAM10 and EHD1, which are newly identified small EV markers (Supplementary Table 2) Citation[11].
Figure 4. Proteomic analysis of frontal cortex vesicles. Proteins extracted from vesicle fractions 1–3 were submitted to proteomic analysis. A three-way Venn diagram of proteins (minimum two peptides detected) distributed between three independent biological replicates is shown. An average of 978 proteins were identified in F1 with 571 proteins common across the biological replicates, an average of 1567 proteins identified in F2 with 1144 common proteins and an average of 1300 proteins identified in F3 with 815 common proteins. Some exosomal proteins unique to F2 are listed. Venn diagrams were generated using the FunRich open-access tool Citation[20].
![Figure 4. Proteomic analysis of frontal cortex vesicles. Proteins extracted from vesicle fractions 1–3 were submitted to proteomic analysis. A three-way Venn diagram of proteins (minimum two peptides detected) distributed between three independent biological replicates is shown. An average of 978 proteins were identified in F1 with 571 proteins common across the biological replicates, an average of 1567 proteins identified in F2 with 1144 common proteins and an average of 1300 proteins identified in F3 with 815 common proteins. Some exosomal proteins unique to F2 are listed. Venn diagrams were generated using the FunRich open-access tool Citation[20].](/cms/asset/9906cb3b-4aed-4935-bc04-0d0021ea4707/zjev_a_1348885_f0004_oc.jpg)
Analysis of gene ontology (GO) terms Citation[26] revealed the cellular component terms “membrane-bounded vesicle”, “extracellular region”, “extracellular organelle”, “extracellular vesicle” and “extracellular exosome” are highly enriched in the three fractions, highlighting the vesicular and extracellular nature of the proteins in each fraction.
Importantly, enrichment analysis shows that the EVs isolated using this protocol are not heavily contaminated with nuclear, Golgi, ER, synaptic vesicle proteins or blood microparticles, indicating that the protocol enriches for EVs with minimal co-isolation of cellular debris or contaminating vesicles (). Together these results suggest that fraction 2 is enriched in vesicles that are consistent with endosome-derived exosomes.
Figure 5. Analysis of cellular component GO terms. The proteins common to each fraction were grouped using gene ontology (GO) terms related to cellular component analysis process using DAVID Citation[19]. The graph shows the percentage of proteins identified by mass spectrometry that fall into the designated GO category relative to the total number of proteins in the category. GO FAT was used to minimize the redundancy of general GO terms in the analysis. A modified Fisher’s exact p-value was used to demonstrate gene ontology, where p-values less than 0.05 after Benjamini multiple test correction were considered enriched in the category. A count threshold of 5 and default value of 0.05 for the enrichment score was used. Categories with enrichment greater than 5.5% are shown.
![Figure 5. Analysis of cellular component GO terms. The proteins common to each fraction were grouped using gene ontology (GO) terms related to cellular component analysis process using DAVID Citation[19]. The graph shows the percentage of proteins identified by mass spectrometry that fall into the designated GO category relative to the total number of proteins in the category. GO FAT was used to minimize the redundancy of general GO terms in the analysis. A modified Fisher’s exact p-value was used to demonstrate gene ontology, where p-values less than 0.05 after Benjamini multiple test correction were considered enriched in the category. A count threshold of 5 and default value of 0.05 for the enrichment score was used. Categories with enrichment greater than 5.5% are shown.](/cms/asset/cfefffc1-3534-4c65-9fab-e5d032872a1c/zjev_a_1348885_f0005_oc.jpg)
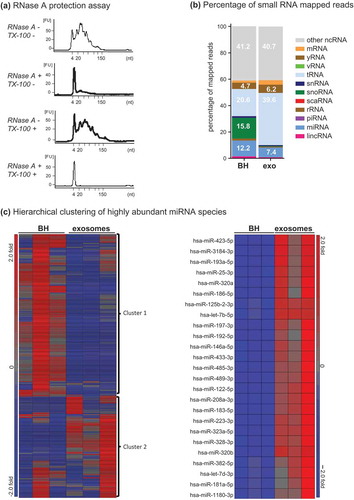
Another feature of exosomes is that they contain small RNA. The lipid exosomal membrane is known to protect the RNA encapsulated inside the vesicles from degradation by RNases, while co-isolating non-vesicular RNA is degraded [Citation9,Citation27]. To further establish that the vesicles with the correct size, morphology and protein composition of exosomes in F2 also contain small RNA, fraction 2 was treated with RNase A. Small RNA was detected in F2 following RNase A treatment, suggesting that F2 contained a population of RNase A-resistant small RNA typical of exosomes ()).
Figure 6. Small RNA analysis of Fraction 2. (a) Bioanalyser analysis of small RNA associated with Fraction 2. Fraction 2 was treated with or without Triton-X 100 and or RNase A for 30 min, RNA was extracted and analysed on a small RNA chip which was submitted for bioanalysis. miRNA is between 4 and 22 nt in length. The peak visualized at 4 nt is the marker peak. (b + c) Analysis of RNase A-treated small RNA. Raw sequencing reads were aligned to the human genome (HG19) and mapped to miRBase V.20 and other small RNA from Ensembl Release 17 followed by normalization of raw reads to reads per million (RPM). The mean of reads per miRNA (n = 3) was calculated. (b) The percentage of total reads mapped to non-coding small RNA and other RNA species identified by small RNA deep sequencing. (c) Left panel, unsupervised hierarchical clustering of highly abundant miRNA species (>10 RPM) identified in BH and F2 (n = 3, all groups). Cluster 1 miRNAs are enriched in BH and cluster 2 miRNAs are enriched in F2. Right panel, unsupervised hierarchical clustering of the top 20 miRNA detected in F2. Red indicates high expression and blue indicates low expression.
The concomitant description of the size, density, protein and RNA profile of the vesicles identified in fraction 2 demonstrates for the first time that EVs that fulfil the requirements to be classified as exosomes [Citation4,Citation10–Citation12] can be successfully enriched from human brain tissue.
To determine the relative distribution of RNA classes between brain homogenate and exosomes small RNA sequencing was carried out and data were mapped to RNA biotypes including miRNA, snoRNA, yRNA, snRNA, vRNA, rRNA and tRNA ()). For all identified RNA classes, a differential distribution was observable between brain homogenate and exosomes (F2). Whereas miRNA, snRNA and snoRNA were relatively enriched in the brain homogenate rather than the exosomes, tRNA, yRNA and mRNA represented a higher percentage in exosomes, which is in agreement with published exosomal profiles [Citation28,Citation29]. Whether the exosomal RNA profile reflects the RNA composition of the parental cells is unclear given the exosomes are probably released from a variety of glial and neuronal cell types.
miRNA are a class of small RNA that are incorporated into exosomes and confirmed to have gene-regulatory function upon transfer to recipient cells Citation[27]. Upon mapping to miRBase V21, 1071 miRNAs were identified in the dataset. Highly abundant miRNA species were then further analysed by filtering for those with greater than 10 reads assigned per million mapped reads (RPM). Unsupervised clustering of the 234 miRNA species across brain homogenate and exosomes demonstrated that exosomes displayed a unique profile compared to brain homogenate (), left panel). The majority of miRNA species (), left panel, miRNA cluster 1, 143 miRNAs) identified in the dataset were highly expressed in brain homogenate (n = 3) compared to exosomes (n = 3), while a smaller cluster (), left panel, miRNA cluster 2, 91 miRNAs) were found highly expressed in exosomes compared to brain homogenate. Cluster 2 miRNAs highly and consistently expressed in exosomes were identified (), right panel, n = 3, 25 miRNAs) and subjected to GO analysis using DIANA tools Citation[30] to predict their mRNA targets, which were then used to determine their biological roles within pathways using the Kyoto Encyclopedia of Genes and Genome (KEGG) analysis (Supplementary Table 3). Sixty-nine pathways were predicted among the genes targeted by miRNAs enriched in brain-derived exosomes (p < 0.05). The most significant were pathways implicated in cancer and neurodegeneration, with the top four pathways being proteoglycans in cancer, glioma and prion disease and ErbB signalling. These data highlight the usefulness of this method for understanding the composition and unravelling the function of neural exosomes in physiological and disease states.
Discussion
In this study, we have described an effective method to enrich for exosomes from human frontal cortex. This method provides significant advantages over previously described protocols, most notably enrichment of extracellular vesicles rigorously characterized and defined as exosomes.
Exosomes are packaged with a subset of proteins and nucleic acids before being released into the extracellular environment, where their stable lipid membrane prevents the degradation of the exosomal contents [Citation4,Citation31]. Exosomes are biologically important for two reasons: (i) they contain a selection of bioactive molecules which provide a snapshot of parental cell homeostasis and (ii) they are key players in intercellular (cell-to-cell) communication, i.e. exosomes released by cells can be taken up by neighbouring cells, the contents of which can signal to alter the recipient cell’s metabolism Citation[4]. Exosome-mediated intercellular communication is hypothesized to drive both physiological and pathological processes in the central nervous system. This has been impossible to demonstrate in the absence of a protocol enabling researchers to enrich for genuine exosomes from tissue. Previous methods utilizing mouse [Citation13,Citation17,Citation18,Citation32,Citation33], macaque Citation[16] or human [Citation14,Citation15] tissue have subjected the tissue to filtering [Citation13,Citation16], vortexing Citation[15], blending and/or homogenization [Citation13,Citation16]. These cell-disruption techniques reduce the purity of exosomes in the extracellular fluid/matrix by contamination with intracellular vesicles and exosome mimetics Citation[10]. Exosomes share many physical and/or molecular properties with intracellular, synaptic and extracellular vesicles and also exosome mimetics generated by filter extrusion of tissue and cells. This can make separation between vesicles challenging and requires researchers to rigorously characterize their vesicle population through a suite of techniques to demonstrate the presence of exosomes and rule our potential confounders Citation[10]. This was not done previously [Citation13,Citation14,Citation16–Citation18,Citation32,Citation33]. We now demonstrate that exosome enrichment from brain tissue is possible and reveal the potential biological significance through proteomic and genomic profiling.
Proteomic profiling identified proteins associated with neurodegeneration including tau, the amyloid precursor protein, SOD-1 and α-synuclein. Using the method described here we can begin to determine whether Aβ and tau in Alzheimer’s disease, α-synuclein in Parkinson’s disease and SOD-1 in amyotrophic lateral sclerosis spread via exosomes in the brain.
A unique combination of small RNA species was detected in the brain-derived exosomes. Six of the most abundant miRNA identified are members of the top 40 miRNAs in human brain (miR-125b, miR-181, miR-192, miR-320a and let-7b and let-7d) Citation[34]. In pathological conditions the expression of exosomal small RNA may elucidate the role of exosomes in disease pathobiology. In this regard miRNA abundant in CSF exosomes in glioma (miR223, miR-181, miR-125, miR-423) [Citation35–Citation37] and miRNA implicated in neurodegeneration (miR-186, miR-25, miR-223, miR-320, miR323, miR-146a) [Citation38–Citation41] were enriched in brain-derived exosomes relative to brain homogenate. Future studies of exosomes from different brain regions and cell types may provide information about regional abnormalities, region-specific pathobiology and identification of markers that would enable detection of brain-derived exosomes in blood or other tissues in cross-region intercellular communication.
The EV field is still in its infancy, with current reference markers not sufficient to enable isolation of a pure exosome population or differentiation between subpopulations of exosomes – which would allow a more precise analysis of their respective function. While the method described here does not isolate a pure exosome population, it does enrich for vesicles that meet the current guidelines Citation[10] and the more recently recognized characteristics of exosomes [Citation9,Citation11].
This protocol provides a tool to begin to unravel the complexity of intercellular communication in the brain, between brain regions and possibly cell types. This method will be valuable for exploring the complexity of the cellular microenvironment in the brain. It could enable new therapeutic strategies by helping to identify factors responsible for the transport of proteins, lipids or RNA essential for disease development and improve our understanding of the fundamental mechanisms of intercellular trafficking in the nervous system.
Supplemental Material
Download Zip (22.8 MB)Acknowledgements
This work was supported by grants from the National Health and Medical Research Council (GNT1041413 and GNT1002349 to AFH; 628946 to CLM, KJB, and AFH). LJV is supported by the Cooperative Research Centre (CRC) for Mental Health; BJS is the recipient of a Melbourne Research Scholarship from The University of Melbourne and supported by the CRC for Mental Health. We thank Fairlie Hinton and Geoffrey Pavey from the Victorian Brain Bank, Keyla Perez from The Florey Institute of Neuroscience and Mental Health and Professor Roberto Cappai from The University of Melbourne.
Disclosure statement
No potential conflict of interest was reported by the authors.
Supplemental data
Supplemental data for this article can be accessed here.
Additional information
Funding
Related Research Data
References
- Harding C, Heuser J, Stahl P. Receptor-mediated endocytosis of transferrin and recycling of the transferrin receptor in rat reticulocytes. J Cell Biol. 1983;97:1–13 .
- Pan BT, Teng K, Wu C, et al. Electron microscopic evidence for externalization of the transferrin receptor in vesicular form in sheep reticulocytes. J Cell Biol. 1985;101:942–948.
- Kowal J, Tkach M, Thery C. Biogenesis and secretion of exosomes. Curr Opin Cell Biol. 2014;29:116–125.
- Colombo M, Raposo G, Thery C. Biogenesis, secretion, and intercellular interactions of exosomes and other extracellular vesicles. Annu Rev Cell Dev Biol. 2014;30:255–289.
- Rajendran L, Bali J, Barr MM, et al. Emerging roles of extracellular vesicles in the nervous system. J Neurosci. 2014;34:15482–15489.
- Kramer-Albers EM, Hill AF. Extracellular vesicles: interneural shuttles of complex messages. Curr Opin Neurobiol. 2016;39:101–107.
- Braak H, Braak E. Neuropathological stageing of Alzheimer-related changes. Acta Neuropathol. 1991;82:239–259.
- Brettschneider J, Tredici KD, Lee VM, et al. Spreading of pathology in neurodegenerative diseases: a focus on human studies. Nat Rev Neurosci. 2015;16:109–120.
- Cheng L, Sharples RA, Scicluna BJ, et al. Exosomes provide a protective and enriched source of miRNA for biomarker profiling compared to intracellular and cell-free blood. J Extracell Vesicles. 2014;3. DOI:10.3402/jev.v3.23743.
- Lotvall J, Hill AF, Hochberg F, et al. Minimal experimental requirements for definition of extracellular vesicles and their functions: a position statement from the International society for extracellular vesicles. J Extracell Vesicles. 2014;3:26913.
- Kowal J, Arras G, Colombo M, et al. Proteomic comparison defines novel markers to characterize heterogeneous populations of extracellular vesicle subtypes. Proc Natl Acad Sci U S A. 2016;113:E968-E977.
- Hill AF, Pegtel DM, Lambertz U, et al. ISEV position paper: extracellular vesicle RNA analysis and bioinformatics. J Extracell Vesicles. 2013;2:22859.
- Perez-Gonzalez R, Gauthier SA, Kumar A, et al. The exosome secretory pathway transports amyloid precursor protein carboxyl-terminal fragments from the cell into the brain extracellular space. J Biol Chem. 2012;287:43108–43115.
- Gallart-Palau X, Serra A, Sze SK. Enrichment of extracellular vesicles from tissues of the central nervous system by PROSPR. Mol Neurodegener. 2016;11:41.
- Banigan MG, Kao PF, Kozubek JA, et al. Differential expression of exosomal microRNAs in prefrontal cortices of schizophrenia and bipolar disorder patients. PLoS One. 2013;8:e48814.
- Yelamanchili SV, Lamberty BG, Rennard DA, et al. MiR-21 in extracellular vesicles leads to neurotoxicity via TLR7 signaling in SIV neurological disease. PLoS Pathog. 2015;11:e1005032.
- Dinkins MB, Dasgupta S, Wang G, et al. Exosome reduction in vivo is associated with lower amyloid plaque load in the 5XFAD mouse model of Alzheimer’s disease. Neurobiol Aging. 2014;35:1792–1800.
- Asai H, Ikezu S, Tsunoda S, et al. Depletion of microglia and inhibition of exosome synthesis halt tau propagation. Nat Neurosci. 2015;18:1584–1593.
- Huang Da W, Sherman BT, Lempicki RA. Systematic and integrative analysis of large gene lists using DAVID bioinformatics resources. Nat Protoc. 2009;4:44–57.
- Pathan M, Keerthikumar S, Ang C-S, et al. FunRich: an open access standalone functional enrichment and interaction network analysis tool. Proteomics. 2015;15:2597–2601.
- Freshney RI. Culture of animal cells: a manual of basic technique and specialized applications. 6th ed. Hoboken, NJ: Wiley-Blackwell; 2010.
- Thery C, Amigorena S, Raposo G, et al. Isolation and characterization of exosomes from cell culture supernatants and biological fluids. Curr Protoc Cell Biol. 2006. Chapter 3, Unit 3 22. DOI:10.1002/0471143030.cb0322s30
- Linares R, Tan S, Gounou C, et al. High-speed centrifugation induces aggregation of extracellular vesicles. J Extracell Vesicles. 2015;4:29509.
- Court FA, Hendriks WT, MacGillavry HD, et al. Schwann cell to axon transfer of ribosomes: toward a novel understanding of the role of glia in the nervous system. J Neurosci. 2008;28:11024–11029.
- Willms E, Johansson HJ, Mäger I, et al. Cells release subpopulations of exosomes with distinct molecular and biological properties. Sci Rep. 2016;6:22519.
- Cheung, K. H., Keerthikumar S, Roncaglia P.et al. Extending gene ontology in the context of extracellular RNA and vesicle communication. J Biomed Semantics. 2016;7:19.
- Valadi H, Ekström K, Bossios A, et al. Exosome-mediated transfer of mRNAs and microRNAs is a novel mechanism of genetic exchange between cells. Nat Cell Biol. 2007;9:654–659.
- Van Balkom BW, Eisele AS, Pegtel DM, et al. Quantitative and qualitative analysis of small RNAs in human endothelial cells and exosomes provides insights into localized RNA processing, degradation and sorting. J Extracell Vesicles. 2015;4:26760.
- Bellingham SA, Coleman BM, Hill AF. Small RNA deep sequencing reveals a distinct miRNA signature released in exosomes from prion-infected neuronal cells. Nucleic Acids Res. 2012;40:10937–10949.
- Vlachos IS, Zagganas K, Paraskevopoulou MD, et al. DIANA-miRPath v3.0: deciphering microRNA function with experimental support. Nucleic Acids Res. 2015;43:W460–W466.
- Andaloussi SE, Mager I, Breakefield XO, et al. Extracellular vesicles: biology and emerging therapeutic opportunities. Nat Rev Drug Discov. 2013;12:347–357.
- Pituch KC, Moyano AL, Lopez-Rosas A, et al. Dysfunction of platelet-derived growth factor receptor alpha (PDGFRalpha) represses the production of oligodendrocytes from arylsulfatase A-deficient multipotential neural precursor cells. J Biol Chem. 2015;290:7040–7053.
- Iguchi Y, Eid L, Parent M, et al. Exosome secretion is a key pathway for clearance of pathological TDP-43. Brain. 2016;139:3187–3201.
- Shao NY, Lo C-Z, Su S-Y, et al. Comprehensive survey of human brain microRNA by deep sequencing. BMC Genomics. 2010;11:409.
- Adlakha YK, Saini N. Brain microRNAs and insights into biological functions and therapeutic potential of brain enriched miRNA-128. Molecular Cancer. 2014;13:1–18.
- Li, S., Zeng A, Hu Q. et al. miR-423-5p contributes to a malignant phenotype and temozolomide chemoresistance in glioblastomas. Neuro Oncol. 2016. DOI:10.1093/neuonc/now129
- Akers JC, Ramakrishnan V, Kim R, et al. miRNA contents of cerebrospinal fluid extracellular vesicles in glioblastoma patients. J Neurooncol. 2015;123:205–216.
- Cosin-Tomas M, Antonell A, Llad? A, et al. Plasma miR-34a-5p and miR-545-3p as early biomarkers of Alzheimer’s disease: potential and limitations. Mol Neurobiol. 2016. DOI:10.1007/s12035-016-0088-8
- Reddy, P. H., Tonk S, Kumar S. et al. A critical evaluation of neuroprotective and neurodegenerative MicroRNAs in Alzheimer’s disease. Biochem Biophys Res Commun. 2016. DOI:10.1016/j.bbrc.2016.08.067
- Kim J, Yoon H, Chung D-E, et al. miR-186 is decreased in aged brain and suppresses BACE1 expression. J Neurochem. 2016;137:436–445.
- Grasso M, Piscopo P, Confaloni A, et al. Circulating miRNAs as biomarkers for neurodegenerative disorders. Molecules. 2014;19:6891–6910.