
ABSTRACT
MicroRNAs are small gene-regulatory RNAs that are found in various biological fluids, including milk, where they are often contained inside extracellular vesicles (EVs), like exosomes. In a previous study, we reported that commercial dairy cow’s milk microRNAs resisted simulated digestion and were not exclusively associated with canonical exosomes. Here, we report the characterization of a milk EV subset that sediments at lower ultracentrifugation speeds and that contains the bulk of microRNAs. Milk EVs were isolated by differential ultracentrifugation and Iodixanol density gradient (IDG), and analysed for (1) microRNA enrichment by reverse transcription and quantitative polymerase chain reaction (RT-qPCR), and (2) EV-associated proteins by Western blot. Milk EVs were characterized further by dynamic light scattering (DLS), density measurements, fluorescent DiR and RNA labelling, high-sensitivity flow cytometry (HS-FCM), transmission electron microscopy (TEM), proteinase K and RNase A assay, and liquid chromatography tandem-mass spectrometry (LC-MS/MS). We found that the bulk of milk microRNAs (e.g., bta-miR-125b, bta-miR-148a, etc.) sediment at 12,000 g and 35,000 g. Their distribution pattern was different from that of exosome-enriched proteins, but similar to that of several proteins commonly found in milk fat globule membranes (MFGM), including xanthine dehydrogenase (XDH). These low-speed ultracentrifugation pellets contained cytoplasm-enclosing phospholipid bilayered membrane vesicles of a density comprised between 1.11 and 1.14 g/mL in Iodixanol. This milk EV subset of ~100 nm in diameter/~200 nm hydrodynamic size resisted to proteinase K digestion and protected their microRNA content from RNase A digestion. Our results support the existence of a milk EV subset pelleting at low ultracentrifugations speeds, with a protein coating comparable with MFGM, which contains and protects the bulk of milk microRNAs from degradation. This milk EV subset may represent a new EV population of interest, whose content in microRNAs and proteins supports its potential bioactivity.
Introduction
MicroRNAs are short (~22 nucleotides), non-coding RNAs [Citation1] that play an essential role in post-transcriptional gene regulation through Argonaute (Ago)-mediated degradation or translational repression of complementary messenger RNAs (mRNAs) [Citation1,Citation2]. Ubiquitous in plants and animals [Citation3], they are estimated to regulate expression of ~60% of human genes [Citation4], implicating them in virtually all aspects of human health, from brain patterning [Citation5] to fat storage [Citation6], hematopoiesis [Citation7] and immunity [Citation8]. Usually found and active within the cells that produce them, these small RNAs are also found outside the cells, in a number of biological fluids – including plasma, saliva, urine, tears and breast milk – where they are suggested to play a role in cell–cell communication [Citation9–Citation12]. MicroRNAs are relatively stable in these fluids, mainly owing to their association with different kinds of particles, including Ago2 ribonucleoprotein complexes and extracellular vesicles (EVs) [Citation11,Citation13].
In 2012, Zhang et al. [Citation14] suggested that the dietary absorption of microRNA miR-168a from rice had functional ramifications on gene expression in mouse liver. Although this study was rejected at first [Citation15], and plant microRNA transfer remains controversial [Citation16,Citation17], recent evidence suggests that mammalian microRNAs from hen eggs [Citation18,Citation19], cooked beef [Citation20] or milk [Citation21–Citation27] products may resist food processing, and thus could be transferred between species and exert biological activities. The most promising data supporting the concept of dietary microRNA transfer have come from the study of milk [Citation21,Citation24,Citation26–Citation30]. Found in large quantities in raw milk [Citation31,Citation32] and in commercial milk preparations [Citation22,Citation31], extracellular microRNAs are often associated with exosomes [Citation10,Citation22,Citation24,Citation26,Citation29,Citation33,Citation34], a specific EV subtype formed by invagination of multivesicular bodies (MVB) [Citation35,Citation36]. Exosomes are often defined as small EVs (1) ranging between 30 and 150 nm in diameter [Citation37,Citation38], (2) with densities in sucrose comprised between 1.10 and 1.19 g/mL [Citation39] and (3) associated with different “exosome-enriched” proteins, such as Tumour susceptibility gene 101 (TSG101), ALG-2 interacting protein X (ALIX), Heat Shock Protein 70 (HSP70) or Cluster of differentiation 63 (CD63) [Citation40].
Milk exosomes and associated microRNAs have been shown to survive conditions highly detrimental for nucleic acids [Citation23,Citation32], and recent studies have described the transport of cow’s milk exosomes across both human and murine gut epithelial cells in vitro [Citation26]. Feeding mice with bovine milk exosomes attenuated the effects of rheumatoid arthritis in vivo [Citation27]. Notably, the ingestion of bovine milk by adult humans induced a physiologically relevant increase in circulating levels of bovine microRNAs [Citation21], whereas bovine milk exosomes can be taken up by human macrophages and tweak those towards the pathogenic Th17 lineage [Citation24,Citation32,Citation41]. We have previously reported that milk microRNAs resist degradation in a computer-controlled in vitro digestion system simulating human gastrointestinal (GI) tract conditions [Citation22]. The resistance of milk microRNAs was in part conferred by their association with canonical “exosomes” that pellet at high ultracentrifugation speeds (i.e. >100,000 g) [Citation33,Citation42]. However, most (~80%) commercial milk microRNAs that resisted digestion were associated with undefined particles of hydrodynamic sizes larger than exosomes and that sedimented at lower ultracentrifugation speeds (i.e. 12,000 g and 35,000 g). A study previously reported the existence, in breast milk, of multiple EV subtypes heterogeneous in size and composition [Citation43]. It is worth noting that most studies on milk EVs include a pre-clearing step of at least 10,000 g [Citation21,Citation24,Citation26,Citation32,Citation33,Citation39,Citation43,Citation44] in order to discard cells, cell fragments and EVs “larger” than the ones pelleting at 100,000 g.
In the present study, we analysed these often-discarded milk EVs and identified a subset of milk EVs that pellet at low ultracentrifugation speeds and carry the bulk of microRNAs in commercial dairy cow’s milk.
Material and methods
Dairy milk samples
For all experiments, we used commercially available, filtered, skimmed dairy milk tetrapacks with different expiration dates as biological replicates (Lactantia PurFiltre brand; product: http://www.lactantia.ca/food_product/lactantia-purfiltre-skim-milk/) bought at a local grocery store in Quebec City, QC.
Dairy milk EV isolation and enrichment
EVs were isolated by following a previously described protocol [Citation33], with slight modifications. We diluted 100 mL milk samples with 1 volume of 2% sodium citrate (in MilliQ water) that had been filtered with 0.22 µm membrane microfilters (Corning, Montreal, QC, CA) to avoid casein gel formation upon high-speed ultracentrifugation [Citation22,Citation43]. The samples were then subjected to successive differential ultracentrifugation steps at 12,000 g, 35,000 g, 70,000 g and 100,000 g for 1 h each at 4°C in a Sorvall® WX TL-100 ultracentrifuge, equipped with a T-1250 rotor (ThermoFisher, Burlington, ON, CA). After each step, the pellets were resuspended in 1 mL of 0.22 µm filtered sterile phosphate-buffered saline (PBS) containing 100 nM ethylenediaminetetraacetic acid (EDTA) pH 7.4, and either (1) stored at −80°C for subsequent pellet analysis or (2) immediately diluted in 3 volumes of sterile PBS containing 100 nM EDTA, prior to layering on top of a 10–40% Iodixanol (Optiprep; Sigma-Aldrich, Oakville, ON, CA; in PBS) density gradient (IDG). The loaded IDGs were centrifuged at 100,000 g for 18 h at 4°C. After removing the loaded volume (i.e. 4 mL supernatant), twelve 1 mL fractions were collected from the top to bottom of the IDG. An IDG loaded only with 0.2 µm filtered sterile PBS was used as control for these experiments (empty IDG). The refractive index (RI) of each fraction was measured using a refractometer (ABBE 3-L; Bausch & Lomb, Rochester, NY, USA), allowing density (D) calculations of the IDG fractions using the following formula: D = 3.3411 × RI – 3.4584.
Particle hydrodynamic size measurements
The hydrodynamic size of the isolated EVs was measured using a Zetasizer Nano-ZS dynamic light scattering (DLS) measurement system (Malvern, Montréal, QC, CA). One hundred microlitres of each sample was loaded in an ultraviolet (UV) cuvette micro (BRAND, Essex, CT, USA), and the particle hydrodynamic diameter was measured at 4°C. Each data point from each replicate represents an average of three measurements of 12–17 runs (automatic set) each.
MicroRNA detection by reverse transcription and quantitative PCR (RT-qPCR)
Total RNA was extracted from 250 μL of milk pellets or IDG fractions using TRIzol-LS® reagent (Invitrogen, Carlsbad, CA, USA), suspended in nuclease-free water and subjected to DNase 1 treatment by following the manufacturer’s recommendations (Invitrogen). For all RNA extractions, an exogenous synthetic control microRNA (C. elegans let-7-as mutated, 2 fmol; Integrated DNA Technologies Inc., Redwood City, CA, USA) was diluted in TRIzol-LS and spiked in at the TRIzol-LS homogenization step, as previously described [Citation22,Citation45]. Total RNA was reverse-transcribed (RT) using HiFlex miSCRIPT® RTII kit (Qiagen, Toronto, ON, CA). The complementary DNA (cDNA) was diluted 1/10 before detection of mature bta-miR-223, bta-miR-125b, bta-miR-2478, bta-miR-148a, bta-miR-29b and bta-miR-151-3p by SYBR Green quantitative PCR (qPCR) using the miScript® Primer Assay kit (Qiagen) and commercially available oligonucleotides specific to each microRNA (respectively, miScript Primer Assay MS00051065, MS00050197, MS00053088, MS00050498, MS00053382, MS00050533; Qiagen). The results are displayed as cycle of quantification (Cq) expression relative to synthetic let-7-AS mutated spike-in (2–ΔCq) and reported over the total Cq expression within all the pellets or all the fractions of the IDGs (relative proportion in each pellet/fraction compared with all the pellets/fractions), following ISEV recommendations for study of liquid samples with no reporter genes [Citation40]. For absolute quantifications, standard curves of synthetic bta-miR-223 and bta-miR-125b were constructed and used for copy number determination, as described previously [Citation22]. We used the synthetic let-7-as mutated microRNA spike-in as a qPCR normalizer to calculate and consider the efficiency of RNA isolation, as reported previously [Citation22,Citation46,Citation47].
Double-stranded RNA labelling and DiR membrane staining
Ninety-nine microlitres of IDG fractions was incubated with 1 µL of SYTO® RNASelect™ Green Fluorescent RNA specific stain (ThermoFisher) or lipophilic carbocyanine DiOC18 (DiR, ThermoFisher), diluted in 0.22 µm filtered PBS (respectively, at 500 nM and 1 µM final concentration), at 37°C for 30 min protected from light on a black Greiner CELLSTAR® chimney well plate. After incubation, 100 µL of 0.22-µm filtered PBS buffer was added to each well. Readings were then taken at the DiR and SYTO specific emission wavelength (respectively 780 and 525 nm) using the Infinite® 200 PRO reader (Tecan Trading AG).
Protein extraction and measurements
Proteins in all liquid samples were precipitated from the leftovers of the RNA isolation step, following the TRIzol-LS® reagent (Invitrogen) manufacturer’s protocol with slight modifications. Briefly, total RNA was isolated from TRIzol-LS homogenized samples, and the leftover (interphase and organic phase) was mixed with 300 µL of ethanol, incubated at room temperature and centrifuged for 5 min at 2000 g, 4°C, to pellet DNA. The supernatant was placed in new 2 mL tubes, and 2 volumes of isopropanol were added to each samples and centrifuged at 13,000 g for 10 min, 4°C. Pellets were rinsed thrice with guanidine hydrochloride (Sigma-Aldrich) following TRIzol-LS manufacturer recommendations, and then twice with absolute ethanol before being resuspended in a buffer containing 8 M urea, 50 mM ammonium bicarbonate, 25 mM sodium deoxycholate, 1.5 mM phenylmethylsulfonyl fluoride (PMSF, Sigma) and one complete Tablet Mini EDTA-free Protease Inhibitor Cocktail Tablets (Roche Diagnostics, Laval, QC, CA) per 10 mL suspension buffer.
Western blot analysis
Twelve microlitres of each pellet or IDG fractions proteins was mixed 6:1 with 6× protein loading buffer (0.15 M Tris pH 6.8, 1.2% SDS, 30% glycerol, 1.8% bromophenol blue) with 15% β-mercaptoethanol, except for the tetraspanin CD63 for which loading buffer was devoid of β-mercaptoethanol (non-denaturing conditions). Then, the samples were heated at 95°C for 10 min and subjected to 10% (wt/vol) sodium dodecyl sulfate (SDS)-polyacrylamide gel electrophoresis (PAGE). The separation was performed at a constant amperage of 25 mA. Proteins were transferred to 0.22 µm pore size polyvinylidene fluoride (PVDF) membranes (EMD Millipore, Billerica, MA, USA). In order to analyse multiple proteins simultaneously on the same protein load, the membranes were blocked with skimmed milk solution (5% powdered milk in Tris buffer saline with 0.1% Tween 20) for 1 h at room temperature and cut into strips around the expected size of the monitored proteins, followed by primary antibody incubation overnight at 4°C using previously validated mouse monoclonal anti-TSG101 (clone 4A10, ab83; Abcam, Cambridge, MA, USA), anti-HSP70 (cat. no. 554,243; Becton Dickinson (BD) Pharmingen), anti-ALIX (clone 3A9, sc-53,538; Santa Cruz Biotechnologies, Dallas, TX, USA), anti-Cytochrome C (ahp-2304; Bio-Rad Laboratories), anti-CD63 (ab193349, Abcam), anti-XDH (sc-20,991; Santa Cruz Biotechnologies), anti-Actin (clone AC-40, Sigma-Aldrich), anti-Ago2 (aa498-812, LS-C311886/74,906, LifeSpan Biosciences, Seattle, WA, USA) and anti-Lysosome-associated membrane protein 2 (LAMP2) (H4B4, sc-18,822; Santa Cruz Biotechnologies). The antibodies were diluted in Tris-buffered saline (TBS) with 0.1% Tween-20 (TBST) and 5% skimmed milk. Membranes were then washed five times in TBST (1 × 30 min, 1 × 15 min, 3 × 5 min), incubated for 1 h with horseradish peroxidase (HRP)-conjugated secondary anti-mouse or anti-rabbit antibodies (respectively NEF812001EA or NEF822001EA; Perkin Elmer, Waltham, MA, USA) diluted in TBST-milk solution at 1:10,000 for the anti-rabbit-HRP and 1:30,000 for the anti-mouse-HRP antibodies. Membranes were washed five times in TBST (1 × 30 min, 1 × 15 min, 3 × 5 min) and once (1 × 10 min) with TBS devoid of tween. Western blots were revealed using 3 mL per membrane of an enhanced chemiluminescence (ECL) prime HRP substrate from GE Healthcare (Amersham, Buckinghamshire, UK). The chemiluminograms were obtained using the C-DiGit ECL detection device (LI-COR, 12 min detection, high sensivity setting), and densitometric analyses were performed as previously reported [Citation11]. Briefly, band density was quantified using ImageJ software and reported over the total intensity in all the samples to show the relative proportion of the corresponding protein band in each pellet/fraction, following ISEV recommendations [Citation40] and thereby allowing replicate averaging.
Transmission electron microscopy (TEM)
Ten microlitres of the fractions of interest from the density gradient (F7 and F8) or total milk was diluted 1:1000 with sodium cacodylate buffer (0.1 M, pH 7.3) and layered on a Nickel/Formvar grid for 1 min. The grid was then rinsed with deionized water, and EVs were negatively stained with 1.5% aqueous uranyle acetate. The grid was then rinsed again with deionized water and dried on filter paper before observation by TEM (80 kV, JEOL® electron microscope 1230, JEOL®, Akishima, Tokyo, Institut de biologie intégrative et des systèmes, Microscopy Platform at Université Laval, Quebec City, QC). Multiple pictures were taken at multiple spots, and those deemed to be representative of all the events observed within the samples were selected.
LC-MS/MS
Twelve microlitres of proteins extracted from milk pellets or proteinase K-treated IDG fractions was subjected to 10% (wt/vol) SDS-PAGE. After the run, the gels were stained with Coomassie blue (Coomassie Brilliant Blue R-250 Staining Solution; Bio-Rad Laboratories, Hercules, CA, USA; 0.2%) in 40% methanol and 10% acetic acid for 1 h and destained overnight with a destaining solution composed of 10% methanol and 10% glacial acetic acid.
Protein digestion
Bands of interest were extracted from gels and placed in 96-well plates and then washed with water. Tryptic digestion was performed on a liquid handling robot (MultiProbe, Perkin Elmer) according to the manufacturer’s specifications. Briefly, proteins were reduced with 10 mM DTT and alkylated with 55 mM iodoacetamide. Trypsin digestion was performed using 126 nM of modified porcine trypsin (Sequencing grade, Promega, Madison, WI) at 37°C for 18 h. Digestion products were extracted using 1% formic acid, 2% acetonitrile followed by 1% formic acid, 50% acetonitrile. The recovered extracts were pooled, vacuum-centrifuge-dried and then resuspended into 12 µL of 0.1% formic acid, and 5 µL was analysed by mass spectrometry. Protein digestion and mass spectrometry analyses were performed by the Proteomics Platform of the CHU de Québec Research Center (Quebec, Qc, Canada).
Mass spectrometry
Peptide samples were analysed by online reverse-phase nanoscale capillary liquid chromatography (nanoLC) with an Ekspert NanoLC425 (Eksigent, Dublin, CA, USA) coupled to a 5600+ mass spectrometer (AB Sciex, Framingham, MA) equipped with a nanoelectrospray ion source. Peptide separation took place on a nano cHiPLC columns 3u, 120A C18, 15 cm × 0.075 mm internal diameter. Peptides were eluted with a linear gradient from 5 to 35% solvent B (acetonitrile, 0.1% formic acid) in 35 minutes, at 300 nL/min. Mass spectra were acquired using a data-dependent acquisition mode using Analyst software version 1.7. Each full scan mass spectrum (400 to 1250 m/z) was followed by collision-induced dissociation of the 20 most intense ions. Dynamic exclusion was set for a period of 3 s and a tolerance of 100 ppm.
Database searching
MGF peak list files were created using Protein Pilot version 5.0 software (Sciex). MGF sample files were then analysed using Mascot (Matrix Science, London, UK; version 2.5.1). Mascot was set to search the complete proteome Bos taurus database (32,422 entries) assuming the digestion enzyme trypsin. Mascot was searched with a fragment ion tolerance of 0.1 Da and a parent ion tolerance of 0.1 Da. Carbamidomethyl cysteine was specified in Mascot as fixed modification, whereas deamidation of asparagine and glutamine as well as oxidation of methionine were specified as variable modification.
Criteria for protein identification
Scaffold (version Scaffold_4.8.3, Lincoln, NE, USA; Proteome Software Inc., Portland, OR) was used to validate MS/MS based peptide and protein identifications. Peptide identifications were accepted if they could be established at greater than 55.0% probability to achieve an FDR less than 1.0% by the Scaffold Local FDR algorithm. Protein identifications were accepted if they could be established at greater than 99.0% probability to achieve an FDR less than 1.0% and contained at least two identified peptides. Protein probabilities were assigned by the Protein Prophet algorithm [Citation48]. Proteins that contained similar peptides and could not be differentiated based on MS/MS analysis alone were grouped to satisfy the principles of parsimony. For each band, the most probable proteins were designed based on their unique peptide count, the percentage coverage and whether their molecular weight corresponds to the band they were isolated from.
EV labelling and HS-FCM analysis
To assess the presence of cytoplasmic esterases, we fluorescently labelled EVs’ cytosol using an esterase-dependent fluorescent dye. To this end, 2 µL of each IDG fraction was diluted in 98 µL of 0.2 µm filtered sterile PBS (Gibco, ThermoFisher scientific) containing the fluorescent CellTracker™ deep red dye [Citation49] (C34565; Life Technologies, ThermoFisher Scientific) at a final concentration of 1 µM, for 20 min at 37°C, in the dark, following the manufacturer’s recommendations.
For EV characterization using flow cytometry, we used an improved high-sensitivity flow cytometer (HS-FCM) Canto II special order product equipped with a small particle option (BD Biosciences, San Jose, CA, USA) [Citation50,Citation51]. The forward scatter (FSC) on this dedicated equipment is coupled to a photomultiplier tube (PMT) with a 488 nm solid-state, 100 mW output blue laser (rather than the conventional 20 mW) and includes a 633 nm HeNe, 20 mW output red laser and a 405 nm solid-state diode, 50 mW output violet laser. This HS-FCM is also equipped with FSC-PMT and a Fourier optical transformation unit, meant to reduce the background/noise ratio and increase the angle of diffusion, thus enhancing the detection of small-diameter particles. The HS-FCM tracking performance was monitored daily before all analyses using the BD cytometer setup and tracking beads (BD Biosciences). Size estimation was determined using silica beads of 100, 500 and 1000 nm in diameter (Kisker Biotech GmbH & Co., Steinfurt, Germany) as a reference, while volume quantification was performed by adding a known number of 3 µm polystyrene microspheres to each sample (BD Biosciences), as previously described [Citation50]. Gates for CellTracker positive EVs were set by using a pool of all IDG fractions labelled with this fluorescent dye.
Proteinase K and RNase protection assays
One hundred microlitres of IDG fractions F7 and F8 from the 12,000 g and 35,000 g pellets was subjected to proteinase K digestion by following a previously described protocol [Citation52]. Briefly, milk EVs were incubated with proteinase K (0.05 µg/µL, AM2546; Ambion, Foster City, CA, USA) for 10 min at 37°C. Phenylmethylsulfonyl fluoride (PMSF, 5 mM; Sigma-Aldrich) was then added and the incubation followed for an additional 10 min at room temperature; further proteinase K inhibition was ensured by heating the samples at 90°C for 5 min. Subsequently, milk EVs were incubated with RNase A (final concentration 0.5 µg/µL; RNase A/T1 mix, EN0551, ThermoFisher Scientific) for 20 min at 37°C. Then, the samples were homogenized with TRIzol-LS before protein and RNA extraction. Control samples were subjected to the same treatments, but by replacing all solutions with PBS. A microRNA (cel-let-7as mutated) spike-in diluted in PBS was subjected to the same treatments and was not detectable by qPCR, which confirmed RNase A activity.
Statistical analysis
All statistical analyses were performed using Prism 7 (GraphPad Software, Inc., La Jolla, CA, USA). Experiments were conducted at least in biological triplicates (three commercial milk tetrapacks with different expiration dates), and all the data were tested for normality (Shapiro–Wilk normality test). Unless stated otherwise, results are reported as mean ± standard deviation (SD) of the mean (n = 3), and analysed with a row-matched (RM) one-way analysis of variance (ANOVA) with Geisser–Greenhouse correction coupled with a post-hoc comparison of the means with Tukey’s correction, where a p value below 0.05 was considered statistically significant. For correlation analysis, Pearson’s linear regression method was used with a p value below 0.05 considered statistically significant.
Results
Bulk of milk microRNAs sediment at low ultracentrifugation speeds
Milk contains abundant amounts of microRNAs that are unlikely to resist the high RNase activity in milk [Citation23,Citation53] and digestion [Citation22] without protection or carriage by protein complexes or EVs. Using an in vitro digestion device and differential ultracentrifugation approach ()), we previously reported that commercial milk microRNAs resisted digestion, and two of those (i.e. bta-miR-223 and bta-miR-125b) sedimented in the majority at 12,000 g and 35,000 g [Citation22]. This prompted us to further analyse these low speed ultracentrifugation pellets for the presence of milk EVs. We focused our investigations on a panel of six microRNAs ()), including bta-miR-223 and bta-miR-125b for which we replicated our previous work [Citation22] with fresh milk samples and increased the number of replicates (n = 6) ()). We observed that most of these microRNAs were significantly more enriched in the 12,000 g and 35,000 g ultracentrifugation pellets. Some of these microRNAs (i.e. bta-miR-125b, bta-miR-148a, bta-miR-151-3p and bta-miR-2478) had very similar distribution profiles ()). On the contrary, bta-miR-29b had a peculiar profile with no specific enrichment pattern between the pellets ()). A first glimpse at total RNA supported peculiar enrichment of all RNAs in the 12,000 g and 35,000 g pellets (Supplementary Figure 1A). Preliminary results suggested that the distribution profiles observed for this panel of microRNAs were quite comparable with another commercial milk brand, but different from unprocessed, raw cow’s milk (Supplementary Figure 1B-1D).
Figure 1. The bulk of milk microRNA pellets at low ultracentrifugation speeds and microRNAs distribution do not correspond to EV-associated proteins profiles. (a) Commercial milk preparation (100 mL) was subjected to successive differential ultracentrifugation steps at 12,000 g, 35,000 g, 70,000 g and 100,000 g for 1 h each at 4°C, and each pellet was kept and suspended in 1 mL PBS containing EDTA, as detailed in the Material and methods section. (b) Each sample (250 µL) was mixed with 750 µL of TRIzol-LS reagent for total RNA isolation and subsequent RT-qPCR detection of microRNAs bta-miR-223, bta-miR-125b, bta-miR-148a, bta-miR-29b, bta-miR-151-3p and bta-miR-2478. The experiment was performed three times with three different milk samples, and each quantification level in each pellet was reported on the sum of all the pellet (total) and expressed as a percentage of the total (mean ± SD; n = 3 or 6). The statistical significance of the differences observed was assessed by an RM one-way ANOVA with Geisser–Greenhouse correction coupled with a post hoc comparison of the means with Tukey’s correction with p < 0.05 considered significant. *p < 0.05, **p < 0.01, ****p < 0.0001. (C) The leftover proteins from the previous RNA isolation procedure were precipitated following the manufacturer’s protocol and solubilized in 100 µL of protein suspension buffer as described in the Material and methods section. Twelve microlitres of each pellet proteins was loaded in a 10% acrylamide gel for Western blot detection of TSG-101, ALIX, HSP70 and CD63 EV-associated proteins. The signal intensity of each band was measured using ImageJ software, and each band intensity was reported on the sum of all the bands from the four pellets (total) for each of the three repetition performed and is expressed as a percentage of the total (mean ± SD; n = 3). The most representative of the replicate is displayed above each quantification diagram. The statistical significance of the differences observed was assessed by row-matched one-way ANOVA with Tukey post-hoc test with p < 0.05 considered significant. *p < 0.05, **p < 0.01, ****p < 0.0001.
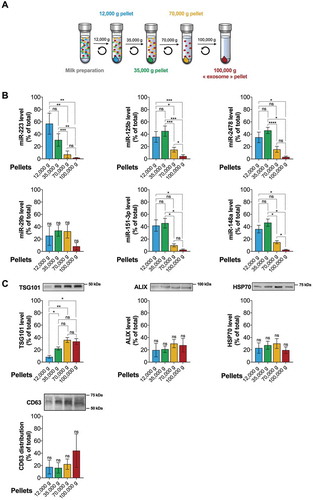
Altogether, our results suggest that the bulk of commercial milk microRNAs, and RNAs, pellet at low ultracentrifugation speeds (i.e. 12,000 g and 35,000 g).
Bulk of milk microRNAs cofractionate with a specific subset of EV-associated proteins
MicroRNAs in milk are often linked to EVs adressed as “exosomes” in the literature [Citation21,Citation24,Citation26,Citation32,Citation33,Citation39,Citation43,Citation44] and associated with several EV-enriched proteins [TSG101, ALIX, CD63, CD9, CD81, milk fat globule (MFG)-EGF factor 8 protein (MFGE8), etc.]. Therefore, we looked for the enrichment of some of these specific EV-associated proteins in the different milk pellets by Western blot ()). These data include previously reported TSG-101, ALIX and HSP70 profiles [Citation22] for which we replicated our work with fresh milk and enhanced our analysis with a semi-quantitave approach and statistical comparison of the pellets. We observed that TSG-101 was significantly empoverished in the 12,000 g pellet. No peculiar distribution pattern could be traced for ALIX, HSP70 and CD63 proteins ()).
As a whole, these results suggest that the majority of milk microRNA are possibly associated with a TSG-101low, ALIX+, HSP70+, CD63 low’s milk EV subset pelleting at ultracentrifugation speeds lower than for canonical milk “exosomes” (i.e. lower than 100,000 g).
Identification of XDH as a marker of a new microRNA-enriched EV subset in commercial dairy cow’s milk
To further characterize these microRNA-enriched EVs present in commercial dairy cow’s milk, we isolated EVs sedimenting at 12,000 g, 35,000 g, 70,000 g and 100,000 g from 100 mL of milk, and analysed them in parallel. We isolated the proteins from each ultracentrifugation pellet and looked for specific protein distribution patterns by SDS-PAGE and Coomassie blue staining ()). The bands whose enrichment was higher in the first pellets were cut and analysed by LC-MS/MS. Curing of the proteomic dataset identified, for each band, the most enriched proteins of the expected molecular weight for which this approach yielded the highest coverage (% coverage) ()). The entire dataset is available as Supplementary File 2. The proteins found in those bands include MFG-associated proteins Fatty acid synthase (FASN), Xanthine dehydrogenase/oxidase (XDH), Butyrophilin subfamily 1 member A1 (BTN1A1), Heat shock 70 kDa protein 8 (HSPA8), Perilipin (PLIN2), MFGE8, Isocitrate dehydrogenase (IDH1) and Rab GDP dissociation inhibitor beta (GDI2) ()). We found also enrichment of cytoplasmic Actin in the last band ()).
Figure 2. Identification of XDH as a protein marker associated with the bulk of microRNAs in commercial milk. (a) Proteins extracted from the pellets obtained by ultracentrifugation of 100 mL of commercial milk were analysed by SDS-PAGE and Coomassie blue staining. The bands corresponding to those enriched in low-speed ultracentrifugation pellets were excised and submitted to LC-MS/MS analysis. The most enriched proteins in each pellet are displayed, based on the number of exclusive peptide count, percentage coverage of the protein and molecular weight match to the respective band. (b) The XDH protein content of the four ultracentrifugation pellets was assessed by Western blot (most representative of the three replicates, upper panel) and quantitative densitometry (lower panel) analyses (mean ± SD; n = 3). Western blot results are expressed as a percentage (%; mean ± SD) of the XDH proteins present in the four pellets. The statistical significance of the differences observed was assessed by an RM one-way ANOVA with Geisser–Greenhouse correction coupled with a post-hoc comparison of the means with Tukey’s correction with p < 0.05 considered significant. *p < 0.05, **p < 0.01, ****p < 0.0001. (c) Positive Pearson correlation between bta-miR-125b, bta-miR-148a, bta-miR-151-3p and bta-miR-2478 and XDH levels among the four ultracentrifugation pellets. Bta-miR-223 and bta-miR-29b had distribution profiles different from XDH. Correlations were performed using the Pearson correlation method, with p values <0.05 considered statistically significant (n = 3).
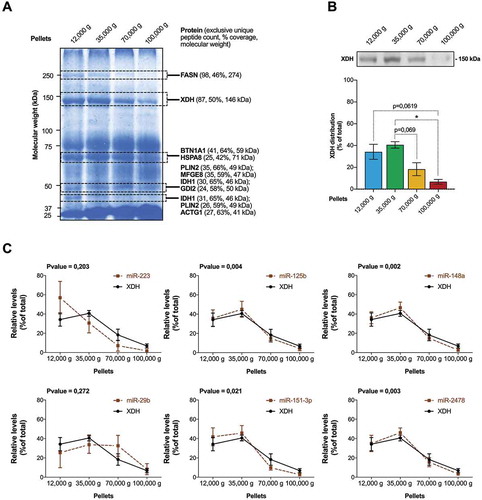
Next, we focused our investigations on XDH, for which a reliable antibody against the bovine protein was available. The analysis of its distribution profile by Western blot unveiled a peculiar enrichment in the first ultracentrifugation pellets and very low levels in the 100,000 g pellet ()). We performed correlation analyses between XDH distribution profiles and the milk microRNAs ()), and observed that XDH expression levels positively correlated with those of bta-miR-125b, bta-miR-151-3p, bta-miR-148a and bta-miR-2478 (p < 0.05, Pearson’s correlation analysis, )). There was no correlation between XDH and bta-miR-223 or bta-miR-29b distribution profiles ()).
Together, these results suggest an association between milk microRNAs and XDH, possibly through their encapsulation in the same XDH+ milk EV subtype. The different profiles and correlations observed between XDH and bta-miR-223 or bta-miR-29b argue for the presence of more than one EV subtype in commercial milk.
Most cow’s milk microRNAs are associated with 12,000 g and 35,000 g EVs of discrete density
A simple way to push forward investigations on these possible microRNA-enriched milk EVs is by using an Iodixanol density gradient approach [Citation22]. We loaded pellets obtained from 100 mL of milk on 10–40% IDG, and after 18 h of centrifugation at 100,000 g, we collected 12 IDG fractions ()). We then analysed those fractions for their microRNA (,)) and double-stranded RNA ()) content, as well as their density ()). Most of the microRNA bta-miR-223 ()) and bta-miR-125b ()) was detected in fractions F6–F9 (89–93% of total) of the 12,000 g and 35,000 g pellets, with the majority in fractions F7 and F8 (70–80% of total) (–)). The microRNA distribution among the fractions obtained from the 12,000 g and 35,000 g pellets was very similar.
Figure 3. Cow’s milk microRNAs are contained within 12,000 g and 35,000 g EVs of discrete density. (a–c) Pellets obtained after centrifugation at 12,000 g and 35,000 g were resuspended, loaded on a 10–40% IDG and ultracentrifuged at 100,000 g for 18 h. Twelve 1 mL fractions (F1–F12) were collected. (a–b) Enrichment of bta-miR-223 and bta-miR-125b in fractions of discrete density was revealed after RNA extraction and absolute quantitation of bta-miR-223 (a) and bta-miR-125b (b) by RT-qPCR. (c) An aliquot of each fraction was incubated with SYTO RNAselect dye prior to fluorescence measurements, which suggests that other RNA species may be present in fractions F1–F4 of lower density. (d) The density of the collected fractions was calculated from refractive index measurements. Results are expressed as a percentage (%; mean ± SD) (n = 3) of microRNA expression (a–b) or SYTO fluorescence (c) in each fraction compared with total expression or fluorescence in all the IDG fractions.
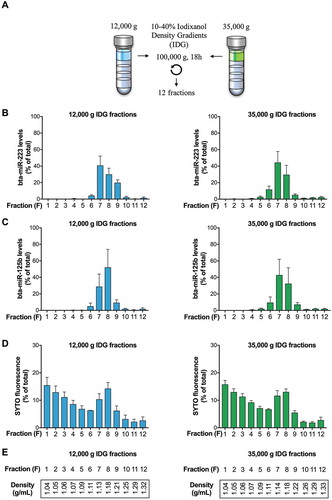
Fluorescent labelling of total RNA using SYTO® RNASelect™ dye [Citation54] revealed the highest levels of RNA in the first, low-density fractions (fractions F1–F4, )), with a peak corresponding to the fractions that are the most enriched in microRNAs (Fractions F7 and F8; )). These data support the microRNA enrichment of fractions F7 and F8, and suggest that other RNA species are present in 12,000 g and 35,000 g EVs of lower density.
With fractions F7 and F8 being the most enriched in microRNAs (,)) and having a density ranging from 1.13 to 1.18 g mL−1 in Iodixanol ()), our results suggest that microRNAs may be associated with EVs of discrete density and possibly with more than one subset of EVs [Citation39].
Protein composition of the 12,000 g and 35,000 g IDG fractions is compatible with the existence of multiple EV subsets in commercial milk
We analysed, by Western blot, all the IDG fractions obtained from the 12,000 g and 35,000 g pellets for their enrichment in EV-associated proteins. The Western blot analyses were performed as in and by following the ISEV guidelines on protein-enrichment quantification [Citation40]. shows the representative chemiluminograms for each protein (,)) and the averaged band intensities measured for each band obtained from three distinct experiments (,)). A complete table, with the averaged intensities and SDs, is available as Supplementary File 3. Our initial analysis revealed the presence of CD63 in the 12,000 g pellet, IDG fractions F6–F9 (density, 1.13–1.22 g mL−1), with a particular enrichment in fractions F7 and F8 (,)). A similar profile was observed for the 35,000 g pellet, where the IDG fractions F6 and F7 were the most enriched in CD63 (,)). Detection of the tetraspanin CD63 in the IDG fractions F6–F9, of both the 12,000 g and 35,000 g pellets, argues for the presence of membranes and thus EVs [Citation55].
Figure 4. The composition protein of the 12,000 g and 35,000 g pellets is compatible with the existence of multiple EV subsets in milk pellets. (a–b) Proteins from each fraction (F1–F12) of each IDG (12,000 g and 35,000 g) were analysed by Western blot for the presence of, or enrichment in, (1) the membrane protein CD63, (2) the cytoplasmic protein Actin, (3) the EV-associated proteins TSG101, ALIX, HSP70 and LAMP2, (4) XDH, (5) the microRNA effector protein Ago2 and (6) the mitochondrial protein CYC1. Representative chemiluminograms for each protein of interest in the 12,000 g (a) and 35,000 g (b) IDG. (c–d) For each protein of interest, specific band intensities were quantitated in each IDG (panel C, 12,000 g IDG; panel D, 35,000 g IDG), and the results were expressed as a percentage (%) of the band intensities in all the IDG fractions and represented as a heatmap (percentage of total, n = 3 experiments).
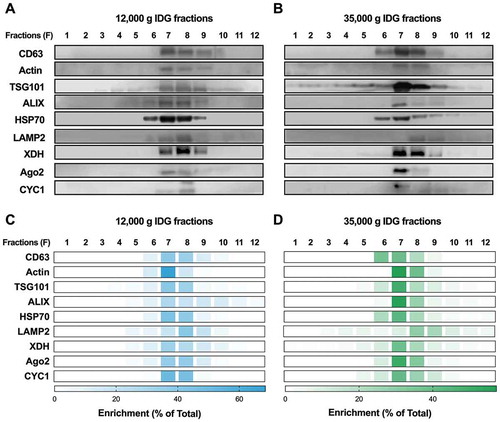
We also documented the enrichment of actin, mainly in fractions F7–F9 for the 12,000 g IDG (,)) and in fractions F7–F8 of the 35,000 g IDG (,)), which supports the presence of cytoplasmic components in these fractions and confirms the results obtained by mass spectrometry ()).
We probed for the presence of EV-associated proteins TSG101, ALIX, HSP70 and LAMP2 in these samples. TSG101 was detected mainly in fractions F7 and F8 (). Very similar profiles were obtained for ALIX and HSP70, with fraction F7 containing most of TSG101, ALIX and HSP70 proteins (). The profile of LAMP2, however, was slightly different, as it was found mainly in the denser fractions F8 and F9 of the 35,000 g pellet (,)). Together, these results suggest the existence of at least two EV subsets among the EVs sedimenting at 12,000 g and 35,000 g, which differ mainly in their LAMP2 enrichment.
Initially identified as a protein marker of the microRNA-enriched EVs sedimenting at 12,000 g and 35,000 g, XDH was detected in fractions F7–F9, but mainly in fractions F7 and F8 (). The distribution of XDH among the fractions of both IDG closely resembles that of the EV-enriched proteins TSG101, ALIX and HSP70, and supports the existence of a subset of milk EVs bearing a protein signature close to MFG membranes (MFGM).
In view of the specific microRNA expression patterns that we observed, we decided to monitor the microRNA effector protein Argonaute 2 (Ago2) in these two IDG. Most of the Ago2 protein was present in fractions F7–F9 in both IDG, with the majority cofractionating with microRNAs within fractions F7 and F8 (). These findings argue for the presence of EVs containing Ago2•microRNA complexes within these fractions.
Finally, to determine if the IDG fractions are likely to contain mitochondria or apoptotic bodies, we monitored the distribution of cytochrome C (CYC1) protein. Whereas the CYC1 profile in the 12,000 g IDG looked very similar to the profiles of XDH and exosome-enriched protein (,)), it was more diffuse in the 35,000 g IDG (,)). The possible detection of CYC1 in the IDG fractions suggests that they may contain mitochondria, apoptotic bodies or, at least, fragments of these, thereby supporting the diversity of EVs present in the milk 12,000 g and 35,000 g pellets.
Together, these Western blot analyses revealed the presence of membranes, cytoplasm and exosome-enriched proteins within fractions F7–F9, with F7 and F8 being the fractions that are the most enriched in all of these components. Knowing that those fractions are highly enriched in microRNA, these results are compatible with the presence of a microRNA-enriched EV subset sedimenting at 12,000 g or 35,000 g, and suggests co-pelleting of different milk EVs by our ultracentrifugation approach.
MicroRNA-enriched milk EVs have a hydrodynamic diameter of ~200 nm and have a phospholipidic membrane
We then went for physical and chemical characterization of this specific milk EV subset. We analysed the IDG fractions derived from the 12,000 g and 35,000 g by dynamic light scattering to determine the size of the milk microRNA-enriched EVs. Most of the 12,000 g ( and 35,000 g ()) IDG fractions contained EVs that averaged ~200–230 nm in hydrodynamic diameter, except for fractions F8 and F9, which contained slightly larger particles (,-)). We observed very small SDs from the three biological replicates that we analysed in fraction F7 of the 12,000 g IDG and fraction F6 of the 35,000 g IDG, suggesting that the EV population in these fractions is more uniform in size than in the other fractions. Fractions F10–F12 contained no or very few EVs (,)).
Figure 5. The presence of EVs in low-speed ultracentrifugation pellets of IDG fractions is supported by detection of particles with hydrodynamic diameter of ~200 nm and of phospholipids. (a–b) DLS; Zetasizer Nano S) analysis of the 12,000 g (a) and 35,000 g (b) milk IDG fractions revealed the presence of particles with a hydrodynamic diameter of ~200 nm. DLS data are shown as mean ± SD (n = 3). (c) IDG fractions were stained with the near-infrared lipophilic fluorescent dye DiR and analysed for the presence of lipid membranes by monitoring fluorescence intensity at 780 nm. (d) Photograph of the IDG without DiR (left) or with DiR (right) showing the staining of the fractions F7–F8 ring with DiR (blue) (see arrow).
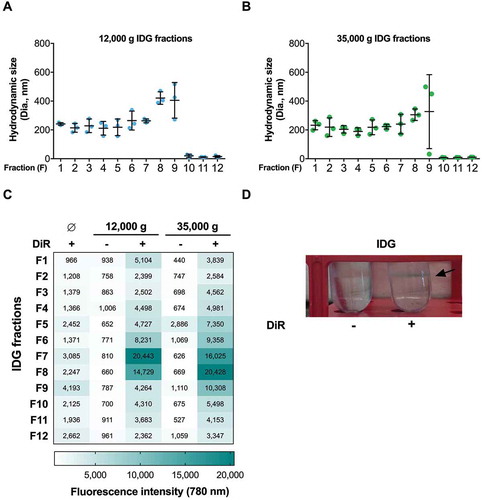
The DLS attenuator position (ATTN) data suggested a relatively high EV enrichment in IDG fractions F7 and F8 (), for the ATTN may negatively correlate with EV enrichment, up to a certain range of concentrations [Citation56].
To further confirm the vesicular nature of the events observed by DLS, we incubated all IDG fractions with the lipophilic carbocyanine DiOC18 (DiR), a dye that is weakly fluorescent near-infrared when in water, but emits high fluorescence and is photostable when incorporated into membranes [Citation57]. When incubated with DiR, fractions F6–F9 displayed the highest fluorescence levels (60% of total fluorescence within both IDGs), with fractions F7 and F8 being the most fluorescent () and Supplementary File 4). DiR alone in IDG (no EVs), used as a negative control, displayed very low fluorescence, as unlabelled EVs. The observable ring of proteins/EVs, otherwise white within non-labelled IDG fractions, turned to blue when milk pellets were labelled with DiR prior to IDG ultracentrifugation ()). Knowing that this ring corresponds mostly to F7 and F8 samples, this observation supports the enrichment of grouped phospholipids or phospholipid membranes within these fractions. Together, these results support the existence of a microRNA-enriched milk EV subset that pellets at 12,000 g and 35,000 g, and that are ~200 nm in hydrodynamic diameter.
Cytoplasmic esterase activity supports the presence of cytoplasm and EVs in IDG fractions F7 and F8
We determined the presence of cytoplasm in IDG fractions by monitoring cytoplasmic esterase activity. To exclude the possibility of detecting products from potential soluble esterases [Citation58], we chose to use a high-sensitivity flow cytometer (HS-FCM) [Citation59]. All IDG fractions were incubated with a deep red dye (CellTracker™), which fluoresces depending on cytoplasmic esterase activity. After setting the gates for fluorescence using a pool of all IDG fractions ()), we analysed each IDG fraction for esterase activity.
Figure 6. High-sensitivity flow-cytometry analysis of fractionated IDG revealed the peculiar enrichment of EVs in the 12,000 g pellet. (a) A pool of all the IDG fractions was labelled with deep red CellTracker fluorescent dye and the gates set for fluorescent EV (green) detection, compared with unlabelled EVs (Red) and CellTracker in PBS-loaded (empty) IDG fractions (PBS, Blue). (b–c) Each IDG fraction of the 12,000 g (b) and 35,000 g (c) was labelled and analysed for the presence of esterase-positive EVs. Results are expressed as a count of events (mean ± SD; n = 3). (d) After setting the gates for size, using beads of known diameter, we analysed the CellTracker positive population in each fraction to determine the approximate size of the observed events. (e–f) Representative results obtained for IDG fractions F7 and F8 from 12,000 g (e) and 35,000 g (f) EVs are displayed. A green colour represents CellTracker positive events. The associated quantification results are available as Supplementary File 5.
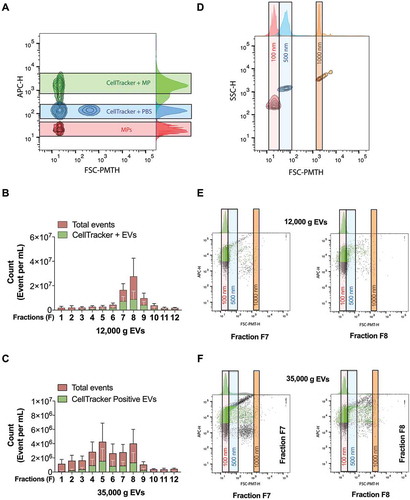
When compared with any other fraction, both fractions F7 and F8 from the 12,000 g IDG had the highest count of events (), in red). For the 35,000 g IDG, the number of events was lower and spread from fractions F4–F8 (), in red). Whereas 47–79% of the events found in the 12,000 g IDG fractions F7 and F8 were positive for the CellTracker™ dye, 48–57% of the particles found in the 35,000 g IDG fractions F4–F8 were positive for esterase activity (,), in green and Supplementary File 5).
Together, these results suggest that, among all the events detected (red) within fractions F7–F8 for 12,000 g IDG, most are likely to have esterase activity (green), and thus cytoplasm, which would define them as EVs (i.e. particles with phospholipidic membranes and cytoplasm, in green). For 35,000 g IDG, it is only a small proportion of all the events that have cytoplasmic esterases and thus cytoplasm. The relatively higher number of EVs (in green) in the 12,000 g IDG, compared with the 35,000 g IDG, may explain the relative microRNA enrichment in the 12,000 g pellet.
After setting size gates using silica beads of known sizes ()), we observed, for both IDGs, that the vast majority of the CellTracker positive EVs (>80%, n = 3) had dimensions close to 100 nm diameter beads, and thus close to the detection limit of our device (,), and Supplementary File 5). These results suggest that most of the EVs in the 12,000 g and 35,000 g pellets are likely esterase-positive EVs close to ~100 nm in diameter.
TEM analysis revealed that milk microRNA-enriched EVs are ~100 nm in diameter
Techniques that are based on photons and light scattering, as previously described in this study (DLS and HS-FCM), are usually biased when it comes to EV size determination, since proteins and proteoglycans decorating them may contribute to their size, and that the beads used for calibration or gating have an RI higher than EVs [Citation60]. To circumvent this limitation and to visualize the milk EVs, we analysed commercial dairy cow’s milk as well as IDG fractions by TEM (). In milk, we observed mainly two different subpopulations of EVs (~100–300 nm in diameter), which exhibit either relatively high or low density to electrons. Whereas a distinctive membrane delimits the latter type of clearer EVs, the former type of EVs seems to be surrounded by a dark hallo, suggesting the presence of membrane components retaining high levels of uranyl acetate ()).
Figure 7. Transmission electron microscopy (TEM) analysis revealed that milk microRNA-enriched EVs are ~100 nm in diameter. (a–c) Whole milk (a) or IDG fractions F7 and F8 from 12,000 g (b) and 35,000 g (c) pellets were diluted 1:1000 in sodium cacodylate buffer, and layered on nickel-formvar grids for observation by TEM, after staining with aqueous uranyle acetate. The arrows indicate EVs.
We performed similar TEM analyses of fractions F7 and F8 of both 12,000 g and 35,000 g IDGs, as they are the most enriched in EV-associated proteins, phospholipids, cytoplasm and microRNAs. These two fractions were found to contain high levels of round EVs with sizes ranging between 60 and 160 nm (,)). Interestingly, all EVs observed seemed surrounded by a dark halo, which may be conferred by an electon dense glycosylated protein coating. Notably, the coated EVs were clustered, suggesting that the coating proteins may bridge milk EVs together. Contaminant protein aggregates were more abundant in fractions F8 compared with F7, limiting observations and suggesting that some of the proteins previously detected in fraction F8 are possibly not inside EVs. On the contrary, the relatively low protein background level in fraction F7 argues for a direct association between the various proteins detected, like XDH, and these EVs.
MicroRNAs found in IDG fractions F7 and F8 resist proteinase K and RNase A digestion, and are likely contained within a distinct subset of EVs
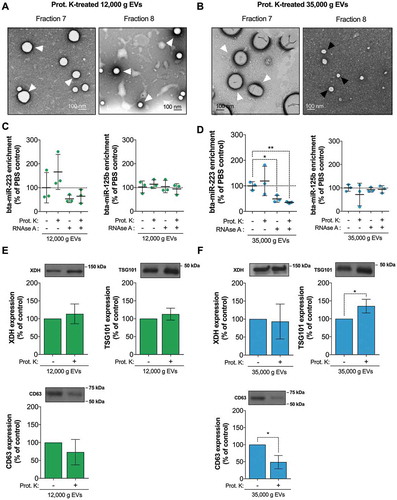
We postulated that the halo observed around these milk EVs is composed of glycosylated proteins, which may favour EV cluster formation and make them more resilient to digestion [Citation22] and more prone to sediment at low centrifugation speed. To verify this hypothesis, we subjected IDG fractions F7 and F8 to proteinase K digestion, and observed EV shape and clustering by TEM. Proteinase K digested EVs were individualized, and their shape and sizes were much better defined (,)). In the 12,000 g IDG, fraction F7 seemed to contain EVs with a relatively wide range in sizes (~50–200 nm in diameter) compared with fraction F8, which contained relatively smaller EVs ()). However, both fractions displayed EVs surrounded by electron-dense halo. For the 35,000 g IDG, the EVs contained in fraction F7 were much larger and electron-dense than those present in fraction F8 ()). Together, these results support the presence of more than one kind of EVs in milk 12,000 g and 35,000 g pellets.
Figure 8. Proteinase K and RNase A sensitivity of the microRNA-enriched 12,000 g and 35,000 g EVs and associated microRNAs. (a–b) Fractions F7 and F8 from the 12,000 g and 35,000 g IDGs were subjected to proteinase K digestion and analysed by transmission electron microscopy (TEM). (c–d) A pool of IDG fractions 7 and 8 from both 12,000 g and 35,000 g IDGs were submitted to proteinase K and/or RNase A digestion, and microRNA bta-miR-223 and bta-miR-125b levels were determined by RT-qPCR. MicroRNA levels are expressed as fold change versus the untreated control (mean ± SD, n = 3) and analysed by comparison with the untreated control (–) by two-tailed paired t-test. (e–f). The leftover proteins from the previous RNA isolation procedure were precipitated following the manufacturer’s protocol and loaded in a 10% acrylamide gel for Western blot detection of TSG-101, XDH and CD63 EV-associated proteins. The signal intensity of each band was measured using ImageJ software. Each band intensity was reported on its non-digested counterpart and is expressed as a percentage of non-treated control (mean ± SD; n = 3). The most representative of the three replicate is displayed above each quantification diagram. The statistical significance of the differences observed was assessed by comparison with the untreated control (–) by a two-tailed paired t-test, *p < 0.05, **p < 0.01.
DLS analysis of the proteinase K digested EVs did not reveal any differences between the digested and the non-digested samples, compared with the non-treated controls for both 12,000 g and 35,000 g pellets (Supplementary Figure 3A and 3B).
In both 12,000 g and 35,000 g EVs, the level of bta-miR-125b was not affected by proteinase K digestion or the subsequent RNase A treatment, or the combination of both enzymes (,), right panels). However, bta-miR-223 levels were more affected by RNase digestion (,), left panels), suggesting that bta-miR-223 may be less protected than bta-miR-125b. These results, along with previous observations, support the existence of different milk EV subsets, differentially enriched in microRNAs and with different resilience against deleterious conditions.
To determine which proteins might have resisted proteinase K digestion, and thus likely within or associated with these EVs, we analysed a pool of proteinase K-treated IDG fraction F7 and F8 proteins by SDS-PAGE and Coomassie blue staining (Supplementary Figure 3C and 3D). We observed multiple protein bands resisting proteinase K digestion, including one of ~150 kDa in molecular weight (i.e. similar to XDH). We then ran a series of Western blots and observed that TSG-101 and XDH resisted proteinase K digestion (,)), confirming previous observations on Coomassie blue stained gels and supporting their encapsulation in milk EVs. This is consistent with the disappearance of these EV-associated proteins when proteinase K treatment is combined with 0.5% SDS (Supplementary Figure 3E). Notably, levels of TSG-101 seemed to increase by 10–40%, suggesting a better accessibility of this protein for extraction after proteinase K digestion ()). Interestingly, CD63 levels decreased by 30–50% upon proteinase K treatment (,)), suggesting that CD63, which is found mainly outside the membrane, was likely shaved off 12,000 and 35,000 g EVs by proteinase K.
Together, our results support the encapsulation of the bulk of milk microRNAs in a specific EV subset enriched in XDH and pelleting at low ultracentrifugation speeds.
Discussion
In the present study, we performed a detailed analysis of the pellets obtained after low speed ultracentrifugation of commercial milk (i.e. 12,000 g and 35,000 g). Our results suggest that these pellets contain the bulk of microRNAs, which are associated with a new milk EV subset of ~100 nm in diameter. These EVs contain several EV-associated proteins and functional enzymes (cytoplasmic esterases), and share common morphological characteristics (size, density, shape) with the well-described milk “exosomes” that pellet at higher ultracentrifugation speeds. Moreover, these new milk EVs are resilient to proteinase K digestion and are mostly associated with immune-regulatory proteins, such as MFGE8, butyrophilin and XDH, often found in MFGM and known for their immunity-modulating functions [Citation61].
MicroRNAs in milk are highly resistant to physical and chemical conditions deleterious for RNA molecules [Citation23,Citation32], which may be partly due to their association with “exosomes” [Citation22]. However, we found that, in commercial milk, very few microRNAs were associated with canonical “exosomes”, which is the most widely studied and recognized EV subset that carries microRNAs between cells [Citation62] and can be isolated by a final ultracentrifugation step at +100,000 g [Citation39,Citation63,Citation64]. Knowing that exosomes and ectosomes can exert differential biological activities, like differentially promoting cancer cell proliferation [Citation65], one should be as careful with terminology as for the isolation method when studying EVs [Citation43]. For example, a previous study used the term “exosomes” to define a population of milk EVs depleted of EV subsets that pelleted at 12,000 g after 30 min [Citation66]. Another study specifically isolated EVs sedimenting at high ultracentrifugation speeds with more developed methodologies and gave those the same name [Citation34]. The term “exosome” is used to define EVs containing one or more EV-enriched proteins (e.g., TSG-101, ALIX, HSP70, CD63), but most of these proteins are associated with the majority of EVs, not necessarily to one subset in particular [Citation67]. The focus on “exosomes” pelleting at 100,000 g, with much fewer considerations for the preparative centrifugation conditions (pre-clearing step), have led researchers to readily discard EVs sedimenting at low ultracentrifugation speeds [Citation21,Citation24,Citation26,Citation32,Citation33,Citation39,Citation43,Citation44] and pass by the relative heterogeneity of milk EV subsets, including the new subset containing the bulk of microRNAs described in this study. Notably, a recent study supported the use of the term “exosome” for MVB-derived EVs that bear all three CD63, CD81 and CD9 markers [Citation67].
Our findings suggest the presence, in commercial cow’s milk, of at least two EV subsets that differ in terms of protein and miRNA content. This is supported by recent studies showing that (1) a single mammary cell type is able to secrete different types of EVs with different RNA contents [Citation68], and (2) milk miR-200c and miR-29b are differentially transported through human GI wall in vitro [Citation26]. The authors of the former publication introduced the concepts of high-density EVs (HD-EVs), which pellet at low ultracentrifugation speeds, and low-density EVs (LD-EVs), which sediment at higher speeds. The present study, based on ultracentrifugation, and our previous findings, on the resistance of commercial milk microRNAs to digestion, support such a classification. Admittedly, the biophysical and biochemical features distinguishing the different types of milk EVs are more complex than density alone. In this regard, size-exclusion chromatography, to perform pellet-free isolation of human and bovine milk EVs [Citation69], may bring a different, yet complementary, perspective.
LC-MS/MS analyses rather revealed an association between microRNAs and several proteins often contained inside MFG and MFGM, including XDH, a protein commonly found in exosomal proteomic profiles [Citation66], but hardly studied in milk EVs. XDH is a protein involved in purine and aldehydes metabolism that may produce reactive oxygen species when converted to xanthine oxidase and is likely to impact health if not degraded during digestion [Citation70,Citation71]. This is further supported by the fact that milk EV cytoplasmic esterases, whose enzymatic activity was used for the flow-cytometry analysis, were active in spite of milk processing (homogenization and pasteurization). Its enrichment in the 12,000 g and 35,000 g pellets, and its correlation with milk microRNAs support the use of XDH as a marker of a new microRNA-enriched milk EV subset that, along with high-speed pelleting milk EVs (“exosomes”), may confer microRNA resistance towards the high RNase levels found in milk [Citation23,Citation53] or during digestion [Citation22].
Although further analysis of the 12,000 g and 35,000 g pellets by IDG revealed that most microRNAs and EV-enriched proteins are concentrated in two specific fractions (F7 and F8), the use of SYTO RNASelect suggested that milk EVs, especially those of lower density, may contain RNA species other than microRNAs. The SYTO RNASelect stain only labels double-stranded RNA [Citation54] and, thus, is not expected to label single-stranded microRNAs or similarly small non-coding RNAs devoid of secondary structures. The peak of the SYTO RNASelect fluorescence signal in the microRNA-enriched fractions F7 and F8, however, may correspond to the detection of structured mRNAs, microRNA duplexes or precursor molecules (primary microRNAs or microRNA precursors), or to microRNA:mRNA complexes.
To confirm the presence and enrichment of EVs in our fractions of interest, we used lipid membrane-dependent fluorescence, DLS, TEM and HS-FCM. For HS-FCM, we used a BD Canto II Cytometer that allows detection of EVs as small as 100 nm in diameter [Citation51,Citation72]. We cannot exclude the possibility that the milk EV population that we have characterized by HS-FCM is more diverse than reported, as we could not document the presence or profile of EVs smaller than 100 nm, a feat that may be achieved using a nanotracker analysis device. The discrepancies in size determination that we have observed may come mainly from the facts that (1) TEM visually displays the EVs, from which we can determine the diameter of the membrane vesicles, whereas (2) DLS and HS-FCM display the hydrodynamic diameter of the EVs, which may be influenced by protein coating of the vesicles; these different approaches are thus highly complementary.
Proteomic analysis of the milk EV subset described in this study points towards the presence of highly glycosylated MFG-enriched proteins (e.g., CD36, mucin 1) possibly coating those EVs and likely protecting them against the harsh conditions prevailing in the extracellular milieu and the GI tract during digestion [Citation73]. Milk EVs may also be decorated with glycolipids, as found in mammary gland secretory cells and MFGs [Citation74]. MFGs are the main carrier of fat in milk and are composed of triglyceride droplets encapsulated within a phospholipid membrane inherited from mammary epithelial cells [Citation75,Citation76]. These MFGs thus contain several components of the mammary cells that produce them (i.e. proteins, lipids, glycoside-modified proteins and nucleic acids) [Citation76,Citation77], inherited partially from cell membrane, cytoplasm, casein-producing vesicles and endoplasmic reticulum [Citation78]. Considering that mammary gland cells and MFGs share the same membrane, and that MFG can bind other milk proteins, like whey or caseins (either naturally or upon milk processing) [Citation79,Citation80], it is highly conceivable that all of these EV-associated proteins and protein modifications may contribute to the resilience of milk EVs and microRNAs to proteinase K-induced degradation [Citation81] and simulated human digestion [Citation22]. Some proteins, like whey proteins, may themselves be protected by their association with milk EVs and exert biological effects [Citation82–Citation84]. As for milk proteins not associated with EVs, they may still contribute to EV resilience by acting as a decoy to EV-degradative agents present in milk or the GI milieu.
When processed, commercial milk is subjected to several physical treatments in order to ensure its safety and quality, including homogenization. This involves mainly breaking MFGs into small particles (0.2–1 μm in diameter) in order to avoid their separation from the liquid phase during milk storage [Citation85]. During this step, it is thought that the RNA content of MFGs (mainly in the cytoplasmic phase) is lost, because of (1) the modifications to lipids and lipid reorganization that happen within these particles and (2) the high RNase activity found in milk [Citation23,Citation53,Citation85]. The microRNA-enriched EVs that we have characterized in the present study may possibly represent a newly identified EV in milk with features close to MFGM or derive from MFGs during processing of commercial dairy cow’s milk. Therefore, the possibility that the milk EVs that we describe here are MFGM fragments, as described before [Citation86], cannot be excluded, although their morphology is not comparable with a previous description of such fragments [Citation69]. While the presence of RNA in MFGs has been described recently [Citation77], it is, to the best of our knowledge, the first time that MFG fragments or EVs resembling MFGs are associated with microRNAs.
Comparison of raw with processed milk may help define the exact nature and origin of these microRNA-enriched EVs in commercial dairy cow’s milk. Preliminary results suggest that our findings can be transposed to non-processed raw milk (presence and enrichment of some specific microRNAs in low-speed ultracentrifugation pellets), suggesting that these EVs may come from mammary gland cells or other cell types, which is supported by recent literature [Citation87]. Regardless of their origin, these EVs could possibly exert biological activities comparable with those described for MFGs and MFGM, since both share several immune-regulatory proteins, such as butyrophilin, XDH and MFGE8. These milk EVs may thus be expected to play an important role in immunity and inflammation [Citation84,Citation88,Citation89], the amplitude of which may be modulated by milk processing [Citation85].
The only occurrences of comparable milk EVs that we could find in the literature were from Blans et al. [Citation90], who described a gentle method to isolate milk EVs, in which the average size of various population of milk EVs was ~200 nm, although EVs associated with MFG-enriched protein MFGE8 were discarded. An abstract by Zonneveld et al. [Citation91], presented at the Fourth International Meeting of ISEV in April 2015, suggested the presence, in maternal milk, of EVs with protein content close to the HD-EVs described here and whose protein content possibly skews the T-cell balance towards a regulatory phenotype, further supporting the potential bioactivity of commercial cow’s milk. Recent work from the same research team, based on mass spectrometry [Citation87], supports the presence of more than one type of EVs bearing immunity-associated features in maternal milk, which is not inconsistent with our findings. Moreover, this new EV subset seems to be more enriched in microRNAs than LD-EVs (canonical exosomes) [Citation22], likely because of their larger size and greater abundance. In 2007, a study by Admyre et al. [Citation66] described comparable EVs in maternal milk that exhibited immunomodulatory features [Citation66]. Described as “exosomes”, examination of the mass spectrometry data from this paper indicated the presence of the same MFG-associated proteins that we described here, i.e. butyrophilin, mucin 1 and XDH. Interestingly, the authors of this study performed a preparative centrifugation step at 10,000 g only for 30 min, prior to sedimenting “exosomes” by ultracentrifugation at 100,000 g. This approach may have led to co-isolation of denser, microRNA-enriched HD-EVs that did not entirely pelleted at 10,000 g with LD-EVs (canonical exosomes). This mix of milk EVs seemed to increase Foxp3+CD4+CD25+ regulatory T-cells when coincubated with peripheral blood mononuclear cells, further supporting their inflammation regulatory activity. The relative contribution of HD-EVs versus LD-EVs to these effects remains to be clarified. In that context, it is interesting to note that milk EVs isolated by differential ultracentrifugation and a more refined isolation procedure exerted pro-inflammatory activities through TGF-β transfer and activity [Citation32]. Together, these observations suggest that the bioactivity of the HD-EVs described in the present study may differ from the widely studied LD-EVs (canonical exosomes). Neither the presence of a small proportion of LD-EVs (canonical exosomes) nor that of small MFG fragments within our samples can be excluded, simply recognizing the complexity of biological fluids containing different types of EVs [Citation14], which may warrant further investigations on the nature, origin, bioactivity and better purification of these EVs.
Considering their high RNA enrichment and protein content, these milk HD-EVs that we describe here are likely to exert biological effects. Even though the impact of milk EV-associated microRNAs on health and immunity is gaining momentum [Citation29], it remains highly controversial [Citation92]. Therefore, it may not be prudent to dismiss the other components of milk-borne EVs (e.g. proteins, lipids), which may be functional per se and contribute to EVs’ bioactivity [Citation93]. Thus, it would be most relevant and interesting to determine if these HD-EVs may act in concert with LD-EVs (canonical exosomes) and MFGs, and transfer their content, including immune-regulatory proteins (e.g. MFGE8) and possibly microRNAs, to the consumer to modulate immunity, inflammation and autoimmune diseases.
Conclusion
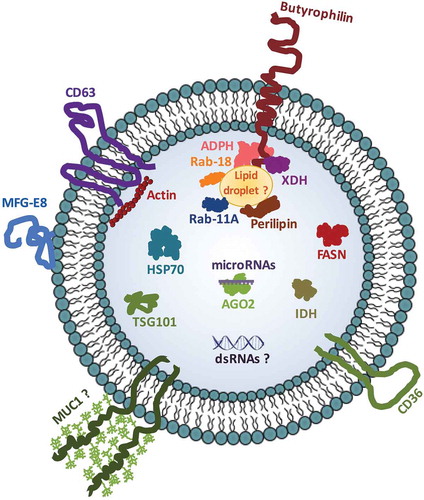
Our results support the existence of various populations of EVs in milk, including LD-EVs (canonical exosomes) and HD-EVs, possibly of different origins (mammary gland cells or immune cells), as previously suggested [Citation65], that differ in terms of microRNA content and association with MFGM-enriched immune-regulatory proteins. Based on the data obtained so far, we propose a schematic model that represents the microRNA-enriched milk HD-EV subset that we have characterized in this study (). Their ability to regulate gene expression in vivo through protein activity and/or microRNA transfer remains to be determined. This work, along with our previous report on their ability to resist digestion in vitro [Citation22] and the widely described beneficial role of MFGM fragment proteins on immunity, encourages further studies of the biological properties, activities and significance of this new type of EVs carrying the bulk of microRNAs present in commercial dairy cow’s milk.
Figure 9. Schematic illustration of the new EV subset carrying the bulk of microRNAs in commercial dairy cow’s milk. We propose a model that illustrates the microRNA-enriched EVs present in commercial dairy cow’s milk based on the results presented in this paper.
Supplementary_files.zip
Download Zip (1.9 MB)Acknowledgements
We acknowledge Dr Richard Janvier for help with electron microscopy analyses.
Disclosure statement
No potential conflict of interest was reported by the authors.
Supplemental data
Supplemental data can be accessed here.
Additional information
Funding
Notes on contributors
Abderrahim Benmoussa
P.P. conceived and coordinated the project; A.B. led the project, designed, planned and performed the experiments and analysed the data; S.L., S.T.S. and J.L. performed some experiments and analysed the data; E.B. and C.G. provided expertise, guidance, advices and analytical tools; A.B. wrote the first draft of the manuscript; all the authors commented on/edited the manuscript; P.P. revised and finalized the manuscript. All authors have read and approved the final manuscript.
References
- Ambros V. The functions of animal microRNAs. Nature. 2004;431(7006):1–22.
- Meister G. Argonaute proteins: functional insights and emerging roles. Nat Rev Genet. 2013;14(7):447–459.
- Fabbri M, Croce CM, Calin GA. MicroRNAs. Cancer J. 2008;14(1):1–6.
- Bartel DP. MicroRNAs: target recognition and regulatory functions. Cell. 2009;136(2):215–233.
- Meza-Sosa KF, Pedraza-Alva G, Perez-Martinez L. microRNAs: key triggers of neuronal cell fate. Front Cell Neurosci. 2014;8:175.
- Mysore R, Zhou Y, Sadevirta S, et al. MicroRNA-192* impairs adipocyte triglyceride storage. Biochim Biophys Acta. 2016;1861(4):342–351.
- Bissels U, Bosio A, Wagner W. MicroRNAs are shaping the hematopoietic landscape. Haematologica. 2012;97(2):160–167.
- O’Connell RM, Rao DS, Chaudhuri AA, et al. Physiological and pathological roles for microRNAs in the immune system. Nat Rev Immunol. 2010;10(2):111–122.
- Weber JA, Baxter DH, Zhang S, et al. The microRNA spectrum in 12 body fluids. Clin Chem. 2010;56(11):1733–1741.
- Zhou Q, Li M, Wang X, et al. Immune-related microRNAs are abundant in breast milk exosomes. Int J Biol Sci. 2012;8(1):118–123.
- Laffont B, Corduan A, Ple H, et al. Activated platelets can deliver mRNA regulatory Ago2•microRNA complexes to endothelial cells via microparticles. Blood. 2013;122(2):253–261.
- Witwer KW. XenomiRs and miRNA homeostasis in health and disease: evidence that diet and dietary miRNAs directly and indirectly influence circulating miRNA profiles. RNA Biol. 2012;9(9):1147–1154.
- Yanez-Mo M, Siljander PR, Andreu Z, et al. Biological properties of extracellular vesicles and their physiological functions. J Extracell Vesicles. 2015;4:27066.
- Zhang L, Hou D, Chen X, et al. Exogenous plant MIR168a specifically targets mammalian LDLRAP1: evidence of cross-kingdom regulation by microRNA. Cell Res. 2012;22(1):107–126.
- Dickinson B, Zhang Y, Petrick JS, et al. Lack of detectable oral bioavailability of plant microRNAs after feeding in mice. Nat Biotechnol. 2013;31(11):965–967.
- Witwer KW. Diet-responsive mammalian miRNAs are likely endogenous. J Nutr. 2014;144(11):1880–1881.
- Snow JW, Hale AE, Isaacs SK, et al. Ineffective delivery of diet-derived microRNAs to recipient animal organisms. RNA Biol. 2013;10(7):1107–1116.
- Wade B, Cummins M, Keyburn A, et al. Isolation and detection of microRNA from the egg of chickens. BMC Res Notes. 2016;9:283.
- Baier S, Howard K, Cui J, et al. MicroRNAs in chicken eggs are bioavailable in healthy adults and can modulate mRNA expression in peripheral blood mononuclear cells. FASEB J. 2015;29(1Supplement):LB322.
- Dever JT, Kemp MQ, Thompson AL, et al. Survival and diversity of human homologous dietary MicroRNAs in conventionally cooked top sirloin and dried bovine tissue extracts. PLoS One. 2015;10(9):e0138275.
- Baier SR, Nguyen C, Xie F, et al. MicroRNAs are absorbed in biologically meaningful amounts from nutritionally relevant doses of cow milk and affect gene expression in peripheral blood mononuclear cells, HEK-293 kidney cell cultures, and mouse livers. J Nutr. 2014;144(10):1495–1500.
- Benmoussa A, Lee CH, Laffont B, et al. Commercial dairy cow milk microRNAs resist digestion under simulated gastrointestinal tract conditions. J Nutr. 2016;146(11):2206–2215.
- Izumi H, Kosaka N, Shimizu T, et al. Bovine milk contains microRNA and messenger RNA that are stable under degradative conditions. J Dairy Sci. 2012;95(9):4831–4841.
- Izumi H, Tsuda M, Sato Y, et al. Bovine milk exosomes contain microRNA and mRNA and are taken up by human macrophages. J Dairy Sci. 2015;98(5):2920–2933.
- Title AC, Denzler R, Uptake SM. Function studies of maternal milk-derived MicroRNAs. J Biol Chem. 2015;290(39):23680–23691.
- Wolf T, Baier SR, Zempleni J. The intestinal transport of Bovine milk exosomes is mediated by endocytosis in human colon carcinoma Caco-2 cells and rat small intestinal IEC-6 cells. J Nutr. 2015;145(10):2201–2206.
- Arntz OJ, Pieters BC, Oliveira MC, et al. Oral administration of bovine milk derived extracellular vesicles attenuates arthritis in two mouse models. Mol Nutr Food Res. 2015;59(9):1701–1712.
- Melnik BC, John SM, Schmitz G. Milk is not just food but most likely a genetic transfection system activating mTORC1 signaling for postnatal growth. Nutr J. 2013;12:103.
- Zempleni J, Aguilar-Lozano A, Sadri M, et al. Biological activities of extracellular vesicles and their cargos from bovine and human milk in humans and implications for infants. J Nutr. 2017;147(1):3–10.
- Zempleni J, Baier SR, Howard KM, et al. Gene regulation by dietary microRNAs. Can J Physiol Pharmacol. 2015;93(12):1097–1102.
- Chen X, Gao C, Li H, et al. Identification and characterization of microRNAs in raw milk during different periods of lactation, commercial fluid, and powdered milk products. Cell Res. 2010;20(10):1128–1137.
- Pieters BC, Arntz OJ, Bennink MB, et al. Commercial cow milk contains physically stable extracellular vesicles expressing immunoregulatory TGF-beta. PLoS One. 2015;10(3):e0121123.
- Hata T, Murakami K, Nakatani H, et al. Isolation of bovine milk-derived microvesicles carrying mRNAs and microRNAs. Biochem Biophys Res Commun. 2010;396(2):528–533.
- Kusuma RJ, Manca S, Friemel T, et al. Human vascular endothelial cells transport foreign exosomes from cow’s milk by endocytosis. Am Jphysiol Cell Physiol. 2016;310(10):C800–C807.
- Abels ER, Breakefield XO. Introduction to extracellular vesicles: biogenesis, RNA CARGO SELECTION, CONTENT, RELEASE, AND UPTAKE. Cell Mol Neurobiol. 2016;36(3):301–312.
- Lee Y, El Andaloussi S, Wood MJ. Exosomes and microvesicles: extracellular vesicles for genetic information transfer and gene therapy. Hum Mol Genet. 2012;21(R1):R125–R134.
- Bobrie A, Colombo M, Krumeich S, et al. Diverse subpopulations of vesicles secreted by different intracellular mechanisms are present in exosome preparations obtained by differential ultracentrifugation. J Extracell Vesicles. 2012;1:18397.
- Zeringer E, Barta T, Li M, et al. Strategies for isolation of exosomes. Cold Spring Harb Protoc. 2015;2015(4):319–323.
- Yamada T, Inoshima Y, Matsuda T, et al. Comparison of methods for isolating exosomes from Bovine milk. J Vet Med Sci. 2012;74(11):1523–1525.
- Lotvall J, Hill AF, Hochberg F, et al. Minimal experimental requirements for definition of extracellular vesicles and their functions: a position statement from the international society for extracellular vesicles. J Extracell Vesicles. 2014;3:26913.
- Lässer C, Alikhani VS, Ekström K, et al. Human saliva, plasma and breast milk exosomes contain RNA: uptake by macrophages. J Transl Med. 2011;9:9.
- Reinhardt TA, Lippolis JD, Nonnecke BJ, et al. Bovine milk exosome proteome. J Proteomics. 2012;75(5):1486–1492.
- Zonneveld MI, Brisson AR, van Herwijnen MJ, et al. Recovery of extracellular vesicles from human breast milk is influenced by sample collection and vesicle isolation procedures. J Extracell Vesicles. 2014;3:24215.
- Chen T, Xie MY, Sun JJ, et al. Porcine milk-derived exosomes promote proliferation of intestinal epithelial cells. Sci Rep. 2016;6:33862.
- Tomasetti M, Staffolani S, Nocchi L, et al. Clinical significance of circulating miR-126 quantification in malignant mesothelioma patients. Clin Biochem. 2012;45(7–8):575–581.
- Wang JH, Jiang D, Rao HY, et al. Absolute quantification of serum microRNA-122 and its correlation with liver inflammation grade and serum alanine aminotransferase in chronic hepatitis C patients. Int J Infect Dis. 2015;30:52–56.
- Vigneron N, Meryet-Figuiere M, Guttin A, et al. Towards a new standardized method for circulating miRNAs profiling in clinical studies: interest of the exogenous normalization to improve miRNA signature accuracy. Mol Oncol. 2016;10(7):981–992.
- Nesvizhskii AI, Keller A, Kolker E, et al. A statistical model for identifying proteins by tandem mass spectrometry. Anal Chem. 2003;75(17):4646–4658.
- Zhou W, Kang HC, O’Grady M, et al. CellTrace™ far red & CELLTRACKER™ deep red—long term live cell tracking for flow cytometry and fluorescence microscopy. J Biol Methods. 2016;3(1):38.
- Milasan A, Tessandier N, Tan S, et al. Extracellular vesicles are present in mouse lymph and their level differs in atherosclerosis. J Extracell Vesicles. 2016;5:31427.
- Marcoux G, Duchez AC, Cloutier N, et al. Revealing the diversity of extracellular vesicles using high-dimensional flow cytometry analyses. Sci Rep. 2016;6:35928.
- Shelke GV, Lasser C, Gho YS, et al. Importance of exosome depletion protocols to eliminate functional and RNA-containing extracellular vesicles from fetal bovine serum. J Extracell Vesicles. 2014;3:24783.
- Kocic G, Bjelakovic L, Bjelakovic B, et al. Impact of folic acid supplementation on single- and double-stranded RNA degradation in human colostrum and mature milk. J Med Food. 2014;17(7):804–809.
- Hergenreider E, Heydt S, Treguer K, et al. Atheroprotective communication between endothelial cells and smooth muscle cells through miRNAs. Nat Cell Biol. 2012;14(3):249–256.
- Yu S, Cao H, Shen B, et al. Tumor-derived exosomes in cancer progression and treatment failure. Oncotarget. 2015;6(35):37151–37168.
- Malvern-Instruments. Technical note: concentration limits for zeta potential measurements in the Zetasizer Nano: Malvern Instruments. Available from: https://www.iesmat.com/iesmat/upload/file/Malvern/Productos-MAL/DLS-Concentration Limits for Zeta Potential Measurements in the Nano.pdf
- Texier I, Goutayer M, Da Silva A, et al. Cyanine-loaded lipid nanoparticles for improved in vivo fluorescence imaging. J Biomed Opt. 2009;14(5):054005.
- Jobsis PD, Rothstein EC, Balaban RS. Limited utility of acetoxymethyl (AM)-based intracellular delivery systems, in vivo: interference by extracellular esterases. J Microsc. 2007;226(1):74–81.
- Boilard E, Duchez AC, Brisson A. The diversity of platelet microparticles. Curr Opin Hematol. 2015;22(5):437–444.
- Valkonen S, van der Pol E, Boing A, et al. Biological reference materials for extracellular vesicle studies. Eur J Pharmaceut Sci. 2017;98:4–16.
- Zanabria R, Tellez AM, Griffiths M, et al. Modulation of immune function by milk fat globule membrane isolates. J Dairy Sci. 2014;97(4):2017–2026.
- Valadi H, Ekstrom K, Bossios A, et al. Exosome-mediated transfer of mRNAs and microRNAs is a novel mechanism of genetic exchange between cells. Nat Cell Biol. 2007;9(6):654–659.
- Gardiner C, Di Vizio D, Sahoo S, et al. Techniques used for the isolation and characterization of extracellular vesicles: results of a worldwide survey. J Extracell Vesicles. 2016;5:32945.
- Witwer KW, Buzas EI, Bemis LT, et al. Standardization of sample collection, isolation and analysis methods in extracellular vesicle research. J Extracell Vesicles. 2013;2:20360.
- Keerthikumar S, Gangoda L, Liem M, et al. Proteogenomic analysis reveals exosomes are more oncogenic than ectosomes. Oncotarget. 2015;6(17):15375–15396.
- Admyre C, Johansson SM, Qazi KR, et al. Exosomes with immune modulatory features are present in human breast milk. J Immunol. 2007;179(3):1969–1978.
- Kowal J, Arras G, Colombo M, et al. Proteomic comparison defines novel markers to characterize heterogeneous populations of extracellular vesicle subtypes. Proc Natl Acad Sci USA. 2016.
- Lasser C, Shelke GV, Yeri A, et al. Two distinct extracellular RNA signatures released by a single cell type identified by microarray and next-generation sequencing. RNA Biol. 2017;14(1):58–72.
- Blans K, Hansen MS, Sorensen LV, et al. Pellet-free isolation of human and bovine milk extracellular vesicles by size-exclusion chromatography. J Extracell Vesicles. 2017;6(1):1294340.
- Moriya C, Satoh H. Teneligliptin decreases uric acid levels by reducing xanthine dehydrogenase expression in white adipose tissue of male wistar rats. J Diabetes Res. 2016;2016:3201534.
- Wang CH, Zhang C, Xing XH. Xanthine dehydrogenase: an old enzyme with new knowledge and prospects. Bioengineered. 2016;7(6):395–405.
- Rousseau M, Belleannee C, Duchez AC, et al. Detection and quantification of microparticles from different cellular lineages using flow cytometry. Evaluation of the impact of secreted phospholipase A2 on microparticle assessment. PLoS One. 2015;10(1):e0116812.
- Le TT, Van de Wiele T, Do TN, et al. Stability of milk fat globule membrane proteins toward human enzymatic gastrointestinal digestion. J Dairy Sci. 2012;95(5):2307–2318.
- Peterson R, Cheah WY, Grinyer J, et al. Glycoconjugates in human milk: protecting infants from disease. Glycobiology. 2013;23(12):1425–1438.
- Gallier S, Vocking K, Post JA, et al. A novel infant milk formula concept: mimicking the human milk fat globule structure. Colloids Surf B Biointerfaces. 2015;136:329–339.
- Robenek H, Hofnagel O, Buers I, et al. Butyrophilin controls milk fat globule secretion. Proc Natl Acad Sci USA. 2006;103(27):10385–10390.
- Chen Q, Wu Y, Zhang M, et al. Milk fat globule is an alternative to mammary epithelial cells for gene expression analysis in buffalo. J Dairy Res. 2016;83(2):202–208.
- Honvo-Houeto E, Henry C, Chat S, et al. The endoplasmic reticulum and casein-containing vesicles contribute to milk fat globule membrane. Mol Biol Cell. 2016;27(19):2946–2964.
- Saffon M, Jiménez-Flores R, Britten M, et al. Effect of heating whey proteins in the presence of milk fat globule membrane extract or phospholipids from buttermilk. Int Dairy J. 2015;48:60–65.
- Ye A, Anema SG, Singh H. High-pressure-induced interactions between milk fat globule membrane proteins and skim milk proteins in whole milk. J Dairy Sci. 2004;87(12):4013–4022.
- Zauner G, Koeleman CA, Deelder AM, et al. Protein glycosylation analysis by HILIC-LC-MS of Proteinase K-generated N- and O-glycopeptides. J Sep Sci. 2010;33(6–7):903–910.
- Picariello G, Ferranti P, Fierro O, et al. Peptides surviving the simulated gastrointestinal digestion of milk proteins: biological and toxicological implications. J Chromatogr B Analyt Technol Biomed Life Sci. 2010;878(3–4):295–308.
- Lefevre T, Subirade M. Interaction of beta-lactoglobulin with phospholipid bilayers: a molecular level elucidation as revealed by infrared spectroscopy. Int J Biol Macromol. 2000;28(1):59–67.
- Chatterton DE, Nguyen DN, Bering SB, et al. Anti-inflammatory mechanisms of bioactive milk proteins in the intestine of newborns. Int J Biochem Cell Biol. 2013;45(8):1730–1747.
- Lopez C, Cauty C, Guyomarc’h F. Organization of lipids in milks, infant milk formulas and various dairy products: role of technological processes and potential impacts. Dairy Sci Technol. 2015;95(6):863–893.
- Rombaut R, Dejonckheere V, Dewettinck K. Filtration of milk fat globule membrane fragments from acid buttermilk cheese whey. J Dairy Sci. 2007;90(4):1662–1673.
- van Herwijnen MJ, Zonneveld MI, Goerdayal S, et al. Comprehensive proteomic analysis of human milk-derived extracellular vesicles unveils a novel functional proteome distinct from other milk components. Mol Cell Proteomics. 2016;15(11):3412–3423.
- Arnett HA, Viney JL. Immune modulation by butyrophilins. Nat Reviews Immunol. 2014;14(8):559–569.
- Hernell O, Timby N, Domellof M, et al. Clinical benefits of milk fat globule membranes for infants and children. J Pediatr. 2016;173(Suppl):S60–S65.
- Kristine Blans MSH, Sørensen L, Hvam ML, et al. Effective and gentle isolation of extracellular vesicles in human and bovine milk without ultracentrifugation. ISEV International Meeting; 2016 May 4–7; Rotterdam, the Netherlands; 2016.
- Abstracts from the fourth international meeting of ISEV, ISEV2015, Washington, D.C., USA, 23-26 April 2015. J Extracell Vesicles. 2015;4(1):27783.
- Witwer KW, Zhang CY. Diet-derived microRNAs: unicorn or silver bullet? Genes Nutr. 2017;12:15.
- Zempleni J. Milk exosomes: beyond dietary microRNAs. Genes Nutr. 2017;12(1).