
ABSTRACT
The subfraction of extracellular vesicles, called exosomes, transfers biological molecular information not only between cells but also between tissues and organs as nanolevel signals. Owing to their unique properties such that they contain several RNA species and proteins implicated in kidney development, exosomes are putative candidates to serve as developmental programming units in embryonic induction and tissue interactions. We used the mammalian metanephric kidney and its nephron-forming mesenchyme containing the nephron progenitor/stem cells as a model to investigate if secreted exosomes could serve as a novel type of inductive signal in a process defined as embryonic induction that controls organogenesis. As judged by several characteristic criteria, exosomes were enriched and purified from a cell line derived from embryonic kidney ureteric bud (UB) and from primary embryonic kidney UB cells, respectively. The cargo of the UB-derived exosomes was analysed by qPCR and proteomics. Several miRNA species that play a role in Wnt pathways and enrichment of proteins involved in pathways regulating the organization of the extracellular matrix as well as tissue homeostasis were identified. When labelled with fluorescent dyes, the uptake of the exosomes by metanephric mesenchyme (MM) cells and the transfer of their cargo to the cells can be observed. Closer inspection revealed that besides entering the cytoplasm, the exosomes were competent to also reach the nucleus. Furthermore, fluorescently labelled exosomal RNA enters into the cytoplasm of the MM cells. Exposure of the embryonic kidney-derived exosomes to the whole MM in an ex vivo organ culture setting did not lead to an induction of nephrogenesis but had an impact on the overall organization of the tissue. We conclude that the exosomes provide a novel signalling system with an apparent role in secondary embryonic induction regulating organogenesis.
Introduction
Different cell types, mammalian and bacterial, secrete membrane-enclosed vesicles, called extracellular vesicles (EVs), into the extracellular space. They are subdivided into different subclasses, based on their size, such as microvesicles, 50–1000 nm, and exosomes, 30–120 nm. The term “exosomes” refers to those vesicles of endosomal origin. They can be found in a wide range of biological fluids, including blood, urine, sweat and saliva (reviewed by Raposo et al. [Citation1]). Over the last decade, EVs have been found to be more than just the “garbage bags” of the cell, bringing them into the spotlight of research.
EVs consist of a lipid bilayer, with incorporated transmembrane proteins, and a hydrophilic core containing proteins, mRNA, miRNA and signalling molecules [Citation2]. They were found to play crucial roles in physiological processes, mediating communication, transmitting very specific information to their targets on an intercellular and system (humoral) levels. There is evidence that EVs derived from certain cells (e.g. mesenchymal stem cells (MSCs)) have regenerative and immunomodulatory properties [Citation3]. Their properties make them especially interesting as possible new tools for a range of therapeutic applications.
Even though the putative role of EVs in processes ongoing in healthy cells such as during organ development remains in most aspects ambiguous, it is emerging that EVs influence many of the key signalling pathways involved in development [Citation1]. Important signalling molecules such as several Wnts and Notch2 were found to be associated with EVs (summarized in [Citation4]). Gradilla and co-workers showed that the transport of the morphogen hedgehog (Hh) is important for proper spatially restricted signalling during development [Citation5]. The involvement of EVs in the developmental signalling was recently reviewed [Citation6]. EVs secreted by cells present in a mature kidney were identified by studying urine samples. It is known that proteins found in human urinary exosomes are specific to or enriched in given regions of the kidney [Citation7]. Currently available data indicate that EVs may be involved in organogenesis and that kidney-derived vesicles may also impact cells of certain other organs [Citation8]. Very recently, the involvement of exosomes secreted by the epithelium and mesenchyme of a developing tooth were shown to diffuse through the basement membrane and regulate cell differentiation and matrix synthesis. The epithelial exosomes induce mesenchymal cells to produce dentin sialoprotein, and the mesenchymal exosomes lead to the secretion of ameloblastin and amelogenenin by the epithelial cells [Citation9], processes essential for tooth development. There are, however, no data available on vesicles derived from healthy and/or embryonic kidney cells. Therefore, the putative ontogenesis roles of normal kidney-derived vesicles remain poorly understood. Kidney morphogenesis starts with the ureteric bud (UB) outgrowth from the Wolffian duct towards the MM. The MM secretes glial cell line-derived neurotrophic factor (GDNF) towards the UB, promoting its survival and growth via its c-Ret receptor. Once the UB reaches the MM, the MM cells return survival signals such as BMP7 and FGF2 [Citation10,Citation11]. Indeed, without the reciprocal inductive signalling between the UB and the MM, the MM undergoes programmed cell death via apoptosis [Citation10,Citation11].
Besides the survival signals, the UB also secretes signals that induce the MM to undergo nephrogenesis, such as the Wnt ligands [Citation12–Citation14], resulting in the development of the key functional kidney units – the nephrons [Citation4]. While the UB is a natural MM nephrogenesis inducer, it can be removed and replaced by chemical activation of the Wnt pathway via the GSK-3 inhibitor (BIO) [Citation15] in the process of renal organoid formation [Citation16].
In the Wnt-induced process of nephrogenesis, several steps are observed: the MM condensates around the UB tips and then forms pre-tubular aggregates; these cells deposit the basement membrane and form the epithelial structures of renal vesicles. Renal vesicles elongate to form comma- and S-shaped bodies that will generate the filtering unit, with the glomerulus at the proximal end, and connect with the collecting duct (derived from the UB origin) at the distal end [Citation4,Citation16,Citation17]. The organoids are known as cellular aggregates containing more than one cell type typical for the organ they replicate [Citation18]. Such organoids have successfully been constructed with the use of primary kidney cells [Citation19–Citation21].
Here, we report the successful isolation and characterization of EVs in particular exosomes from a kidney cell line and primary embryonic kidney cells. We analysed their proteins and RNA cargo, and identified exosomes specific proteins (CD81) as well as proteins involved in pathways regulating cell structure and shape, and miRNAs involved in the regulation of Wnt signalling pathways. Furthermore, we studied the attraction of the EVs to and uptake by a mesenchymal cell line and primary cells in detail. Interestingly, we found that the vesicles not only enter the cell but also are targeted to the nucleus of the cell. Moreover, we have studied the transfer of exosomal RNA cargo. It can be primarily found in the cytoplasm and cellular vacuoles. Moreover, the incubation of vesicles with primary embryonic MM organoids indicates that the structure and organization of the cells as well as the MM cell survival are influenced by the vesicles. In summary, the current data suggest that besides growth factors [Citation21], exosomes play a novel but evolutionarily conserved role in the transmission of the secondary inductive interactions that control organogenesis.
Material and methods
Mouse lines, dissection of embryonic kidneys and generation of renal organoids
The animal care and experimental procedures in this study were in accordance with Finnish national legislation on the use of laboratory animals, the European Convention for the protection of vertebrate animals used for experimental and other scientific purposes (ETS 123), and the EU Directive 86/609/EEC.
The embryos were obtained from pregnant wild-type CD-1 mice. The metanephric kidneys were dissected from E11.5 mouse embryos in chilled Dulbecco’s phosphate-buffered saline (PBS) buffer (Sigma). Following a 30 s incubation in pancreatin(Sigma)/trypsin (Sigma) (1.125%/2.25%) solution, the MM was separated from the UB. A few mesenchymes were placed together and re-aggregated by centrifugation (1380 × g for 5 min) in the presence of exosome-free Dulbecco’s Modified Eagle Medium (DMEM): Nutrient Mixture F-12 (DMEM/F12) (Sigma) supplemented with 10% fetal bovine serum (FBS, HyClone) (produced according to [Citation22]), 100 U mL−1 penicillin and 100 µg mL−1 streptomycin (Sigma) and cultured for 24 h in the same medium at 37°C in 5% CO2. The positive control samples were incubated either with transient exposure to 0.35 µL mL−1 BIO (GSK-3 inhibitor) [Citation15] or with natural MM inducer: primary UB (pUB) treated with hrGDNF (RD Systems) as previously described [Citation19] or with UBtip cell line [Citation23]. The negative control samples were the MM without any type of inducer, while the experimental samples were co-incubated with exosomes isolated from UBtip cell line or conditioned medium (CM) from pUB cultures (see protocol below). On the next day, samples were transferred into Trowel-type culture conditions [Citation24] and cultured for 24–48 h.
Cell culture
The UBtip [Citation23] and mK4 cell lines [Citation25] were maintained in DMEM/F12 supplemented with 10% FBS, 100 U mL−1 penicillin and 100 µg mL−1 streptomycin and incubated at 37°C in 5% CO2. The cell line tested negative for mycoplasma contamination using the EZ-PCR mycoplasma test kit (Biological Industries). EV-free medium was prepared according to the protocol by Théry et al. [Citation22].
The primary UBs were dissected from the kidneys of E11.5 mice embryos (CD-1) by trypsinization. Dissection was performed in EV-free medium supplemented with 10% FBS, 10 ng µl−1 GNDF (RD Systems) and 5 µM ROCK inhibitor (Y-27,632, Sigma) for the first 24 h. After that time, the cells were prepared for vesicle production by cultivation in EV-free medium, DMEM/F12 supplemented with 1% FBS, GDNF and Rock inhibitor.
Preparation of CM containing vesicles
CM was prepared from a mean of 1 × 10⁸ UBtip cells grown at 90–95% confluency in cell-culture dishes (Greiner, Cellstar (#639,160)) or pUBs grown in similar conditions. Cell cultures were washed twice with 1× PBS before a 24 h incubation with 25 mL EV-free medium [Citation22] at 37°C in 5% CO2. EV-free medium is DMEM/F12 supplemented with 1 or 10% FBS. The medium was prepared according to Witwer et al. 2006 [Citation26] as a 20% stock solution as follows: DMEM/F12 supplemented with 20% FBS is centrifuged for 24 h at 100 000 g and subsequently diluted out (to contain 1 or 10% FBS) and filtered through a 0.2 µm filter (Whatman). Residual EV contamination was not found, since no EV markers were found when applied to a Western blot as a control. Following the collection of the CM, cell cultures were trypsinized, the cells were counted, and cell viability was measured on an Automatic Cell Counter (BioRad) using a 0.1% trypan blue exclusion test.
The CM from pUB cells was harvested after 24–48 h of cell culture. Subsequently it was concentrated by filtration (Amicon Ultra, Millipore, 100K filters) from ~5 mL to 350 µL, and stored at −20°C until usage.
OptiPrep™ density gradient centrifugation – exosome purification
A discontinuous iodixanol gradient was used as described earlier [Citation27] with some modifications. OptiPrep™ density gradient (Sigma) was formed by layering 2.5 mL of 40%, 2.5 mL of 20%, 2.5 mL of 10% and 2.2 mL of 5% solutions on top of each other in a 12 mL open top polyallomer tube (Thermo Fisher). Five hundred microlitres of CM sample was overlaid onto the top of the gradient, which was then centrifuged for 18 h at 100 000 g and 4°C (SW 32.1 Ti rotor, Beckman Coulter). Gradient fractions of 1 mL were collected and tested for vesicle markers on an sodium dodecyl sulfate polyacrylamide gel electrophoresis (SDS-PAGE) and subsequently on Western blot. The fractions that contained vesicles (up to three fractions) were pooled, diluted to 45 mL in PBS and centrifuged for 3 h at 100 000 g and 4°C. The resulting pellets were resuspended in 1 mL of PBS and stored at −20°C. The density of each fraction was estimated according to a standard curve measuring the absorbance values at 340 nm of 1:100 aqueous dilutions of 5, 10, 20 and 40% iodixanol solutions. The obtained standard curve was used to determine the density of fractions collected from a control gradient overlaid with 500 µL of PBS, and for the calculation of the density of each vesicle-containing fraction.
Protein analysis
Quantification and Western blot
To estimate the amount of proteins in EX samples, a bicinchoninic acid assay (BCA assay; Pierce™ BCA Protein Assay Kit) was performed according to the manufacturer’s recommendations. Absorbance was measured at 562 nm. Protein samples for SDS-PAGE were run at the following concentrations: for exosomes samples and all cell lysates, 5 µg, for the CM from pUB 20 µL was applied. The following primary and secondary antibodies were used for immunostaining: rabbit polyclonal anti-Ago2 (1:500) (#ab32381, Abcam, Cambridge, UK), mouse monoclonal anti-Alix (1:1000) (#2171, Cell Signaling, Danvers, MA), rabbit polyclonal anti-calreticulin (1:1000) (#2891, Cell Signaling), mouse monoclonal anti-CD81 (B-11) (1:400) (#sc-166029, Santa Cruz Biotechnology, Dallas, TX), rabbit polyclonal anti-Hsc70 (1:2000) (#ab137808, Abcam), mouse monoclonal anti-CD63 (LAMP-3, clone R5G2) (1:2000) (MBL, Nagoya, Japan) and mouse monoclonal anti-TG101 (1:1000) (#sc-7964, Santa Cruz Biotechnology). Secondary antibodies coupled to horseradish peroxidase were obtained from Dako (Glostrup, Denmark).
Proteomics and data analysis
Protein data were analysed using Proteome Discoverer (ThermoScientific version 2.2) connected to an in-house server running Mascot 2.6.1 software (Matrix Science) searching data against the mouse SwissProt database (version 2017_09). Search parameters were precursor mass tolerance of 5 ppm and fragment mass tolerance of 0.02 Da. Trypsin was used as the cleavage enzyme. Static modification was set to carbamidomethyl of cysteine, and variable modification to oxidation of methionine. The Mascot significance threshold was set to 0.05, and the minimal number of peptides was set to two to filter the obtained result. Samples were prepared in RIPA buffer with PBS (1:1). Sample digestion was performed according to the standard filter-aided sample preparation protocol and analysed by LC-EXI-MS/MS using the Q Exactive mass spectrometer. Digested samples were dissolved in 0.1% formic acid. DAVID (Database for Annotation, Visualization and Integrated Discovery) (version 6.8) was used to carry out a gene-term enrichment analysis against the Mus musculus gene list as background [Citation28,Citation29]. All p-values less than 10–5 after Bonferroni correction were considered to be significant. Settings were chosen as previously published [Citation30]. Pathway overview visualization was performed using the Reactome Pathway Analysis Tool (www.reactome.org). Venn diagrams were prepared using FunRich (version 3.0) [Citation31].
RNA cargo analysis
Exosomal samples and UBtip cells were lysed in Qiazol (Qiagen), extracted with Chloroform (Sigma) and purified using miniElute columns (Qiagen). The RNA was eluted into nuclease-free water and stored at −70°C until needed. The RNA concentration, quality and size were measured using picoRNA Kit BioAnalyser (Agilent) and followed by cDNA synthesis (Exiqon). cDNA was diluted 40× and used in a custom-designed qPCR miRNA plate using SybrGreen (Exiqon). The PCR was performed on a BioRad CFX96 machine, and we followed specific protocols for the chosen primer qPCR set-up. The miRNA targets were chosen based on their role in the Wnt/β-catenin pathway [Citation32] and on sequencing data (high number of repeats) of exosomal samples derived from human urine [Citation33].
Immunoelectron microscopy
The immunoelectron microscopy was performed as published earlier [Citation27] using the anti-CD63 antibody as a primary antibody at a 1:50 dilution. Vesicles were deposited on a Formvar carbonated grid (glow-discharged). The grids were incubated in blocking serum (1% BSA (bovine serum albumin) in PBS). Afterwards, the grids were incubated for 20 min with the primary anti-CD63 antibody, followed by the secondary antibody (anti-mouse IgG, Zymed, San Francisco, CA) for 20 min and finally the protein A-gold complex (PAG 10 nm) for 20 min. All antibodies and gold-conjugates were diluted in 1% BSA in 1× PBS. As a control of the efficacy of the blocking, a labelling procedure without the primary antibody was prepared. Finally, the grids were stained with neutral uranylacetate and embedded in methylcellulose/uranyl acetate. Samples were examined using the Tecnai G2 Spirit transmission electron microscope (FEI, Eindhoven, The Netherlands), and images were captured with a charge-coupled device camera (Quemesa, Olympus Soft Imaging Solutions GMBH, Münster, Germany).
Nanoparticle tracking analysis
Nanoparticle tracking analysis (NTA) was performed using a NanoSight NS300 (NanoSight Ltd, Amesbury, UK) equipped with a 405 nm laser. At least three 40 s videos were recorded for each sample with camera level and detection threshold set at 13. Temperature was monitored throughout the measurements. Videos recorded for each sample were analysed with NTA software version 3.1 (build 3.1.46) to determine the concentration and size of measured particles with the corresponding standard error. For analysis, auto settings were used for blur, minimum track length and minimum expected particle size. Double-distilled H2O was used to dilute the starting material.
Exosome uptake and migration
Following purification, exosomes were labelled with CellVue Claret Far Red (Sigma-Aldrich) according to the manufacturer’s instructions. The stained vesicles were washed three times in 1× PBS to remove excess staining. As a control, an equal volume of 1× PBS was used, which was prepared in the same way as the actual exosome samples. The interaction of the exosomes with cells was visualized using confocal microscopy (Zeiss LSM 780, Carl Zeiss, Germany). Cells were cultured overnight (mK4) or for 4–6 h (pMM) to allow cell attachment before adding exosomes. The labelled exosomes were added to the cell culture of either the mK4 cell line or pMM cells at a concentration of 1 × 10¹² ± 4.3 × 10¹⁰ vesicles mL−1. In order to visualize the cellular body, the cells were labelled green with live-cell dye CellTracker CMFDA (Thermo Scientific), according to the manufacturer’s instructions, and the cellular nuclei were stained with DAPI (1:1000; Thermo Scientific). The imaging was performed on a Zeiss LSM 780 confocal microscope using time-lapse technology as well as still images (Zeiss Plan-Apochromat 40×/1.4 or Zeiss i Plan Apochromat 63×/1.4 objectives).
Labelling of exosomal cargo
The RNA cargo of purified exosomes was labelled with the ExoGlow kit (Systems Biosciences; Mountain View, CA) according to the manufacturer’s instructions. Labelled exosomes were added at a concentration of 4 × 10¹¹ ± 1.7 × 10¹⁰ vesicles mL−1 to the cell culture of mK4 cell line or pMM cells. Cells were washed with 1× PBS and fixed with 1× PFA (paraformaldehyde) 2 h and 24 h after adding vesicles. The imaging was performed using a Zeiss LSM 780 confocal microscope taking still images, as the ExoGlow stain is an acridine orange-based dye, which is phototoxic to cells, and long-term time-lapse imaging is not possible.
Statistical analysis
Exosome uptake and migration
The samples were imaged using a Zeiss 780 confocal microscope. Z-stack images at 40× objective were superimposed using maximum intensity projection using ZEN software, and 10 images per sample were analysed; the total number of cells vs. cells containing exosomes were counted and turned into percentage. Zero was determined in terms of time, just before the exosomes were added. As a control, a 1× PBS sample that had been prepared in exactly the same way as the actual exosome sample was added to the culture in identical quantity.
Co-localization analysis
Confocal Z-stack images were deconvolved using Huygens Professional software (Scientific Volume Imaging, Hilversum, Netherlands). Classical maximum likelihood estimation-based intensity preserving deconvolution was used to reduce noise, background, out-of-focus signal and spherical aberrations, and to improve contrast (signal-to-noise and signal-to-background ratios) and resolution in the restored images. Deconvolution was implemented to improve 3D co-localization analysis of nuclear DAPI staining and exosome CellVue staining.
Voxel-based co-localization analysis of DAPI and CellVue signals was performed using BioImageXD software [Citation34]. Automatic threshold calculation was not suitable for sparse CellVue signals, constant manual thresholds were set for all analysed time points and samples, and 10 Costes iteration rounds were run for p-value approximations [Citation35]. The number of non-zero voxels, voxels above intensity thresholds, co-localized voxels, percentage of co-localized voxels and Manders co-localization coefficients were calculated and analysed.
Results and discussion
Characterization of EVs from kidney cells
In order to determine if embryonic kidney-derived cells would secrete exosomes, we first aimed to isolate EVs from an immortalized kidney UB cell line (UBtip) and thereafter from primary UB cells (pUB) isolated from mouse embryonic kidney. These samples were subjected to gradient purification and/or filtration to obtain the exosomal fraction.
Detailed characterization of obtained exosomes revealed that they could be indeed purified from these sources of embryonic kidney. The exosomes from the UBtip cell line were 30–120 nm in diameter and partially labelled with a CD63 antibody (common exosomal marker) as analysed by immunoelectron microscopy (IEM; ,)). To minimize contaminants, possibly derived from cell organelles of non-endosomal origin or alternatively representing protein aggregates co-sedimenting with the exosomes during ultracentrifugation, the vesicles were isolated from CM by filtration followed by an iodixanol (OptiPrep) density gradient [Citation27].
Figure 1. Electron microscopy analysis of exosomes. (a) Exosomes (EXs) purified from UBtip cells, immunogold-labelled for endogenous CD63 (PAG 10nm, arrows), (b) Extracellular vesicles enriched from primary UB cells, unlabelled. All cells were cultured for 24 h before the CM was harvested for exosome purification or vesicle enrichment. (c) Optiprep gradient fractions (F1 to F10; each 1 mL) were tested for CD81 (tetraspanin commonly present on exosomes; 20 µL of each fraction). CD81-positive fractions F5 to F7 were pooled, washed with 1 × PBS and concentrated by filtration to yield the sample analysed in (d). The density (g mL–1) of each fraction is shown under each fraction number. (D) Western blot analysis for Exosomes (exosomes) and total cell lysate (L) (5 µg each). The purified exosome sample showed bands for CD63, Alix and Tsg101, all vesicle markers. These markers could be found in the cell lysate for CD63 and Alix, but not for Tsg 101. Calreticulin and ago2 (markers for cellular contaminants) could be found only in the cell lysate.
The generated OptiPrep gradient fractions were analysed by Western blot for CD81-positive fractions. Three consecutive fractions (F5 to F7, )) were found to contain CD81, in line with what has been reported for exosomes released by other cell types [Citation27]. The pooled vesicles had an average density of 1.07 g ml−1 ()). These data are in agreement with values reported on exosome densities in other cell types [Citation36]. Combined, the data indicate that the embryonic kidney-derived exosomal fraction consists mostly of a homogenous population of vesicles with features of exosomes.
The properties of the embryonic kidney-derived exosomes were analysed further with Western blotting. This analysis revealed enrichment for those exosomal components that have been shown to be typical biomarkers such as Alix, CD63 and Tsg101. The exosomes preparations in this study failed to reveal the presence of contaminating cell organelles, apoptotic bodies or extracellular proteins. This conclusion is based on the fact that, for example, no calreticulin or Ago2 as opposed to total lysate were detected in the exosomal fractions ()).
The number of vesicles in the sample was determined by NTA. On average 4.08 × 10¹¹ ± 1.7 × 10¹⁰ particles mL−1 CM, and around 125 µg mL−1 total protein was isolated by filtration and density gradient.
Additionally, we dissected the natural kidney tubule inductive tissue, the primary UB (pUB) from mouse embryos at E11.5. At this stage, the UB has entered the embryonic kidney MM and made its first branch. Collectively, 3000–4000 cells per UB were cultured in vesicle-free medium for 24–48 h, after which the CM was harvested, and the EVs were enriched by filtration. Consistent with the conclusion that the pUB cells in vivo secrete exosomes, HSC70 protein, a common exosomal marker, was detected on Western blot (data not shown). Moreover, electron microscopic depiction highlighted vesicles around the size of the exosomes, namely 70–100 nm in diameter. Such pUB-derived vesicles had a cup-shaped morphology typical for exosomes ()).
Proteomics was performed to analyse the exosomal protein cargo in more detail. The protein cargo of UBtip cell line-derived exosomes was compared with the proteins of the cells of origin. The data are summarized in –) and fully described in Supplementary Tables 1 and 2. Altogether, 127 proteins were found in both sets (UBtip cell line and exosomes) whereas 67 proteins were unique to the exosomes ()) The unique proteins comprised exosomal markers such as HSP70, CD81 and, more interestingly, proteins of the extracellular matrix (laminins) and growth factors (TGF beta). We used DAVID to identify statistically significant overrepresented gene ontology (GO) terms ()) in the exosomal cargo proteins. They were enriched for cellular components typically associated with exosomal samples: extracellular vesicle, extracellular region, membrane and vesicle [Citation30]. Furthermore, cellular components associated with protein binding, focal adhesion, extracellular matrix, cadherin binding involved in cell–cell adhesion, cell–cell adherence junction and structural molecule activity were enriched, many of which are involved in regulating cell shape and maintaining tissue integrity. Furthermore, the reactome pathway clustering analysis ()) showed that proteins in the exosomal cargo were enriched for pathways associated with developmental biology, signal transduction, cell-to-cell communication and, more importantly and in contrast to the proteins from the UBtip cell line, extracellular matrix organization (), Supplemetal ).
Figure 2. Proteomic analysis of UBtip cell line exosomes. (a) A Venn diagram showing the common and unique number of proteins of the UBtip cell line and the UBtip cell line-derived exosomes (both protein sets are the common proteins derived from two independent biological replicates). Venn diagrams were generated using FunRich [Citation31]. (b) Analysis of cellular component GO terms. A functional enrichment analysis of the exosomal proteins was performed using DAVID [Citation28,Citation29]. Percentages of proteins relative to the total number of proteins in the category of GO terms are shown. To minimize redundancy of general GO terms, GO FAT was used. Only categories with enrichment greater than 5.5% are shown. (c) Pathway clustering analysis. Enrichment of proteins in certain pathways was visualized using the Reactome Pathway Analysis Tool (www.reactome.org). Significant differences in enrichment compared with proteins from the UBtip cell line were highlighted with a box and represent extracellular matrix proteins.
![Figure 2. Proteomic analysis of UBtip cell line exosomes. (a) A Venn diagram showing the common and unique number of proteins of the UBtip cell line and the UBtip cell line-derived exosomes (both protein sets are the common proteins derived from two independent biological replicates). Venn diagrams were generated using FunRich [Citation31]. (b) Analysis of cellular component GO terms. A functional enrichment analysis of the exosomal proteins was performed using DAVID [Citation28,Citation29]. Percentages of proteins relative to the total number of proteins in the category of GO terms are shown. To minimize redundancy of general GO terms, GO FAT was used. Only categories with enrichment greater than 5.5% are shown. (c) Pathway clustering analysis. Enrichment of proteins in certain pathways was visualized using the Reactome Pathway Analysis Tool (www.reactome.org). Significant differences in enrichment compared with proteins from the UBtip cell line were highlighted with a box and represent extracellular matrix proteins.](/cms/asset/9b2d8f92-59b8-4561-ae3f-d00ed54d7b23/zjev_a_1422675_f0002_oc.jpg)
The RNA cargo of the exosomes derived from the UBtip cell line was analysed by qPCR with targets chosen relevant to kidney development induction (Wnt/β-catenin pathway) and previously reported to be found in exosome samples from human urine [Citation33] (–)). We found that, when compared with the UBtip cells (cells of origin) the exosomes carry a larger amount of miRNA; also, ribosomal RNA was detected in the exosomal cargo (data not shown).
Figure 3. Analysis of exosomal miRNAs. (A–C) Graphs presenting the exosomal miRNAs cargo normalized to the miRNA from their cell line of origin (UBtip). (a) miRNA found to negatively regulate Wnt pathway, (b) miRNA found to positively regulate Wnt pathway, (c) miRNA previously also identified in exosomes from human urine samples [Citation33]. (d–f) Graphs presenting the exosomal miRNAs cargo normalized to housekeeping genes (SNORD65 and SNORD110). (d) miRNA found to negatively regulate Wnt pathway, (e) miRNA found to positively regulate Wnt pathway, (f) miRNA previously also identified in exosomes from human urine samples [Citation33].
![Figure 3. Analysis of exosomal miRNAs. (A–C) Graphs presenting the exosomal miRNAs cargo normalized to the miRNA from their cell line of origin (UBtip). (a) miRNA found to negatively regulate Wnt pathway, (b) miRNA found to positively regulate Wnt pathway, (c) miRNA previously also identified in exosomes from human urine samples [Citation33]. (d–f) Graphs presenting the exosomal miRNAs cargo normalized to housekeeping genes (SNORD65 and SNORD110). (d) miRNA found to negatively regulate Wnt pathway, (e) miRNA found to positively regulate Wnt pathway, (f) miRNA previously also identified in exosomes from human urine samples [Citation33].](/cms/asset/91145abe-bdb1-411a-8c4e-1d711528f94c/zjev_a_1422675_f0003_oc.jpg)
Our analysis depicted certain miRNAs upregulated in exosomes, known to negatively regulate the Wnt pathway and included those miRNAs (miR-375) that target the extracellular domains of Frizzled involved in the Wnt signalling pathway and also directly blocking the binding of the Wnts to Frizzled (miR-21) [Citation32] (,)). In addition to these, many miRNAs positively regulating the Wnt pathway were also found in the exosomal cargo (,)). These miRNA species are known to function in the cytoplasm influencing the “destruction complex” composed of the APC, Axin, GSK3β and CK1α (miR-27a/b, miR-135a/b, miR-155, miR-499). Action of these miRNAs leads to nuclear accumulation of β-catenin and the activation of various targets of the Wnt/β-catenin pathway [Citation32]. Furthermore, we chose miRNA on the basis of many reads found in sequencing data from the analysis of exosomes from human urine samples [Citation33] (,)). In contrast to the UBtip cell line, the UBtip-derived exosomes showed two highly upregulated miRNAs, namely miR-141-3p and let-7b-5p, which are known to inhibit cell proliferation [Citation37,Citation38]. However, when considering the specific cargo of the UBtip-derived exosomes, we found that many negative regulators of the Wnt pathway are actually downregulated leaving only miR-126-3p upregulated. The miR-126-3p is acting in the extracellular space by inhibiting the LRP receptor, and in the cytoplasm by activating GSK3β disabling the transport of β-catenin into the nucleus [Citation32]. UBtip-derived exosomal cargo also contained miR-27b and miR-135a, both of which positively regulate the Wnt pathway [Citation32], and miR-20a-5p and miR-30e-5p, which are known to regulate cell proliferation and invasiveness of various cancers [Citation39,Citation40]; and to increase cell survival via the Wnt pathway [Citation41].
Vesicle migration and uptake
Given the fact that the exosomes can be identified from the embryonic kidney-derived primary cells and corresponding immortalized cells, we wanted to determine if the UB-derived exosomes (UB-Exosomes) had the capacity to interact with MM derived cells, namely the mK4 cell line cells but also with the pMM cells. Thus, the purified UBtip-derived exosomes were fluorescently labelled and co-incubated with these cells ().
Figure 4. Vesicle internalization. (a) Internalization of exosomes (labelled by CellVue – red) by mK4 cell line (stained with CMFDA cell Tracker – green) over 31 h showing that 100% of cells have taken up the Exosomes (C). (b) Internalization of exosomes (labelled by CellVue, in red) by pMM cells (stained with CMFDA cell Tracker – green) presenting a similar intake of exosomes to mK4 cell line. (c) Graph presenting the percentage of mK4 cells and pMM cells that have internalized exosomes. All images (A and B) present superimposed Z-stack projections, with XY, XZ and YZ planes shown. Control has been incubated with PBS (treated the same as the actual exosomes samples). Asterisks mark cells that have internalized many exosomes and are next to cells that have not internalized any exosomes yet, marked with arrowheads. Scale bar: 20 µm.
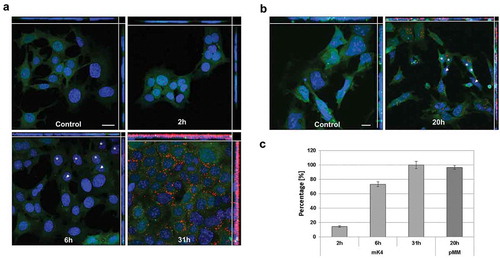
We found that the labelled exosomes not only interacted with the MM cells but also were internalized during the culture, as shown by analysing the superimposed Z-stack projections of the confocal microscopy images (,)) and time-lapse images (Supplementary Movie 1). When judging the obtained data, it should be considered that fluorescence microscopy has its limitations in resolution in the range of 390–700 nm wavelengths [Citation42]. This is important, since exosomes are commonly 30–120 nm in diameter. Small particles like this have a limited number of fluorophores that are not bright enough to cross the detection threshold. Thus, due to these current technical limitations, only clusters of fluorescent vesicles can be observed, and a super-resolution microscopic analysis would be necessary to illustrate the exosomal uptake in more detail.
The first signs of cellular uptake of the UB-derived exosomes by the mK4 cells were observed around 80 min of co-culture (). It is worth noting that not all the cells internalized the labelled exosomes. The uptake of exosomes by pMM cells appeared to require a longer incubation period, since the first internalized exosomes were observed only after 140 min of co-culture. However, after 6 h of co-culture, both the mK4 and the pMM cells had internalized many vesicles (; Supplementary Figure 2A and B). Moreover, Supplementary Movie 1 presents the process of exosomes uptake by the pMM cells over time. At the beginning of the movie, one can observe that the clusters of exosomes are suspended and floating in the medium, and as the co-culture time progresses, an increasing number of exosomes can be seen to be internalized by the pMM cells, localized at their “basolateral” side. The successful internalization of exosomes is very evident as the exosomes follow the cell movement around the culture dish (Supplementary Movie 1).
Thus, cellular uptake of the vesicles appeared to be nonlinear. In other words, it can be observed that during the first hours of co-culture, several cells had internalized many vesicles (,), asterisk), but exosome-negative cells were found in direct proximity to these exosome-positive cells (,), arrowheads). Strikingly, continued co-culture of the exosomes with the cells increased the number of exosome-positive cells, and at the time point of 24 h, most pMM cells and all of the mK4 cells had taken up vesicles ()). Thus, the UBtip-derived exosomes are competent to enter the corresponding cells, which suggests uptake mechanisms such as phagocytosis, endocytosis and macropinocytosis are involved in exosome uptake [Citation42]. The embryonic kidney-associated models provide systems to further elucidate the type of exosome entry into the cells by applying chemicals that inhibit specific endocytic pathways involved or by using specific antibodies to inhibit receptor-ligand interactions.
While the uptake of exosomes by the mK4 cell line cells and the pMM cells is apparent (), we went on to localize them more precisely within the cells. To address this question, immuno-fluorescence microscopy images were recorded as z-stacks to illustrate the spatial location of the vesicles within the cells.
These studies showed that after their entry into the embryonic kidney cells, the exosomes become polarized as they accumulated at the “basolateral cellular side” facing the site adhering to the bottom of the dish. The mechanism that directs the localization of the exosomes inside the cells and their putative intracellular molecular control is just starting to be characterized. Cellular transmembrane adhesion molecules are important to cell adhesion, morphology and migration [Citation43]. It is well known that they play an essential role in tissue repair, with cell-surface interactions contributing to cell survival, growth, differentiation and multicellular structures. Intercellular adhesion molecules such as ICAM1, P-selectin and others have been reported to be associated with exosomes [Citation44]. The localization of the exosomes in the cells may also be considered in processes such as tissue repair via involvement of their cargo in processes such as cell survival, cell division and differentiation of multicellular structures [Citation43]. Recently, it has been reported that exosomes from certain cell types induce adhesion molecules in target cells facilitating cell migration [Citation45]. However, the high content of extracellular matrix proteins in UBtip-derived exosomes, and their localization to the basal layer of cells, may suggest their role in extracellular matrix deposition in developing kidney.
Even though our analysis did not depict such miRNAs that are known to regulate Wnt/β-catenin pathway in the nucleus, it should be considered that some other miRNAs could act there via regulation of certain other target genes. It was therefore of interest to characterize the mechanisms by which exosomes deliver their cargo to the cytoplasm and the nucleus. Our results indicated that the vesicles did not remain in the cytoplasm, but also entered the nucleus ( and ). This conclusion is based on the finding that the amount of co-localized DAPI stained (cell nuclei) and CellVue stained voxels increased over time in the analysed Z-stack images (). As a matter of fact, the number of DAPI positive nuclei and the intracellular exosomes in cells cultured for 4, 6 and 31 h increased notably (). As an outgrowth of increased number of intracellular exosomes also the number of nuclear co-localized voxels increased from the mean value of 1236 voxels (4 h) and 1053 (6 h) voxels to 12 352 (31 h) co-localized voxels (p < 0.01, n = 10 images/time point) ()). The relation of co-localized voxels to all voxels above thresholds increased in the DAPI signals as seen in the percentage of co-localized voxels and Manders co-localization coefficient value M1 (p < 0.001, n = 10) ()) but not in the corresponding exosome signals ()). Instead, the percentage of co-localized voxels and Manders co-localization coefficient M2 values decreased in time (4 h vs. 31 h, p < 0.05, n = 10). This means that a larger proportion of the nuclei were co-localized with exosomes after 31 h, but the proportional distribution of exosomes between the nuclei and the cytosol was not influenced by the time, and exosomes were not accumulated more into the nucleus than the surrounding cytosolic areas as also seen in ).
Figure 5. Co-localization analysis, mK4 cells. Number of co-localized DAPI (nucleus) and CellVue (exosomes) stained voxels above the threshold values in mK4 cells. (a) Number of co-localized DAPI and CellVue stained voxels above the threshold values; after 4 h, 6 h and 31 h. Raw counts of co-localized voxels increase with time. (b) Proportional changes in the co-localization of DAPI stained voxels in different time points. Both percentage and Manders values show that the amount of co-localized DAPI increased after 31 h. (c) Proportional amount of co-localized exosomes vs all exosomes. The amount is not increasing in time, indicating non-selective accumulation of exosomes into cells instead of selective accumulation of exosomes into nuclei. This can also be seen in 4 h, 6 h and 31 h maximum intensity projection example images (d) where nuclei are shown in blue, exosomes in red and co-localized voxels in white. Scale bar: 50 µm.
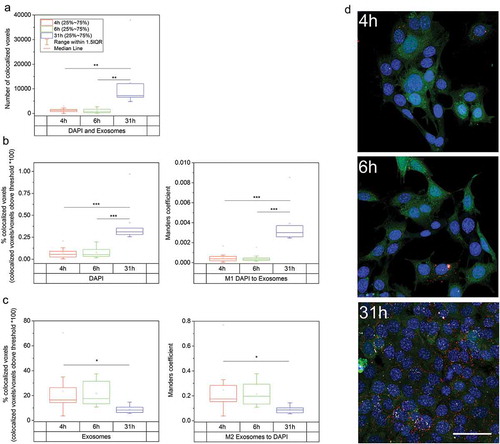
Figure 6. Co-localization analysis, pMM cells. Number of co-localized DAPI (nucleus) and CellVue (exosomes) stained voxels above the threshold values in pMM cells. (a) after 20 h. (b) Co-localization of DAPI and CellVue stained voxels in pMM cells expressed as a percentage of voxels co-localized, at 20 h. (c) Manders co-localization coefficient M1 and M2 values showing the degree of nuclear and exosome co-localization in pMM cells after 20-h exposure. (d) A representative maximum intensity projection image of one analysed field of view. (e) and (f) Lower magnification maximum intensity projection images (XY, XZ and YZ planes shown) after 0 h (E) and 17 h (F) exposure time. No intracellular exosomes are visible at the 0 h time point but the accumulation of cellular exosomes is broadly visible after 17 h. Cells are shown in green, nuclei in blue, exosomes in red and co-localized voxels in white. All scale bars represent 50 µm.
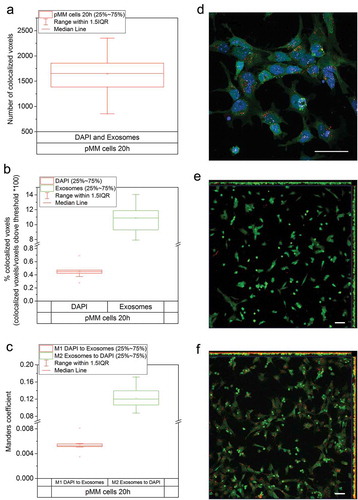
For the pMM cells, the mean number of co-localized voxels above threshold was 1644 (n = 10) after 20 h of treatment ()). On average, 0.45% of the DAPI signal was co-localized with exosomes, and 10.9% of the exosome signal was co-localized with DAPI (n = 10) ()). Corresponding Manders co-localization coefficient values were 0.005 (M1) and 0.121 (M2) ()). Large-field view images show the appearance and accumulation of intracellular exosomes into pMM cells after 17 h of exposure time (,)). These results clearly show the presence of exosomes inside the nucleus of the cells. The UB-derived exosomes are specifically taken up by the cell line cells (mK4) and the primary MM cells (pMM).
In both cell types, the exosomes not only entered the cytoplasm but also, more interestingly, entered the nucleus. This is particularly important for the exosomes to have an impact on the phenotype of the recipient cell. Thus, they need to fuse either directly with the cell’s plasma membrane or with the endosomal membranes after endocytic uptake to deliver their cargo, in particular RNA. For these reasons, we subsequently investigated if the RNA molecules, especially miRNAs, that are part of the exosomal cargo were transferred into the cytoplasm and the nucleus.
Exosomal cargo transfer of RNA
It is well known that EVs can transfer not only proteins but also different species of RNAs to target cells [Citation2]. To study if the embryonic kidney UB-Exosomes transfer their RNA cargo to the MM cells, we labelled the exosomal RNA with the ExoGlow kit (SysBio). In this setting, the cells become fluorescent only upon exosome uptake and cargo release.
Our results showed that the RNA cargo enters the cytoplasm, the nucleus and also the cellular vacuoles. Our data on exosome uptake suggest that exosomes are taken up via processes such as endocytosis. However, the cargo-transfer experiments suggest that the exosomes likely fuse directly with the plasma membrane and also the endosomal membranes, releasing their content into the cell and its compartments. We conclude that the embryonic kidney cells have the competence to take up exosomes and their RNA cargo, pointing to several mechanisms of uptake requiring further investigation.
When analysing the signal intensity of the exosomal RNA transferred into the cells, an intensity increase can be observed in the mK4 cells and the pMM cells after 24 h of culture (–) and ). The mK4 cells notably accumulated RNA already after 2 h of co-culture whereas in the pMM cells, the signal after 2 h appeared weaker. However, after 24 h of co-cultivation, the RNA signal intensity became comparable between the mK4 cells and the pMM cells. This is in good relation to the observed uptake of exosomes, which was faster in the case of mK4 cells but presenting the same level at the end of experiment.
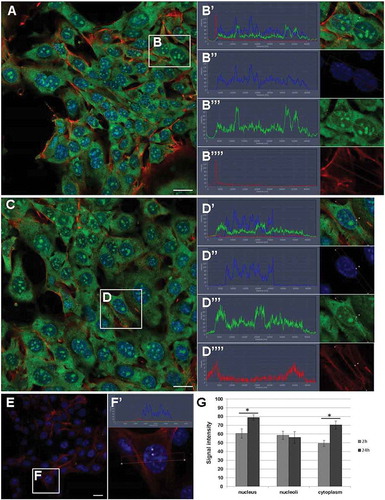
Figure 7. RNA transfer from UB-derived exosomes to mK4 cell line. (a) The RNA transfer from exosomes to mK4 cells at 2 h after co-culture of exosomes and cells. (b) The localization of RNA is very robust in the cytoplasm, but also occurs in the nucleus and nucleoli. (Bʹ–Bʺ) Example of signal intensity profiles analysed in G. (c) Intensity of RNA presence in cells after 24 h; (d) cargo transfer can be found in cytoplasm, nucleus and nucleoli. (Dʹ–Dʺ) Example of signal intensity profiles analysed in G. (e) Control sample showed lack of RNA label in cells in the absence of exosomes. (fʹ) Example of signal intensity profiles of control sample. (g) Comparison of RNA signal intensity between 2 h and 24 h samples showed significant differences (*p ≤ 0.001) in nucleus and cytoplasm where after 24 h accumulation was observed. Green – RNA (from exosomes), red – phalloidin (filamentous actin), blue – DAPI (nucleus); scale bar: 20 µm.
In the mK4 cells, the RNA signal was localized in the cytoplasm in a rather uniform way (), whereas in the pMM cells the RNA was detected in the cytoplasm and cytoplasmic vacuoles (), arrowheads). The signal in the vacuoles was only observed in the pMM cells, not in the mK4 cells. On average, the intensity of the RNA signal in the vacuoles was about twice as high as in the cytoplasm, and about 1.5 times as high as in the nucleus (data not shown).
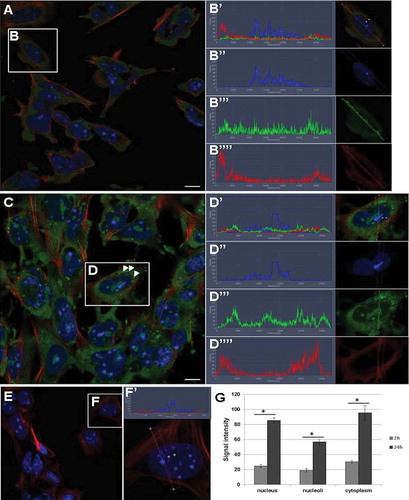
Figure 8. RNA transfer from UB-derived exosomes to pMM cells. (a) RNA transfer from exosomes to pMM cells at 2 h after co-culture of labelled exosomes and cells. (b) The localization of RNA is very robust in the cytoplasm, but also occurs in the nucleus and nucleoli. (Bʹ–Bʺ) Example of signal intensity profiles analysed in G. (c) Intensity of RNA presence in cells after 24 h. (d) The RNA signal is much more intense at 24 h and can be found in the cytoplasm, nucleus and nucleoli. Arrowheads point to cytoplasmic vacuoles with high RNA signal intensity. (Dʹ–Dʺ) Example of signal intensity profiles analysed in G. (e) Control sample showed lack of RNA label in cells in the absence of exosomes. (fʹ) Example of signal intensity profiles of control sample. (g) Comparison of RNA signal intensity between 2 h and 24 h samples showing significant difference (*p ≤ 0.0001) in nucleus, nucleoli and cytoplasm where high accumulation was observed after 24 h. Green – RNA (from exosomes), red – phalloidin (filamentous actin), blue – DAPI (nucleus); scale bar: 10 µm.
The vacuoles provide specialized environments for various biochemical and biophysical processes. It is known that especially in mammalian embryonic tissues, vacuoles play an important role in tissue differentiation and patterning through the regulation of cellular signalling during organogenesis [Citation46]. Therefore, it may not be unexpected to find the exosomal RNA accumulated in the vacuoles. Many of the vacuoles contain lysozymes, and their task is the degradation of the molecules [Citation46]. Is this process comparable with a situation in vivo? Given that the fluorescence signal is much higher in the vacuoles of the primary cells (pMM) than in those of the immortalized cells (mK4) (both cell types were co-cultured with the same amount of exosomes), this suggests that it is comparable with an in vivo process. Primary MM cells may deal with an increased influx of RNA into the cell by partly directing it towards the vacuoles. What this means in terms of signal transduction through exosomal RNA, its downstream effects on the target cell and subsequently the developing kidney as a whole, requires further investigation.
Exosomes in nephrogenesis induction
Our results indicated that the exosomes and their RNA cargo enter the cytoplasm and the nucleus of the pMM cells. We also identified several miRNA species that are involved in regulating the Wnt/β-catenin pathway. We therefore wanted to determine if this may have some specific function, for example in the MM induction process triggering nephrogenesis. To study this, we generated renal organoids from pMM cells [Citation47]. We were able to show that pMM and pUB separated by dissection and digestion can be recombined and will develop tubule-like structures if cultured over several days (). If the pUB was replaced by cells from the UBtip cell line used in this work, similar data were obtained ().
To investigate the potency of the UB-Exosomes (pUB and cell line) we co-cultured the pMM with exosomes in place of inducers. As can be seen in the positive control sample (–)), induced to undergo tubulogenesis by BIO (Wnt pathway activator, inhibiting GSK3), the MM cells become organized into so-called pre-tubular aggregates. It is noteworthy that the nuclei of such cells appeared larger than those of the uninduced MM cells around them. In the negative control sample (–h)), where tubulogenesis was not experimentally activated in embryonic MM tissue, the cells failed to organize into structures, but were instead more randomly arranged and appeared apoptotic.
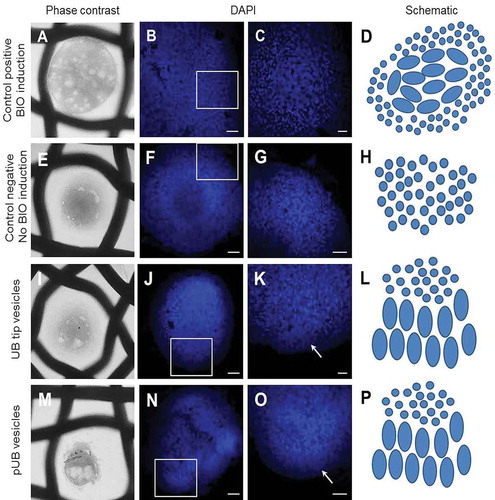
Figure 9. Effect of exosomes on renal organoids. (a–d) Positive control sample induced to tubulogenesis with BIO; (e–h) negative control sample where the induction of tubulogenesis was omitted; (i–l) renal organoid treated with UBtip-derived exosomes; arrow in I points to cellular organization at the edge of the organoid; (m–p) renal organoid treated with pUB- derived conditioned medium; arrow in L points to cellular organization at the edge of the organoid. D, H, L, P – schematic of nuclear organization/induction; Scale bar: B, E, F, H, K, L – 50 µm, C and I – 20 µm.
In the exosomes-induced organoids, small areas of cellular organization were noted at the edges of the organoids (–l), arrow), and their nuclei resembled those of positive controls in MM induced to form the pre-tubular cell aggregates. Advanced cellular organization could be observed in the embryonic kidney organoids induced with the pUB-derived vesicle enriched CM (–p)). These organoids presented a larger area of organized cells with nuclei similar to those of pre-tubular aggregates in the positive control sample. It is worth noting that in the culture conditions, we have omitted any addition of survival factors such as BMP7 and FGF2 [Citation11]. Therefore, the effect of some structural arrangement of the cells within the organoids is due to the action of exosomes (UBtip-derived exosomes) or CM (pUB-derived vesicles). The effect of pUB-derived vesicles appeared to be stronger, and may be due to the use of vesicles enriched CM instead of purified exosomes. This difference in the procedure was due to the very small size of the pUB tissue sample dissected from embryonic kidney.
Although the CM was concentrated and filtered (100 kDa cut-off) some inductive molecules that were secreted by the pUB cells could still be present in the medium, and the “induction” we observe is due to a combination of these factors and the exosomes. However, the CM was filtered and concentrated using 100 kDa filter units. Many signal molecules important in nephrogenesis (e.g. six2, pax2, bmp7, wnt5a) are larger than 100 kDa, and thus should have been removed from the sample prior to the addition of the vesicles to the pMM.
The MM when treated with exosomes did not become fully induced, and the nephrogenesis programme did not start. However, the exosome-treated MM pellets presented an obvious different cellular organization and also had notably less apoptotic cells when compared with the non-induced control. We speculate that this effect comes from the specific exosomal cargo, as the UBtip-derived exosomes contain many proteins related to tissue morphogenesis and homeostasis as discussed above and miRNAs upregulating the Wnt pathway and increasing cell survival. Moreover, miR-135a, which we found highly upregulated in the UBtip-derived exosomes ()), has already been shown to play an important role in activating the Wnt/β-catenin pathway in tooth mesenchyme differentiation [Citation9]. In the renal MM, it may have the same effect, but this remains to be investigated in further detail. Given all these data, we speculate that the exosomes might be involved in early kidney tubule induction mediated by Wnt signalling. Together, the demonstrated embryonic kidney MM model provides an assay system to assess the detailed entry mechanisms and functions controlling and regulating kidney development.
Conclusions
In this study, we show for the first time the presence of exosomes and vesicles from an UBtip immortalized cell line and, even more interestingly, from primary embryonic UB cells. We were able to isolate and enrich vesicles, respectively. It needs to be mentioned that a clear limitation in working with embryonic organs is the low number of isolated primary cells and hence the low amount of EVs that can be obtained.
Our results show that exosomes obtained from immortalized cell lines are potent and give a first insight into the role of exosomes during nephrogenesis. They carry proteins that are important for the organization of the extracellular matrix, cell shape, tissue integrity and homeostasis as well as tissue morphogenesis. Furthermore, their cargo contains different miRNAs with regulatory properties influencing Wnt pathways. UB exosomes interact with MM cells through different ways of exosomal material transfer – exosomes as a whole enter the cell, and their RNA cargo is released into the cytoplasm. Furthermore, exosomes and their RNA cargo are transferred not only to the cytoplasm but also to the nucleus, which is of great importance in signal transduction and exertion of influence of the exosomes on the metabolism and phenotype of the target cells. Moreover, we showed for the first time the effect of exosomes on the initial stages of kidney development, where they increase cellular organization and apparently cell survival.
The embryonic kidney represents a classic model system that has been used to study the cellular and molecular mechanisms of cell and tissue interactions collectively named as a process of embryonic induction. Inductive interactions occur also later during organogenesis, and in the kidney, for example, these occur between epithelial and mesenchymal tissues [Citation48]. Such molecules that mediate the embryonic inductive interactions and are involved in the associated pattern formation are called the morphogens [Citation48,Citation49]. A wealth of data have been generated that indicate a role for several growth factors in the inductive cell and tissue interactions such as the FGFs, TGF beta/BMP, Hedgehog and Wnt signals [Citation50,Citation51] but whether these serve as morphogens is still debatable. The identification of the exosomes and the data presented herein raise the possibility that the exosomes serve as a novel but apparently evolutionary ancient embryonic signalling system. The embryonic kidney model system derived data presented here confirm that indeed RNA species are transferred in association with the process of embryonic induction, being a universal mechanism in the coordination of morphogenesis. Thus, we can conclude that the exosomes provide a newly identified source of signalling with putative relevance to organogenesis. However, the mechanisms by which exosomes act in nephrogenesis remain to be investigated.
In the kidney, the key mechanism triggered by inductive signals is the process of nephrogenesis constructing the functional excretory unit of the kidney. The ex vivo and in vivo evidence indicates that in the embryonic kidney, the induction process involves Wnts, and they are sufficient to trigger the nephrogenesis developmental programme [Citation12]. Indeed, the nephrogenesis process can also be induced with a small-molecule lithium chloride or BIO that serves downstream activators of the Wnt signalling pathway [Citation15,Citation52,Citation53]. Based on our data, exosomes purified from the inductive UB failed to induce nephrogenesis. Such exosomes had however a notable effect on the MM. The failure of the exosomes to induce nephrogenesis may be their limited number or the mode by which they are presented to the competent metanephric mesenchymal target cells. In summary, the results presented in this study indicate that the embryonic induction process involves exosomes as a signalling system.
Abbreviations
| BCA | = | bicinchoninic acid assay |
| BSA | = | bovine serum albumin |
| CM | = | conditioned medium |
| DAVID | = | Database for Annotation, Visualization and Integrated Discovery |
| DMEM | = | Dulbecco’s Modified Eagle Medium |
| EVs | = | extracellular vesicles |
| FBS | = | fetal bovine serum |
| GDNF | = | glial cell line-derived neurotrophic factor |
| GO term | = | gene ontology term |
| mK4 | = | metanephric mesenchyme cell line |
| MM | = | metanephric mesenchyme |
| pMM | = | primary metanephric mesenchyme cells |
| MSCs | = | mesenchymal stem cells |
| NTA | = | nanoparticle tracking analysis |
| PBS | = | phosphate-buffered saline |
| SDS-PAGE | = | sodium dodecyl sulfate polyacrylamide gel electrophoresis |
| UB | = | ureteric bud |
| UB-Exosomes | = | ureteric bud-derived exosomes |
| pUB | = | primary ureteric bud cells |
| UBtip | = | ureteric bud cell line |
Authors’ contributions
MK and AR planned and coordinated all experimental work, wrote the manuscript and prepared the figures. MK and AR conducted all experimental work related to the vesicles and analysed all data. FN and AR conducted the RNA work. MK, AR and FN analysed the proteomics and RNA data and prepared the figures. MK and US carried out experiments involving kidney-like pellets and the isolation of primary cells. CS helped with the optimization of the vesicle isolation protocols. VPR analysed the light microscopy data. GB has assisted with the NTA and the RNA work. MK, AR and SV designed the underlying experiments and revised the manuscript. All authors read and approved the final version of the manuscript.
supplemntal_data.zip
Download Zip (7.1 MB)Acknowledgements
We thank Paula Haipus, Hannele Härkman, Johanna Kekolahti-Liias and the BCO Electron Microscopy Core Facility (Ilkka Miinalainen, Sirpa Kellokumpu, and Tarja Piispanen) for technical assistance, and Joonas Malinen for technical assistance and collection of NTA data. Mass spectrometry analysis was performed at the Turku Proteomics Facility, University of Turku and Åbo Akademi University. The facility is supported by Biocenter Finland.
Disclosure statement
No potential conflict of interest was reported by the authors.
Supplementary materials
Supplementary data for this article can be accessed here.
Additional information
Funding
Related Research Data
References
- Raposo G, Stoorvogel W. Extracellular vesicles: exosomes, microvesicles, and friends. J Cell Biol. 2013 Feb 18;200(4):1–18.
- Valadi H, Ekström K, Bossios A, et al. Exosome-mediated transfer of mRNAs and microRNAs is a novel mechanism of genetic exchange between cells. Nat Cell Biol. 2007;9(6):654–659.
- Fatima F, Nawaz M. Stem cell-derived exosomes: roles in stromal remodeling, tumor progression, and cancer immunotherapy. Chin J Cancer. 2015;34(3):1.
- Krause M, Rak-Raszewska A, Pietilä I, et al. Signaling during kidney development. Cells. 2015;4(2):112–132.
- Gradilla A, González E, Seijo I, et al. Exosomes as hedgehog carriers in cytoneme-mediated transport and secretion. Nat Commun. 2014;5:5649.
- McGough IJ, Vincent JP. Exosomes in developmental signalling. Development. 2016 Jul 15;143(14):2482–2493.
- Krause M, Samoylenko A, Vainio SJ. Exosomes as renal inductive signals in health and disease, and their application as diagnostic markers and therapeutic agents. Front Cell Dev Biol. 2015;3.
- Grange C, Tapparo M, Collino F, et al. Microvesicles released from human renal cancer stem cells stimulate angiogenesis and formation of lung premetastatic niche. Cancer Res. 2011 Aug 1;71(15):5346–5356.
- Jiang N, Xiang L, He L, et al. Exosomes mediate epithelium-mesenchyme crosstalk in organ development. ACS Nano. 2017;11:7736–7746.
- Brown AC, Muthukrishnan SD, Oxburgh L. A synthetic niche for nephron progenitor cells. Dev Cell. 2015;34(2):229–241.
- Dudley AT, Godin RE, Robertson EJ. Interaction between FGF and BMP signaling pathways regulates development of metanephric mesenchyme. Genes Dev. 1999 Jun 15;13(12):1601–1613.
- Kispert A, Vainio S, McMahon AP. Wnt-4 is a mesenchymal signal for epithelial transformation of metanephric mesenchyme in the developing kidney. Development. 1998 Nov;125(21):4225–4234.
- Stark K, Vainio S, Vassileva G, et al. Epithelial transformation of metanephric mesenchyme in the developing kidney regulated by wnt-4. Nature. 1994 Dec 15;372(6507):679–683.
- Carroll TJ, Vize PD. Synergism between pax-8 and lim-1 in embryonic kidney development. Dev Biol. 1999;214(1):46–59.
- Kuure S, Popsueva A, Jakobson M, et al. Glycogen synthase kinase-3 inactivation and stabilization of beta-catenin induce nephron differentiation in isolated mouse and rat kidney mesenchymes. J Am Soc Nephrol. 2007 Apr;18(4):1130–1139.
- Rak-Raszewska A, Hauser PV, Vainio S. Organ in vitro culture: what have We Learned about early kidney development? Stem Cells Int. 2015;2015:16.
- Pietilä I, Vainio SJ. Kidney development: an overview. Nephron Exp Nephrol. 2014;126(2):40–44.
- Lancaster MA, Knoblich JA. Organogenesis in a dish: modeling development and disease using organoid technologies. Science. 2014 Jul 18;345(6194):1247125.
- Junttila S, Saarela U, Halt K, et al. Functional genetic targeting of embryonic kidney progenitor cells ex vivo. J Am Soc Nephrol. 2015 May;26(5):1126–1137.
- Leclerc K, Costantini F. Mosaic analysis of cell rearrangements during ureteric bud branching in dissociated/reaggregated kidney cultures and in vivo. Dev Dyn. 2016;245(4):483–496.
- Vainio S, Karavanova I, Jowett A, et al. Identification of BMP-4 as a signal mediating secondary induction between epithelial and mesenchymal tissues during early tooth development. Cell. 1993;75(1):45–58.
- Théry C, Amigorena S, Raposo G, et al. Isolation and characterization of exosomes from cell culture supernatants and biological fluids. Curr Protoc Cell Biol. 2006;3(22. 1,3.22):29.
- Barasch J, Pressler L, Connor J, et al. A ureteric bud cell line induces nephrogenesis in two steps by two distinct signals. Am J Physiol. 1996 Jul;271(1 Pt 2):F50–F61.
- Saxen L, Toivonen S. Primary embryonic induction. London: Academic Press; 1962.
- Valerius MT, Patterson LT, Witte DP, et al. Microarray analysis of novel cell lines representing two stages of metanephric mesenchyme differentiation. Mech Dev. 2002;112(1–2):219–232.
- Witwer KW, Buzás EI, Bemis LT et al. Standardization of sample collection, isolation and analysis methods in extracellular vesicle research. J Extracell Vesicles 2013;2(1)
- Van Deun J, Mestdagh P, Sormunen R, et al. The impact of disparate isolation methods for extracellular vesicles on downstream RNA profiling. J Extracell Vesicles. 2014;3: doi:10.3402/jev.v3.24858.
- Huang DW, Sherman BT, Lempicki RA. Systematic and integrative analysis of large gene lists using DAVID bioinformatics resources. Nat Protoc. 2009;4(1):44–57.
- Huang DW, Sherman BT, Lempicki RA. Bioinformatics enrichment tools: paths toward the comprehensive functional analysis of large gene lists. Nucleic Acids Res. 2008;37(1):1–13.
- Vella LJ, Scicluna BJ, Cheng L, et al. A rigorous method to enrich for exosomes from brain tissue. J Extracell Vesicles. 2017;6(1):1348885.
- Pathan M, Keerthikumar S, Ang C, et al. FunRich: an open access standalone functional enrichment and interaction network analysis tool. Proteomics. 2015;15(15):2597–2601.
- Sun X, He Y, Huang C, et al. Distinctive microRNA signature associated of neoplasms with the wnt/β-catenin signaling pathway. Cell Signal. 2013;25(12):2805–2811.
- Cheng L, Sun X, Scicluna BJ, et al. Characterization and deep sequencing analysis of exosomal and non-exosomal miRNA in human urine. Kidney Int. 2014;86(2):433–444.
- Kankaanpää P, Paavolainen L, Tiitta S, et al. BioImageXD: an open, general-purpose and high-throughput image-processing platform. Nat Methods. 2012;9(7):683–689.
- Costes SV, Daelemans D, Cho EH, et al. Automatic and quantitative measurement of protein-protein colocalization in live cells. Biophys J. 2004;86(6):3993–4003.
- Vlassov AV, Magdaleno S, Setterquist R, et al. Exosomes: current knowledge of their composition, biological functions, and diagnostic and therapeutic potentials. Biochim Biophys Acta (BBA)-Gen Subj. 2012;1820(7):940–948.
- Qiu W, Kassem M. miR-141-3p inhibits human stromal (mesenchymal) stem cell proliferation and differentiation. Biochim Biophys Acta (BBA)-Mol Cell Res. 2014;1843(9):2114–2121.
- Xu H, Liu C, Zhang Y, et al. Let-7b-5p regulates proliferation and apoptosis in multiple myeloma by targeting IGF1R. Acta Biochim Biophys Sin. 2014;46(11):965–972.
- Fan X, Liu Y, Jiang J, et al. miR-20a promotes proliferation and invasion by targeting APP in human ovarian cancer cells. Acta Biochim Biophys Sin. 2010;42(5):318–324.
- Kang H, Wang F, Wei Q, et al. miR‐20a promotes migration and invasion by regulating TNKS2 in human cervical cancer cells. FEBS Lett. 2012;586(6):897–904.
- Liu K, Xie F, Gao A, et al. SOX2 regulates multiple malignant processes of breast cancer development through the SOX2/miR-181a-5p, miR-30e-5p/TUSC3 axis. Mol Cancer. 2017;16(1):62.
- Mulcahy LA, Pink RC, Carter DRF. Routes and mechanisms of extracellular vesicle uptake. J Extracell Vesicles. 2014;3: doi:10.3402/jev.v3.24641.
- Wilson CJ, Clegg RE, Leavesley DI, et al. Mediation of biomaterial-cell interactions by adsorbed proteins: A review. Tissue Eng. 2005;11(1–2):1–18.
- Théry C, Zitvogel L, Amigorena S. Exosomes: composition, biogenesis and function. Nat Rev Immunol. 2002;2(8):569–579.
- Tang N, Sun B, Gupta A, et al. Monocyte exosomes induce adhesion molecules and cytokines via activation of NF-κB in endothelial cells. FASEB J. 2016 Sep;30(9):3097–3106.
- Wada Y. Vacuoles in mammals: A subcellular structure indispensable for early embryogenesis. Bioarchitecture. 2013;3(1):13–19.
- Saarela U, Akram SU, Desgrange A, et al. Novel fixed Z-dimension (FiZD) kidney primordia and an organoid culture system for time-lapse confocal imaging. Development. 2017 Feb 20.
- Gurdon JB. Embryonic induction–molecular prospects. Development. 1987 Mar;99(3):285–306.
- Smith JC. Forming and interpreting gradients in the early xenopus embryo. Cold Spring Harb Perspect Biol. 2009 Jul;1(1):a002477.
- Wang X, Thesleff I. Tooth development. In: Unsicker K, Krieglstein K, editors. Cell signaling and growth factors in development. Weinheim, Germany: Wiley-VCH Verlag GmbH; 2005. p. 719–754. doi:10.1002/9783527619689.ch19.
- Thesleff I, Mikkola M. The role of growth factors in tooth development. Int Rev Cytol. 2002;217:93–135.
- Halt KJ, Pärssinen HE, Junttila SM, et al. CD146(+) cells are essential for kidney vasculature development. Kidney Int. 2016;90(2):311–324.
- Davies J, Lyon M, Gallagher J, et al. Sulphated proteoglycan is required for collecting duct growth and branching but not nephron formation during kidney development. Development. 1995 May;121(5):1507–1517.