
ABSTRACT
Extracellular vesicles (EVs) have a great potential in clinical applications. However, their isolation from different bodily fluids and their characterisation are currently not optimal or standardised. Here, we report the results of examining the performance of ultrafiltration combined with size exclusion chromatography (UF-SEC) to isolate EVs from urine. The results reveal that UF-SEC is an efficient method and provides high purity. Furthermore, we introduce asymmetrical-flow field-flow fractionation coupled with a UV detector and multi-angle light-scattering detector (AF4/UV-MALS) as a characterisation method and compare it with current methods. We demonstrate that AF4/UV-MALS is a straightforward and reproducible method for determining size, amount and purity of isolated urinary EVs.
Introduction
Extracellular vesicles (EVs) are sub-micron (40–1000 nm), membranous vesicles that are excreted from cells into the extracellular space under normal and pathological conditions [Citation1]. They are a promising source of diagnostic biomarkers in oncology as well as other diseases [Citation2,Citation3]. EVs from urine can reveal urological diseases or tumours and their progression [Citation2,Citation4,Citation5]. Despite the potential applications of EVs, their detection, isolation and characterisation from different bodily fluids are currently not optimal or standardised due to their small size and low refractive index (RI) [Citation6, Citation7, Citation8, Citation9, Citation10].
To date, differential ultracentrifugation (UC) is the gold standard to isolate EVs [Citation10,Citation11]. However, this isolation procedure has major disadvantages: G-forces are rotor dependent and non-vesicular material (e.g. protein aggregates) are co-isolated [Citation12,Citation13]. Also, aggregation and disruption of EVs occur [Citation14]. Recently, size exclusion chromatography (SEC) has been used to isolate EVs [Citation15–Citation17].
Commonly used EV characterisation methods are western blotting, transmission electron microscopy (TEM), nanoparticle tracking analysis (NTA) and flow cytometry. However, they still have some limitations due to the low RI of EVs and their size range where contaminants, such as liposomes, can be detected as artefacts [Citation18]. The benefits and limitations of each characterisation technique are listed in [Citation19–Citation24].
Table 1. Limitations and benefits of standard EV characterisation methods.
A technique with a strong potential to overcome these difficulties is asymmetrical-flow field-flow fractionation (AF4) in combination with a multi-detection system: UV and multi-angle light-scattering (MALS) [Citation25]. It has been used for fractionation of EVs harvested from immortalised human mesenchymal [Citation26] and neural [Citation27] stem cell cultures, and for size separation and characterisation of EVs from a mouse melanoma cell culture line [Citation28]. However, AF4/UV-MALS is currently not a widely used method in EV research [Citation24]. We aim to evaluate the feasibility of ultrafiltration combined with SEC (UF-SEC) for the isolation of EVs from urine using different characterisation techniques and compare them with AF4/UV-MALS.
Results
SEC fractionation
Urine samples were concentrated using 100 kDa molecular weight cut off (MWCO) Centricon® Plus-70 Centrifugal Filter Units (Merck Millipore Ltd, Ireland). The filtrate was loaded on a commercially available qEV SEC column (Izon Science Ltd, New Zealand) and 500 µL-fractions were collected.
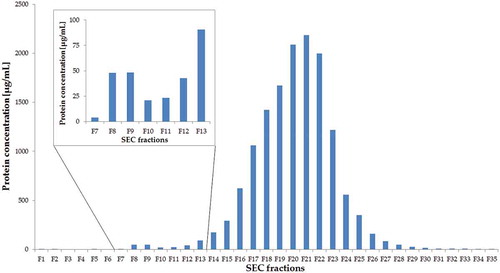
The protein concentration of each fraction after UF-SEC was determined to check the efficacy of UF-SEC to separate EVs from urinary bulk proteins (). In fractions 1 through 6, the dead volume of the column was captured. A small increase in protein concentration of fractions 8 and 9 (48.1 and 48.4 µg/mL, respectively) was seen, containing the vesicles. This results in an EV protein yield of 0.81 µg per mL urine. From fraction 12 and onwards, there was a large increase in protein content due to the elution of urinary bulk proteins.
Figure 1. Protein concentrations of UF-SEC fractions. This figure indicates the protein concentration (µg/mL) in the 500 µL-fractions 1 through 35 after UF-SEC. The insert is a magnification of the graph from fractions 7 through 13.
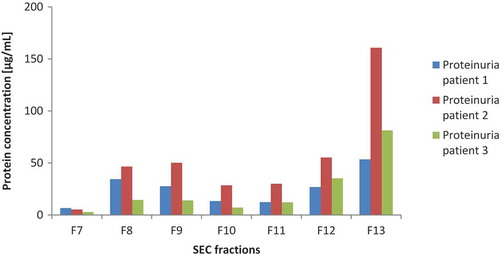
Urine samples of proteinuria patients (patient 1: 30 mg/dL, patient 2 and 3: 300 mg/dL) were used for the isolation of EVs to investigate the influence of a large amount of urinary bulk proteins on the separation of urinary EVs from these proteins using UF-SEC. indicates the protein concentrations of fraction 7 through 13. The results demonstrated that the elution of EVs and bulk proteins are still separated, as found in the EV isolation of healthy individuals.
Figure 2. Protein concentration of UF-SEC fractions of proteinuria patients. This figure shows the protein concentration (µg/mL) in 500 µL-fractions 7 through 13 after UF-SEC of 3 proteinuria patients.
Western blotting
shows the detection of EV-specific protein Flotillin-1 in UF-SEC fractions 7 through 14. In ), the same volume (37.5 µL) of each fraction was loaded. Less volume was loaded of a 15 times-diluted filtrate after UF (12 µL), which resulted in approximately a 10 times-higher protein content loaded compared to that of the UF-SEC fractions. In fractions 8 and 9, clear bands were visible indicating an enrichment of EV-specific protein Flotillin-1. From fraction 10, the intensity of the bands decreased. In ), an equal amount of protein (350 ng) of each UF-SEC fraction was loaded (and 9 µg of a 15 times-diluted filtrate). Here, fractions 8 through 11 showed clear bands, indicating these fractions are enriched in EVs. Fraction 10 and 11 showed lower concentrations of Flotillin-1 because a higher volume was needed to load 350 ng of proteins. From fraction 12 onwards, the intensity of the bands decreased and less volume of the fraction was needed to obtain the same amount of proteins, which indicated that other non-EV proteins were more abundant in these fractions. Consequently, the purity of EVs decreased from fraction 12 onwards. Primary antibodies against other EV-specific proteins, CD9 and HSP70, were also used (data not shown). These proteins were also present in the EV-relevant fractions as confirmed in the protein identification using LC-MS/MS.
Figure 3. Western blot detection of Flotillin-1 in a non-fractionated filtrate after UF and UF-SEC fractions. (a) An equal volume of UF-SEC fractions 7 through 14 (37.5 µL) was loaded; (b) An equal amount of proteins (350 ng) was loaded of each UF-SEC fraction.
Protein identification by LC-MS/MS
LC-MS/MS analysis was done in a pooled fraction 8 and 9. Three technical replicates of the MS sample preparation procedure and LC-MS/MS analysis were conducted and 552, 552 and 506 proteins were identified, respectively. In total, 670 different proteins were detected and 402 proteins were identified in every replicate. An overview of all identified proteins is shown in the supplementary data. A gene ontology (GO) enrichment was done using FuncAssociate 3.0. shows the top 10 of the GO enrichment of the identified proteins in the three replicates against a urine background (sorted by lowest p-value). Of the 670 identified proteins, 575 are EV related according the GO annotation. This results in 86% of the identified proteins that are EV related. The urine background is also already enriched in EV proteins, relative to the total proteome background (41% EV proteins). This results in a relative enrichment of 2.10.
Table 2. Top 10 GO enrichment.
Transmission electron microscopy (TEM)
Transmission electron microscopy (TEM) is a commonly used technique to visualise EVs and characterise their morphology and size. In , TEM images of fraction 9 are shown. The EVs were in the size range of 40 to 100 nm. Small round particles (10 nm) were present, which could be high-density lipoproteins (HDLs) ()).
Figure 4. TEM images of UF-SEC fraction 9: Scale bars are: 200 nm (a) and 100 nm (b,c).
Nanoparticle tracking analysis (NTA)
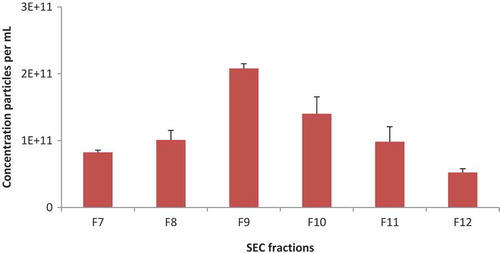
Particle concentration was determined by NTA using a NanoSight NS500 instrument in scatter mode. shows the concentration of particles per mL of fractions 7 through 12 using 3 recordings. We concluded that fraction 9 contained the highest amount of particles per mL, resulting in 1.8E9 particles per mL urine.
Figure 5. Concentration of particles per mL of fractions using UF-SEC by means of NTA using a NanoSight NS500 instrument. Scale bars indicate standard deviation of multiple readings (n = 3).
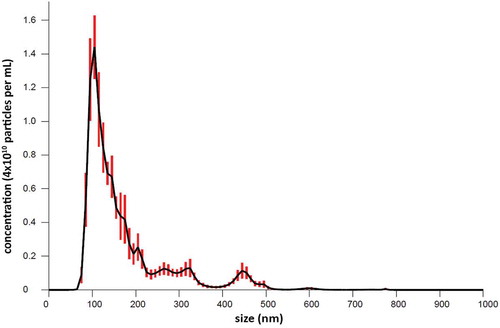
The distribution of the particle size was also determined with NTA. shows the size distribution of fraction 9 using 6 recordings. The mean size is 171.7 ± 6.4 nm and the mode size is 108.0 ± 3.6 nm, resulting in a coefficient of variance (cv) of 3.7 and 3.3, respectively.
Figure 6. Size distribution of particles present in fraction 9 after UF-SEC. The x-axis shows the size ranges, the y-axis the concentration of the particles per mL. Scale bars indicate standard deviation of multiple readings (n = 6).
Asymmetrical-flow field-flow fractionation (AF4) coupled with UV detection and multi-angle light-scattering (MALS)
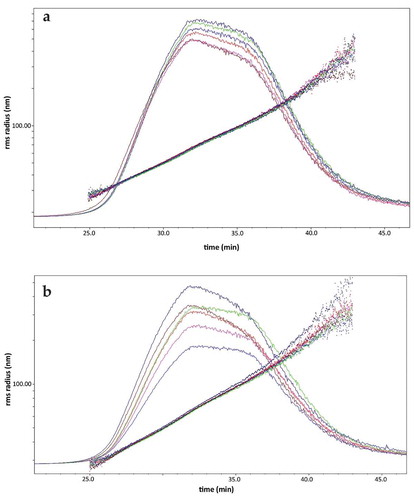
Although NTA is a commonly used technique for the characterisation of EVs, it has some drawbacks as mentioned in the introduction. Here, we used AF4 coupled with UV and MALS detectors for the characterisation and quantification of urinary EVs. We adapted the protocol of Sitar and colleagues [Citation24]. The technical variability of the AF4/UV-MALS protocol and its performance in combination with UF-SEC was evaluated (). For the technical variability of the AF4/UV-MALS protocol itself, a pooled UF-SEC fraction 8 and 9 was loaded six times. The relative light scattering (LS) signal and root-mean-square radius (vesicle size, rms radius) of the six runs are shown in ). After 32 min, the rms radius values of the six replicates were calculated, the standard deviation and cv was 1.1 and 1.7, respectively. The UF-SEC-AF4/UV-MALS workflow was also evaluated. Six identical urine samples were used for UF-SEC and the six pooled UF-SEC fractions 8 and 9 were loaded on AF4/UV-MALS. After 32 min, the standard deviation and cv of the six rms radius values was 0.8 and 1.1, respectively. These results suggest that AF4/UV-MALS has a low technical variation, even in combination with UF-SEC.
Figure 7. Accuracy testing of the AF4/UV-MALS workflow. The rms radius and relative LS signal are shown. (a) Accuracy of the AF4/UV-MALS method was tested by loading the same sample six times; (b) Accuracy of the UF-SEC-AF4/UV-MALS method was evaluated using six identical urine samples for this workflow.
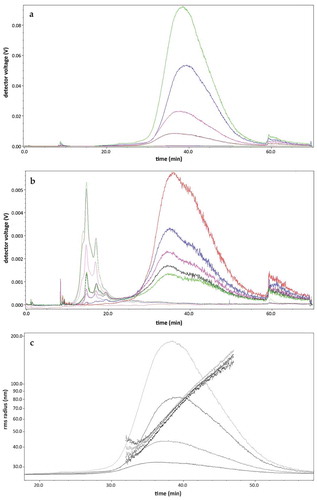
) shows the LS and UV signal of UF-SEC fractions 8 through 11. The void peak was detected from 8 to 10 min. EVs eluted from 30 to 50 min, where the LS signal increases. The results demonstrated that EVs were more enriched in F9 > F8 > F10 > F11 in this isolation procedure. There was no UV signal in these fractions (): flat dotted line), which was present from fraction 12 and beyond in the time range from 12th to 25th min ()). The amount of proteins detected increased in the latter fractions and the LS signal decreased further. The rms radius is shown in ). The EVs were in the size range of 40–160 nm.
Figure 8. AF4/UV-MALS fractograms of fractions after UF-SEC. (a) The LS (full line) and UV (dotted line) signal of fractions 8 (blue), 9 (green), 10 (pink) and 11 (brown) are shown. Particles elute from 30 to 55 min. There is no UV signal detected; (b) This graph showed a AF4/UV-MALS fractogram of the fractions 12 (red), 14 (blue), 16 (pink), 18 (black) and 20 (green). The particles giving an UV signal elute from minute 12 until 25; (c) The LS (full line) signal of fractions 8 (blue), 9 (green), 10 (pink) and 11 (brown) are shown. The rms radius (dotted line) is shown on a logarithmic scale per 10 nm.
Discussion
Despite the huge potential of EVs, their isolation is currently not optimal or standardised [Citation10]. This research paper evaluates UF-SEC as a method for the enrichment of urinary EVs. Furthermore, AF4/UV-MALS is studied as a characterisation method for urinary EVs.
A pre-processing step prior to SEC to concentrate urine and consequently EVs is necessary. UF has been previously used by Lozano-Ramos et al. [Citation15]. In contrast, we used lower volumes of cell free (CF) urine (40 to 70 mL), the centrifugation step was longer and the speed was higher (3,500 × g for 30 min instead of 2,800 × g for 20 min). This resulted in a smaller volume of filtrate (100 to 300 µL), which is optimal for the qEV SEC column (recommended sample volume is 100 to 500 µL). Commercial available qEV SEC columns were used to increase reproducibility.
EVs were enriched in UF-SEC fractions 8 and 9. It was found that from fraction 12 and onwards, EVs were still present but less abundant and with contamination of bulk urinary proteins. To verify if the presence of a large amount of proteins in the urine influences the separation of the EVs from the urinary bulk proteins using UF-SEC, urine samples of proteinuria patients were used. Even for patients with high amounts of proteins (300 mg/dL), the elution peak of the vesicles and bulk proteins were still separated.
A list of identified proteins in a pooled fraction 8 and 9 using LC-MS/MS is provided in the supplementary data. Importantly, an International Society for Extracellular Vesicles (ISEV) position statement suggested the minimal requirements for the definition of EVs [Citation29]. The presence or absence of different types of proteins is among those requirements. Plenty of EV-specific proteins, such as CD9, CD81 and HSP70 could be detected. In contrast, CD63 could not be identified. A possible explanation is that this protein was present in a very small amount or even absent in the UF-SEC fractions 8 and 9. CD63 is also highly glycosylated, maybe complicating the trypsinisation of this protein using this sample preparation protocol. In total, 670 proteins were detected in three technical replicates of the sample. GO terms including extracellular membrane-bounded organelle, extracellular vesicle and extracellular exosome were enriched. From the 670 proteins that were identified, 86% were EV-related and this resulted in a relative enrichment of EV-related proteins of 2.10 against a urine background.
Unfortunately, the main abundant soluble protein in urine, uromodulin, was however detected. Moreover, apolipoproteins A-I and D could be identified, indicating the presence of high-density lipoproteins (HDLs). A density gradient could enhance the purity of the EV fraction by removing some of the contaminants. Nevertheless, this technique is time-consuming (>24 h) and contamination with HDLs still occurs due to their similar buoyant density [Citation16]. This step also results in a loss of EVs and is impractical to implement in a clinical setting [Citation30]. Since mass spectrometry is sensitive for viscous contaminants, adding chemical components, such as iodixanol, complicates the proteomic analysis. Nevertheless, we can conclude that our proteomic results of the EV-relevant fractions match the recommendations of ISEV in terms of protein content of EV isolates, suggesting the applicability of the UF-SEC method.
Six recordings of a single NTA analysis were performed. The particles were in a size range from 50 to 500 nm with a peak at 105 nm. The mean size was 171.7 ± 6.4 nm and the mode size 108.0 ± 3.6 nm, resulting in a cv of 3.7 and 3.3, respectively. The majority of the isolated vesicles were rather small EVs (sEVs). The larger particles (up to 500 nm) observed can be protein aggregates or the presence of larger EVs Another plausible explanation for the presence of the larger particles is the inability of NTA to resolve possible EVs aggregates, which are measured as a single EV with larger dimensions, as mentioned in the introduction. Clumped EVs were also visualised by TEM. Correct dilution of the EVs is a critical point in NTA analyses to minimise EV aggregates [Citation15]. We are also bound to the limits of NTA since this technique operates in the size range of 50 nm to 1 µm. Furthermore, the quality of NTA data strongly depends on the software settings applied (gain, minimum particle size expected, detection threshold, capture duration, etc.) and is therefore highly dependent on the human factor. This makes comparing NTA data over different papers challenging [Citation24].
AF4/UV-MALS was also used to determine the size and amount of the particles. The rms radius defined with AF4/UV-MALS was in the size range of 40 to 160 nm, similar to the TEM size distribution. This demonstrates that the isolated EVs using UF-SEC were sEVs. This doesn’t rule out that different subtypes of EVs were isolated. The UV detections also allows for the determination of contaminating proteins in the samples. The cv of the rms radius was 1.7 (n = 6); therefore, this method is highly reproducible, when compared to NTA (cv of mean was 3.7). This demonstrates that AF4/UV-MALS is a reliable quality control method for urinary EVs, providing information about abundance, size of the particles and purity. Furthermore, AF4/UV-MALS is a very user-friendly technique. However, this approach is time-consuming (1 h per analysis). AF4/UV-MALS is also very promising as purification technique of EVs, resulting in a 1 h isolation and characterisation step. However, currently the loading capacity is still a drawback when large starting volumes are necessary to yield sufficient material for downstream applications like proteomics. The dilution of the sample is too large, resulting in the loss of EVs. Optimisation of AF4/UV-MALS is needed for the use as an isolation method. We propose to include AF4/UV-MALS as a standard characterisation method for EVs in ISEV guidelines and tools like EV-TRACK [Citation31] to increase the quality of EV related research.
In conclusion, the results presented in this research paper demonstrate that UF-SEC is a suitable method for the enrichment of urinary EVs, especially sEVs. We also demonstrated that AF4/UV-MALS is a good quality-control method for isolated urinary EVs.
Materials and methods
Urine collection
The human biological material (urine) used in this publication was provided by Biobank@UZA (Antwerp, Belgium; ID: BE71030031000); Belgian Virtual Tumorbank funded by the National Cancer Plan, BBMRI-ERIC [Citation32]. Voided urine was obtained with written informed consent (approved by the Ethical Committee of the University of Antwerp and the University Hospital of Antwerp) using the urine vacuette system (Vacuette®, Greiner bio-one, Austria). Healthy individuals (n = 2, male, 28 to 52 years old) and proteinuria patients (n = 3, 2 males and 1 female, 24 to 71 years old) were included. The samples were stored immediately at −20°C. Based upon literature [Citation33], samples were thawed at room temperature and centrifuged at 180 × g for 10 min at 4°C and at 1,550 × g for 20 min at 4°C. Pellets were discarded to prepare CF urine. Samples were subsequently stored at −80°C until further use.
Extracellular vesicle isolation
Per isolation procedure, 40 to 70 mL of CF urine was thawed and ultrafiltrated using 100 kDa MWCO Centricon® Plus-70 Centrifugal Filter Units (Merck Millipore Ltd, Ireland) to get rid of the solute, smaller particles and proteins. The filtrate was placed on a qEV column (Izon Science Ltd, New Zealand). 500 µL-fractions were collected, started immediately after placing the sample on the column, with filtered PBS as the elution buffer. The qEV columns are used according to the manufacturer’s instructions.
Protein concentration
Total protein content was determined using the Micro BCA™ Protein Assay Reagent Kit (Thermo Scientific, Waltham, USA) following the manufacturer’s specifications. A standard curve of serially diluted Bovine Serum Albumin (Thermo Scientific) in filtered PBS was used. Values were extrapolated from this curve, using a linear equation, with r2 > 0.98 for each assay [Citation34].
Western blotting
Equal volumes or equal amounts of protein of the sample were heated at 95°C in SDS-containing 4× Laemmli Sample Buffer (Bio-Rad, USA), added with ß-mercaptoethanol according to the instructions. Samples were subject to electrophoresis on 4–20% Mini-PROTEAN® TGX Stain-Free™ Gels (Bio-Rad). Subsequently, the gel was washed in 20% ethanol, water and Pierce™ 1-Step Transfer Buffer for 5 min each. The proteins were transferred to nitrocellulose membranes (Bio-Rad) using the Trans-blot® Turbo™ Transfer system (Bio-Rad). After blocking in PBS containing 0.5% (w/v) Tween-20 and 5% (w/v) non-fat powdered milk (Nutrilon) for 90 min, the primary antibody was added, diluted in signal enhancer solution 1 (Merck, Germany) with gentle rolling overnight. The primary antibodies against Flotillin-1 (sc-133,153, Santa Cruz Biotechnology, USA) were used in a concentration of 200 µL/mL and dilution factor of 1:1,000. After washing three times with TBST for 5 min, Peroxidase-conjugated AffiniPure Donkey Anti-mouse IgG (H + L) (Jackson ImmunoResearch, USA) was added (1:20,000) in signal enhancer solution 2 (Merck, Germany) for 90 min. Bands were detected using chemiluminescent substrate (1:40,000) Amersham™ ECL™ Prime Western Blotting Detection Reagent (GE Healthcare, UK) and the ChemiDoc™ XRS+ with Image Lab™ Software (Bio-Rad).
Proteomic analysis
MTBE extraction
UF-SEC fractions in PBS were vacuum dried in 2 mL Eppendorf protein LoBind tubes to obtain a pellet of EVs. A MTBE lipid extraction method was applied on the samples, based on the procedure described by Matyash et al. and ‘t Kindt et al. [Citation35,Citation36]. This pellet was suspended in 300 µL methanol and vortexed for 10 s. 1 mL of tert-butyl methyl ether (MTBE; Sigma, Belgium) was added and samples were shaken for 1 h at room temperature. For the phase separation, 260 µL water was added. After 10 min of incubation at room temperature, samples were centrifuged for 10 min at 1,000 × g, resulting in a lower hydrophilic and upper lipophilic phase. The upper phase was removed and the lower hydrophilic and protein layer was vacuum dried.
In solution digest
The vacuum dried hydrophilic and protein layer was resuspended in 75 µL 5M urea. Samples were vortexed and sonicated for 10 min. This step was repeated. Proteins were reduced in a final concentration of 5 mM dithiothreitol at 60°C for 30 min. Proteins were alkylated in a final concentration of 20 mM iodoacetamide in the dark at room temperature for 30 min. Subsequently, 680 µL 100 mM ammonium bicarbonate was added. For the digestion step, 1 µg trypsin was added per 40 µg of protein and digestion was carried overnight at 37°C. Digests were desalted using Pierce C18 spin columns (Thermo Scientific) according to manufacturer’s instructions.
LC-MS/MS
The eluted peptides were vacuum dried and dissolved in mobile phase A, containing 2% acetonitrile and 0.1% formic acid to a final concentration of 1 µg/µL, and spiked with 20 fmol Glu-1-fibrinopeptide B (Glu-fib, Protea biosciences, Morgantown, WV). A total of 2 µg of protein was loaded on the column and the peptide mixture was separated by reversed phase chromatography on a nano acquity system (Waters, Milford, MA) using an nanoACQUITY UPLC Symmetry C18 Trap Column (100Å, 5 µm, 180 µm × 20 mm, 2G, V/M, 1/pkg) (Waters) connected to an ACQUITY UPLC PST C18 nanoACQUITY Column (10K psi, 130Å, 1.7 µm, 100 µm × 100 mm, 1/pkg) (Waters). A linear gradient of mobile phase B (0.1% formic acid in 98% acetonitrile) from 1 to 45% in 95 min followed by a steep increase to 90% mobile phase B in 10 min. A steep decrease to 1% mobile phase B is achieved in 5 min and 1% mobile phase B is maintained for 5 min. The flow rate is 400 nL per minute. Liquid chromatography was followed by tandem MS (LC-MS/MS) and was performed on a Q-Exactive plus mass spectrometer (Thermo Fisher). A nanospray ion source (Thermo Scientific) was used. Full scan spectrum (350 to 1850 m/z, resolution 70,000, automatic gain control 3E6, maximum injection time 100 ms) was followed by high-energy collision-induced dissociation (HCD) tandem mass spectra with a run time of 90 min. Peptide ions were selected for fragmentation by tandem MS as the 10 most intense peaks of a full-scan mass spectrum. HCD scans were acquired in the Orbitrap (resolution 17,500, automatic gain control 1E5, maximum injection time 80 ms).
Proteome discoverer
Proteome Discoverer (2.1) software (Thermo Scientific) was used to perform database searching against the database containing Uniprot Human (Proteome ID: UP000005640, downloaded on 25 May 2016), using both Sequest and Mascot algorithms (in-house server). Searches were performed with the following settings: precursor mass tolerance of 10 ppm, fragment mass tolerance of 0.02 Da. Digestion by trypsin and two missed cleavage sites are allowed. Carbamidomethyl modifications were defined as fixed modifications and phosphorylations (S,T,Y) and oxidations (of methionine) were dynamic modifications. The results were filtered with following parameters: only high confident peptides with a global FDR < 1% based on a target-decoy approach and first ranked peptides were included in the results. The mass spectrometry proteomics data have been deposited to the ProteomeXchange Consortium via the PRIDE partner repository with the dataset identifier PXD009709 [Citation37].
GO enrichment
FuncAssociate 3.0 (http://llama.mshri.on.ca/funcassociate/) was used for the GO enrichment [Citation38]. The whole proteome background was retrieved from FuncAssociate 3.0, the urine background was built using raw proteomic data files from [Citation39–Citation41] (run at the same Proteome Discoverer settings as above), resulting in 4686 proteins.
Transmission electron microscopy (TEM)
The quality of EVs was examined by TEM imaging. The sample preparation was adapted from Chen et al. [Citation42]. Briefly, three droplets of the sample were placed on a clean Parafilm, after which a carbon-coated TEM grid was placed on top of the droplets and allowed to stand for 60 min to adsorb the fluid. The grid with adherent EVs was washed three times with PBS for 2 min and five times with Ultrapure water for 2 min. The droplets were fixed with 2% glutaraldehyde for 10 min, and then washed five times with Ultrapure water for 2 min. The grid was transferred to 2% uranyl acetate and allowed to stand for 15 min. The grid was then incubated in 0.13% methyl cellulose (K5-8) and 0.4% uranyl acetate for 10 min and dried at room temperature before examination with Tecnai G2 Spirit BioTWIN (FEI, Eindhoven, The Netherlands). All solutions were filtered and UltraPure water was heated to release the CO2.
Nanoparticle tracking analysis (NTA)
NTA, using a NanoSight NS500 instrument (NanoSight Ltd. (Amesbury, UK)), determines the size and concentration of particles ranging from 50 nm to 1 µm in diameter. Samples were diluted 100- to 400-fold in PBS before measurement. The sample was illuminated by a laser beam; hence, any particle that scatters light would be detected, including protein aggregates. A dark-field microscope is used to determine the position of vesicles, which are continuously moving due to Brownian motion. For each vesicle, the movements are tracked and the mean squared velocity is calculated. As this depends on the particle diameter, an absolute size distribution of vesicles in suspension can be obtained [43]. The NanoSight NS500 (NanoSight Ltd.) equipped with an Electron Multiplying Charge Coupled Device camera (Andor Technology, Tokyo, Japan) and a 405-nm laser was used. Three or six video recordings of, respectively, 60 or 30 s were done with the following settings: camera level 14 to 15, screen gain 1.0 and detection threshold 5 to 10 using NTA v2.3.0.17 [Citation33].
Asymmetrical-flow field-flow fractionation (AF4) coupled with a UV and multi-angle light-scattering (MALS) detector
The AF4/UV-MALS protocol was adapted from Sitar et al. [Citation24]. AF4 separates macromolecules and particles according to their diffusion coefficient. It was performed at room temperature (20–25°C) on an Eclipse Dualtec (Wyatt Technology Europe, Dernbach, Germany) driven by an isocratic quaternary pump, an online vacuum degasser and an auto sampler (Agilent Technologies 1260 series, USA). All samples were separated in a Wyatt short channel with a trapezoidal shaped spacer with a thickness of 350 µm. The upper plate is impermeable, whereas the bottom plate is permeable, which is made of porous frit and covered by a semipermeable 10 kDa regenerated cellulose membrane (Millipore PLGC Membrane, pre-cut purchased via Wyatt). The high-resolution separation is achieved within the parabolic flow profile passing through the channel, which against a perpendicular cross-flow is applied. The analysed particles are driven by the cross-flow towards the channel bottom plate or accumulation wall. However, equilibrium is reached at a position away from the accumulation wall due to the counteracting Brownian motion of the particles. Small particles with high diffusion coefficient will have a higher Brownian motion and are thereby displaced by the faster flow stream of the parabolic flow profile [Citation24]. The fractionated samples were detected with a UV detector at 280 nm (Agilent Technologies, USA, 1260 series) and a MALS detector (DAWN Helios II, Wyatt Technology, USA) using a laser at 658 nm. The MALS detector was calibrated using anhydrous toluene (99.8% purity) (Sigma Aldrich, St. Louis USA) and normalised with an isotropic scatterer standard. In this case, bovine serum albumin protein (Thermo Scientific) was used at a concentration of 1 mg/mL according to recommendations from Wyatt Technology Europe. As a mobile phase, pumped by the Agilent Quaternary pump, PBS (Phosphate buffered Saline, pH 7.4) was used (Gibco®) together with 0.02% w/v sodium azide (NaN3, Sigma Aldrich, St. Louis USA) as a bactericide. This was filtered with a Durapore Membrane filter, pore size of 0.1 µm (Merck Millipore Ltd, Ireland) contained in a Solvac Filterholder. Additionally, a 0.1 µm VVLP filter (in a PEEK Inline Filter Holder) was installed between the HPLC pump and the AF4 channel. All samples were eluted at a detector flow of 0.5 mL/min, as follows: after an initial elution of 1 min with a cross flow of 3 mL/min and 1 min focus at 1.5 mL/min, 100 µL of the sample (500 µL SEC fraction) was injected to the auto sampler during a 5 min focus step at 0.2 mL/min injection flow, finished by an additional minute focusing the sample with the same 1.5 mL/min focus flow. Afterwards, separation takes place by keeping the cross flow at 3 mL/min for 5 min followed by a 45 min exponential gradient type 5 to a cross flow of 0.05 mL/min. The protocol is finished by cleaning the channel from all remaining components at elution and inject mode for 10 min without cross flow, 1 min elution mode and 1 min elution mode with 3 mL/min cross flow to keep the system ready during sample uptake to start a next run. Wyatt’s Astra software version 6.1.6.5. was used for data acquisition and subsequent data analysis. The size of observed particles was expressed by the rms radius calculated from data collected by 18 different angles from the MALS detector. The Zimm first-order model was used to convert shown data to the Rrms.
Ev-track
We have submitted all relevant data of our experiments to the EV-TRACK knowledgebase (EV-TRACK ID: EV170025) (Van Deun J, et al. EV-TRACK: transparent reporting and centralising knowledge in extracellular vesicle research. Nature methods. 2017;14(3):228–32). The EV-METRIC score is 62.5.
Conflicts of Interest
The authors declare no conflict of interest.
Supplemental Material
Download MS Excel (218.2 KB)Acknowledgments
We are grateful to the Flemish Institute for Technological Research (VITO, Belgium) for supporting the funding of this study.
Disclosure statement
No potential conflict of interest was reported by the authors.
Additional information
Funding
Related Research Data
References
- Lane RE, Korbie D, Hill MM, et al. Extracellular vesicles as circulating cancer biomarkers: opportunities and challenges. Clin Transl Med. 2018;7(1):1.
- Sun Y, Liu J. Potential of cancer cell-derived exosomes in clinical application: a review of recent research advances. Clin Ther. 2014;36(6):863–12.
- Zhou H, Yuen PS, Pisitkun T, et al. Collection, storage, preservation, and normalization of human urinary exosomes for biomarker discovery. Kidney Int. 2006;69(8):1471–1476.
- Choi DS, Lee J, Go G, et al. Circulating extracellular vesicles in cancer diagnosis and monitoring: an appraisal of clinical potential. Mol Diagn Ther. 2013;17(5):265–271.
- Hoorn EJ, Pisitkun T, Zietse R, et al. Prospects for urinary proteomics: exosomes as a source of urinary biomarkers. Nephrology (Carlton). 2005;10(3):283–290.
- Akers JC, Gonda D, Kim R, et al. Biogenesis of extracellular vesicles (EV): exosomes, microvesicles, retrovirus-like vesicles, and apoptotic bodies. J Neurooncol. 2013;113(1):1–11.
- Turchinovich A, Tonevitsky AG, Cho WC, et al. Check and mate to exosomal extracellular miRNA: new lesson from a new approach. Front Mol Biosci. 2015;2:11.
- Van Der Pol E, Hoekstra AG, Sturk A, et al. Optical and non-optical methods for detection and characterization of microparticles and exosomes. J Thromb Haemostasis. 2010;8(12):2596–2607.
- Van Deun J, Mestdagh P, Sormunen R, et al. The impact of disparate isolation methods for extracellular vesicles on downstream RNA profiling. J Extracell Vesicles. 2014;3. DOI:10.3402/jev.v3.24858.
- Witwer KW, Buzas EI, Bemis LT, et al. Standardization of sample collection, isolation and analysis methods in extracellular vesicle research. J Extracell Vesicles. 2013;2. DOI:10.3402/jev.v2i0.20360.
- Thery C, Amigorena S, Raposo G, et al. Isolation and characterization of exosomes from cell culture supernatants and biological fluids. Curr Protoc Biol. 2006;22. Chapter 3, Unit 3. DOI:10.1002/0471143030.cb0322s30
- Cvjetkovic A, Lotvall J, Lasser C. The influence of rotor type and centrifugation time on the yield and purity of extracellular vesicles. J Extracell Vesicles, 3. 2014. DOI:10.3402/jev.v3.23111
- Abramowicz A, Widlak P, Pietrowska M. Proteomic analysis of exosomal cargo: the challenge of high purity vesicle isolation. Mol Biosyst. 2016;12(5):1407–1419.
- Linares R, Tan S, Gounou C, et al. High-speed centrifugation induces aggregation of extracellular vesicles. J Extracell Vesicles. 2015;4:29509.
- Lozano-Ramos I, Bancu I, Oliveira-Tercero A, et al. Size-exclusion chromatography-based enrichment of extracellular vesicles from urine samples. J Extracell Vesicles. 2015;4:27369.
- Boing AN, Van Der Pol E, Grootemaat AE, et al. Single-step isolation of extracellular vesicles by size-exclusion chromatography. J Extracell Vesicles. 2014;3. DOI:10.3402/jev.v3.23430.
- De Menezes-Neto A, Saez MJ, Lozano-Ramos I, et al. Size-exclusion chromatography as a stand-alone methodology identifies novel markers in mass spectrometry analyses of plasma-derived vesicles from healthy individuals. J Extracell Vesicles. 2015;4:27378.
- Van Der Pol E, Coumans FA, Grootemaat AE, et al. Particle size distribution of exosomes and microvesicles determined by transmission electron microscopy, flow cytometry, nanoparticle tracking analysis, and resistive pulse sensing. J Thromb Haemostasis. 2014;12(7):1182–1192.
- Gardiner C, Ferreira YJ, Dragovic RA, et al. Extracellular vesicle sizing and enumeration by nanoparticle tracking analysis. J Extracell Vesicles. 2013;2. DOI:10.3402/jev.v2i0.19671.
- Conde-Vancells J, Rodriguez-Suarez E, Embade N, et al. Characterization and comprehensive proteome profiling of exosomes secreted by hepatocytes. J Proteome Res. 2008;7(12):5157–5166.
- Van Der Pol E, Boing AN, Gool EL, et al. Recent developments in the nomenclature, presence, isolation, detection and clinical impact of extracellular vesicles. J Thromb Haemostasis. 2016;14(1):48–56.
- Dragovic RA, Gardiner C, Brooks AS, et al. Sizing and phenotyping of cellular vesicles using nanoparticle tracking analysis. Nanomedicine: Nanotechnology, Biology, Medicine. 2011;7(6):780–788.
- Momen-Heravi F, Balaj L, Alian S, et al. Alternative methods for characterization of extracellular vesicles. Front Physiol. 2012;3:354.
- Sitar S, Kejzar A, Pahovnik D, et al. Size characterization and quantification of exosomes by asymmetrical-flow field-flow fractionation. Anal Chem. 2015;87(18):9225–9233.
- Wahlund KG, Giddings JC. Properties of an asymmetrical flow field-flow fractionation channel having one permeable wall. Anal Chem. 1987;59(9):1332–1339.
- Oh S, Kang D, Ahn SM, et al. Miniaturized asymmetrical flow field-flow fractionation: application to biological vesicles. J Sep Sci. 2007;30(7):1082–1087.
- Kang D, Oh S, Ahn SM, et al. Proteomic analysis of exosomes from human neural stem cells by flow field-flow fractionation and nanoflow liquid chromatography-tandem mass spectrometry. J Proteome Res. 2008;7(8):3475–3480.
- Petersen KE, Manangon E, Hood JL, et al. A review of exosome separation techniques and characterization of B16-F10 mouse melanoma exosomes with AF4-UV-MALS-DLS-TEM. Anal Bioanal Chem. 2014;406(30):7855–7866.
- Lotvall J, Hill AF, Hochberg F, et al. Minimal experimental requirements for definition of extracellular vesicles and their functions: a position statement from the international society for extracellular vesicles. J Extracell Vesicles. 2014;3:26913.
- Yuana Y, Levels J, Grootemaat A, et al. Co-isolation of extracellular vesicles and high-density lipoproteins using density gradient ultracentrifugation. J Extracell Vesicles. 2014;3. DOI:10.3402/jev.v3.23262.
- Van Deun J, Mestdagh P, Agostinis P, et al. EV-TRACK: transparent reporting and centralizing knowledge in extracellular vesicle research. Nat Methods. 2017;14(3):228–232.
- Goethals S, De Wilde A, Lesage K, et al. Tumorbank@uza: A collection of tissue, fluid samples and associated data of oncology patients for the use in translational research. Open Journal of Bioresources. 2018;5. DOI:10.5334/ojb.30.
- Yuana Y, Boing AN, Grootemaat AE, et al. Handling and storage of human body fluids for analysis of extracellular vesicles. J Extracell Vesicles. 2015;4:29260.
- Webber J, Clayton A. How pure are your vesicles? J Extracell Vesicles. 2013;2. DOI:10.3402/jev.v2i0.19861.
- t’Kindt R, Telenga ED, Jorge L, et al. Profiling over 1500 lipids in induced lung sputum and the implications in studying lung diseases. Anal Chem. 2015;87(9):4957–4964.
- Matyash V, Liebisch G, Kurzchalia TV, et al. Lipid extraction by methyl-tert-butyl ether for high-throughput lipidomics. J Lipid Res. 2008;49(5):1137–1146.
- Vizcaino JA, Csordas A, Del-Toro N, et al. 2016 update of the PRIDE database and its related tools. Nucleic Acids Res. 2016;44(22):11033.
- Berriz GF, Beaver JE, Cenik C, et al. Next generation software for functional trend analysis. Bioinformatics. 2009;25(22):3043–3044.
- Sandow JJ, Rainczuk A, Infusini G, et al. Discovery and Validation of Novel Protein Biomarkers in Ovarian Cancer Patient Urine. Proteomics: Clin Appl. 2018. DOI:10.1002/prca.201700135
- Kentsis A, Monigatti F, Dorff K, et al. Urine proteomics for profiling of human disease using high accuracy mass spectrometry. Proteomics: Clin Appl. 2009;3(9):1052–1061.
- Di Meo A, Batruch I, Yousef AG, et al. An integrated proteomic and peptidomic assessment of the normal human urinome. Clin Chem Lab Med. 2017;55(2):237–247.
- Chen CL, Lai YF, Tang P, et al. Comparative and targeted proteomic analyses of urinary microparticles from bladder cancer and hernia patients. J Proteome Res. 2012;11(12):5611–5629.
- Van Der Pol E, Coumans F, Varga Z, et al. Innovation in detection of microparticles and exosomes. J Thromb Haemostasis. 2013;11(Suppl 1):36–45.