
ABSTRACT
Large membrane derangements in the form of non-detaching blebs or membrane protrusions occur in a variety of cell stress and physiological situations and do not always reflect apoptotic processes. They have been studied in model mast cells under conditions of cell stress, but their potential physiological relevance to mast cell function and formation in primary mast cells or basophils have not been addressed. In the current study, we examine the large, non-detaching, non-apoptotic, membrane structures that form in model and primary mast cells under conditions of stimulation that are relevant to allergy, atopy and Type IV delayed hypersensitivity reactions. We characterized the inflation kinetics, dependency of formation upon external free calcium and striking geometric consistency of formation for large plasma membrane blebs (LPMBs). We describe that immunologically stimulated LPMBs in mast cells are constrained to form in locations where dissociation of the membrane-associated cytoskeleton occurs. Mast cell LPMBs decorate with wheat germ agglutinin, suggesting that they contain plasma membrane (PM) lectins. Electrophysiological capacitance measurements support a model where LPMBs are not being formed from internal membranes newly fused into the PM, but rather arise from stretching of the existing membrane, or inflation and smoothing of a micro-ruffled PM. This study provides new insights into the physiological manifestations of LPMB in response to immunologically relevant stimuli and in the absence of cell stress, death or apoptotic pathways.
Introduction
Large-diameter, low-curvature membrane derangements have been described in a variety of cell stress and cellular activation situations. For example, large-diameter, low-curvature membrane protrusions that can be induced by treatments such as pulsed laser exposure and chemicals such as dithiothreitol and paraformaldehyde [Citation1] have previously been termed giant plasma membrane vesicles (GPMVs) and been used as tools to assess fluid/fluid phase partitioning in membranes and the association of receptors with particular lipid micro-domains [Citation2–Citation4]. Physiologically, large membrane protrusions that resemble GPMV have been associated with cellular activation, mitosis, locomotion and apoptosis [Citation5–Citation7], and are more accurately termed as blebs due to their non-detaching and hence non-vesicular nature. Interestingly, a rat basophilic leukaemia cell line that is a common mast cell model has been used (primarily as a system of convenience) to generate these protrusions for lipid micro-domain studies. However, the potential physiological relevance of the protrusions to mast cell function and the ‘rules’ and mechanisms of formation remain open questions. In addition, the non-apoptotic presentation of such protrusions has been understudied and may represent a poorly understood process in activation of mast cells in response to physiological stimuli.
Mast cells are immune cells with very marked and functional membrane rearrangements upon activation. Since the first histological descriptions of mast cell activation in the 1880s, it has been recognized that visible, reversible, membrane derangements are linked to the activation process. Ehrlich’s original descriptions of ‘side chain theory’ included representations of membrane vesicularization on mast cells [Citation8]. Through the seminal EM studies of the Dvorak group in the 1970s and 1980s, to current live-cell fluorescence-based studies, it is clear that mast cells, in addition to the Rho/Rac-mediated membrane ruffling that is common to activating leukocytes, undergo distinctive dynamic membrane changes [Citation9–Citation17]. These are: (1) the formation and release of small (~10 nm diameter) exosomes [Citation18,Citation19], putative intercellular communication structures on which there is an extensive literature and (2) the release of ~50 nm secretory vesicles [Citation20,Citation21]. A third type of membrane rearrangement has been documented in two types of studies in model or primary mast cells – the formation of very large (>1 micron)-diameter membrane protrusions that do not detach. The other instance in which these large structures have been documented is in the enigmatic ‘degranulation channel’ [Citation22] into which the proteoglycan cores of secretory granules (SGs) have been proposed to discharge, followed by the fusion of secretory vesicles into large structures. The formation of apparent degranulation channels has been observed in EM sections of tissue resident and circulating mast cells and basophils [Citation11,Citation23], but their physiological realization, relevance and mechanisms of formation are poorly understood.
In the current study, we describe the formation of large-diameter, low-curvature blebs during physiological activation, absent apoptosis, in model and primary mast cells under conditions of stimulation that are relevant to allergy, atopy and Type IV delayed hypersensitivity reactions. We term them LPMB for large plasma membrane bleb. We characterized the inflation kinetics, dependency of formation upon external free calcium and the striking geometric consistency of LPMB formation. We tested predictions arising from a model where, as for pulsed laser-induced GPMV formation, immunologically stimulated LPMB in mast cells are constrained to form in locations where dissociation of the membrane-associated cytoskeleton occurs. Our data are consistent where formation sites lose cytoskeletal integrity, allowing cytosolic hydrostatic pressure to inflate LPMB. Having confirmed that the extensive LPMB decorates with wheat germ agglutinin (WGA), suggesting that it contains plasma membrane (PM) lectins, we asked questions about the origins of the extensive LPMB membrane area. Electrophysiological capacitance measurements support a model where LPMBs are not being formed from internal membranes newly fused into the PM (e.g. from a population of membrane-adjacent endosomes or SGs), as that would likely be reflected in an increase in capacitance associated with LPMB formation, which we do not see. Remaining possible origins for LPMB membrane are either stretch of the existing membrane or inflation of a micro-ruffled membrane. Interestingly, stretch- or swelling-associated chloride currents do not manifest during LPMB formation [Citation24], suggesting that cells are adapted to these membrane deformations as part of an activation process. Taken together, this study provides new insights into the physiological manifestations of LPMB in response to immunologically relevant stimuli and in the absence of cell death or apoptotic pathways.
Materials and methods
Cell culture
RBL2H3 [Citation25] were grown at 37°C, 5% CO2, in 95% humidity in Dulbecco’s modification of Eagle medium (Mediatech Inc., Herndon, VA, USA) with 10% heat-inactivated foetal bovine serum (Mediatech) and 2 mM glutamine. C57.1 bone marrow-derived murine mast cells were grown in Roswell Park Memorial Institute medium (RPMI), 10% FBS, 2 mM L-Gln, 2 mM Non Essential Amino Acids (NEAA), 1 mM sodium pyruvate, 50 µM 2-mercaptoethanol and 5 ng/ml IL-3 at 37°C, 5% CO2, in 95% humidity. Murine bone marrow-derived mast cells (BMMCs) were generated by culturing femoral bone marrow cells from C57 BL6 mice in RPMI supplemented with 10% FBS, 2 mM l-Gln, 2 mM NEAA, 1 mM sodium pyruvate, 50 µM 2-mercaptoethanol and 5 ng/ml IL-3 at 37°C, 5% CO2, 95% humidity for 5–6 weeks. Peripheral blood basophils were purified by MACS (Miltenyi Biotech, Bergisch Gladbach, Germany), using acocktail of biotin-conjugated monoclonal antibodies against CD3, CD4, CD7, CD14, CD15, CD16, CD36, CD45RA, HLA-DR and CD235a (Glycophorin A) and maintained briefly in RPMI as described above.
Reagents
General chemicals were from VWR (West Chester, PA, USA) and Sigma Aldrich (St. Louis, MO, USA). Phorbol myristate acetate (PMA) and ionomycin were from Calbiochem (Gibbstown, NJ, USA). IgE anti-di-nitro phenol (anti-DNP) is from Sigma and KLH-DNP was from Calbiochem. Bee venom was from HollisterStier (Spokane, WA, USA). To mitigate batch-to-batch variation in venom, three independent batches were selected on the basis of similar potency for induction of histamine release in control experiments, mixed, aliquoted and used for the duration of the studies presented here. Mastoparan and mellitin were from Sigma Aldrich. Arachidonic acid was from Enzo (Farmingdale, NY, USA). 2-Aminoethoxydiphenyl borate (2-APB) was from Calbiochem (LaJolla, CA, USA). Capsaicin and capsazepine were from Sigma Aldrich.
Cell stimulation
FcεRI stimulation used 0.1 µg/ml IgE anti-DNP (16 h/37°C) (SPE-7, Sigma) followed by three washes and the addition of 250 ng/ml KLH-DNP (Sigma) for the indicated times. Cells were treated with 1 µg/ml bee venom in Hank's Buffered Salt Solution (HBSS) or 1–30 µg/ml mastoparan to induce LPMB formation just prior to imaging. All experiments were carried out in buffers adjusted to 330 mOsm. External Ringer solution (in mM) was 140 NaCl, 2.8 KCl, 1 CaCl2, 2 MgCl2 and 10 NaHEPES. Internal solution in the pipette contained the following (in mM): 120 Cs-glutamate, 8 NaCl, 1 MgCl2, 8.5 CaCl2, 10 Cs-BAPTA and 10 CsHEPES. For calcium-free external solution, no CaCl2 was added and 2mM ethylene glycol-bis(β-aminoethyl ether)-N,N,N′,N′-tetraacetic acid (EGTA) was present to chelate any contaminating calcium from the water used to prepare the buffer.
Staining and imaging
Live-cell staining was carried out in 1 mM added CaCl2 Ringer solution containing 2 mM probenecid (Molecular Probes, Eugene, OR, USA). Cells were plated in (50,000 per cm2) MatTek (Ashland, MA, USA) coverslip dishes for 16 h prior to media replacement and stained for 1 h (live-cell staining, using dyes and concentrations indicated in Legends with two washes prior to transfer to the microscope stage). For fixed cell staining, cells (50,000 per cm2) were fixed on coverslips (0.4% (w/v) paraformaldehyde 1 h, RT or 100% methanol for 2 min at RT). Staining with Alexa-phalloidin dye (100 nM, 30 min) used three washes and was followed by mounting. Coverslips were mounted in Crystal-Mount (Electron Microscopy Sciences, Hatfield, PA, USA).
Bright-field and fluorescence imaging of cells in MatTek dishes were performed on a Nikon Ti Eclipse C1 epifluorescence and confocal microscopy system, equipped with heated stage. Available laser lines in FITC, TxRed, and Cy5 were supplied by a 488 nm 10 mW solid-state laser, a 561 nm 10 mW diode pump solid-state laser and a 638 nm 10 mW-modulated diode laser. z stack sizes ranged from 3 to 8 microns depending on the cell being imaged. Each z disc (optical section) ranged from 0.15 to 1 micron. Pinhole size for all images was 60 microns. Images were analysed in NIS Elements (Nikon, Melville, NY, USA). Unless otherwise, stated images were acquired through a Plan Apo VC 100 × 1.40 oil objective (Nikon). Excitation and emission maxima of dyes used are as follows: ORO, Ex 561 nm/Ex 590/50 nm; Fluo-4, Ex 488 nm/Ex 515/30 nm; WGA, Ex 488 nm/Ex 515/30 nm; Alexa-538 Annexin V, Ex 538 nm/Ex 590/50 nm.
Electrophysiology measurements
Patch-clamp experiments were performed in the tight-seal whole-cell configuration at 21–25°C. Current and membrane capacitance recordings were captured with EPC-10 amplifier (HEKA, Lambrecht, Germany). RBL-2H3 cells were grown on glass coverslips and bathed in the external Ringer solution. External Ringer solution (in mM): 140 NaCl, 2.8 KCl, 1 CaCl2, 2 MgCl2 and 10 NaHEPES. Internal solution in the pipette contained the following (in mM): 120 Cs-glutamate, 8 NaCl, 1 MgCl2, 8.5 CaCl2, 10 Cs-BAPTA and 10 CsHEPES, which resulted in 1.2 µM buffered internal calcium. The internal solution-filled patch pipettes had a resistance between 2 and 4 MΩ. Following break-in, voltage ramps of 50 ms duration from −100 mV – +100 mV were delivered to the cells with a holding potential of 0 mV at a rate of 0.5 Hz over the period of the recording. All voltages were corrected for a liquid junction potential of 10 mV. Currents were filtered at 2.9 kHz and digitized at 100 µs intervals. Capacitance measurements specifically employed the OnCell_Cm protocol in PATCHMASTER on the HEKA EPC-10 amplifier.
Results
LPMB form on mast cells and basophils under diverse conditions of proinflammatory stimulation
We noted LPMB formation during the activation of primary murine mast cells and basophils in response to antigen-mediated stimulation of FcεRI. This high-affinity receptor for IgE is activated by antigenic crosslinking of bound IgE, resulting in calcium fluxes and protein kinase cascades that drive an array of functional proinflammatory responses. in shows a frequency and size analysis of LPMB formation in C57.1 BMMC and human basophils isolated from peripheral blood and RBL2H3 model mast cells [Citation25]. Cells were stimulated with IgE alone (no crosslinking) and with IgE anti-DNP followed by antigenic crosslinking with keyhole limpet hemocyanin (KLH)-DNP to induce FcεRI signal transduction. All three cell types exhibit LPMB formation within 2–10 min under these conditions. Subsequent experiments were performed in RBL2H3, a rat basophilic leukaemia line with characteristics of mucosal mast cells, due to the convenience of their adherent phenotype for these studies. shows antigen-induced LPMB in two representative RBL2H3, in a z-depth coded rendering of a confocal z stack with fluorescent WGA as the staining agent. WGA positivity suggests that these structures comprise authentic PM with lectin-binding proteins in it. shows that these structures retain Lucifer Yellow staining (a cytoplasm tracker) after formation, suggesting that they have intact membranes and continuity with the cytosol. shows that the LPMBs formed in response to antigen tend to contain substructures, while those formed in response to ionomycin (a calcium ionophore used to generate exclusively calcium fluxes) alone tend to be lacking these substructures. In , we present an example cell where these substructures populate the LPMBs over time, suggesting that the cytosol has access to the LPMB lumen. Moreover, these substructures appear vesicular in nature and stain with WGA, suggesting membrane delineation (). shows that pharmacological stimulus (ionomycin), an immunological stimulus (antigen/FcεRI) and SERCA pump inhibitor (Thapsigargin) induce LPMB formation in a model mast cell system, suggesting that this response is generalized across mast cell activation types. The presence of external calcium is necessary for the formation of LPMB, since in external milieu formulated to be nominally calcium free using zero-added CaCl2 and an excess of the calcium-chelating buffer EGTA, they do not form in response to stimulation (e).
Figure 1. (a) Appearance of LPMB in antigenically stimulated RBL2H3. Confocal images of RBL2H3 stimulated with IgE/DNP-BSA for 15 min at 37°C. A series of 64 z discs were assembled and projected in NIS elements and z-depth coded using a 20.2 micron pseudo-coloured look-up table prior to deconvolution. Scale bar 10 microns. (b) Lucifer Yellow staining of LPMB indicating contiguousness with cytosol. Epifluorescence images of RBL2H3 stimulated with IgE/DNP-BSA for 15 min at 37°C after 20 min pre-incubation with 10 nM Lucifer Yellow. Scale bar 10 microns. (c) LPMB content presents differently in degranulating and non-degranulating RBL2H3. Left panels. Two LPMB from non-degranulating cells stimulated with ionomycin (500 nM for 15 min at 37°C), which causes intracellular calcium flux but is insufficient to initiate degranulation. Arrow indicates large LPMB with no visible content under phase-contrast imaging. Right panels. Two LPMB from degranulating RBL2H3 stimulated via FcεRI (IgE anti-DNP and KLH-DNP). Arrow indicates vesicular content apparent within the LPMB boundaries. Scale bars 2 microns. (d) WGA-positive vesicular structures appear in LPMB in degranulating cells. RBL2H3 were incubated with Alexa 488-WGA for 6 h to provide staining of intracellular membranes. Phase-contrast images (left) and confocal z discs (right) were captured at the indicated time points after stimulation via FcεRI. Arrows indicate vesicular content apparent within the LPMB boundaries. Scale bar 2 microns. (e) Dependency of LPMB formation upon external calcium. RBL2H3 were stimulated for 8 min at 37°C in modified Ringer’s solution containing either 1 mM external CaCl2 or formulated as nominally calcium free (0 mM external CaCl2 plus1mM EGTA). Stimuli were IgE anti-DNP and KLH-DNP, ionomycin (500 nM) or thapsigargin (250 nM). Alexa 488-WGA was included in the media throughout the experiment and cells were live-cell imaged after one brief wash to remove excess dye. LPMB per 100 cells (triplicate fields of approximately 33 cells) were counted and expressed as a histogram.
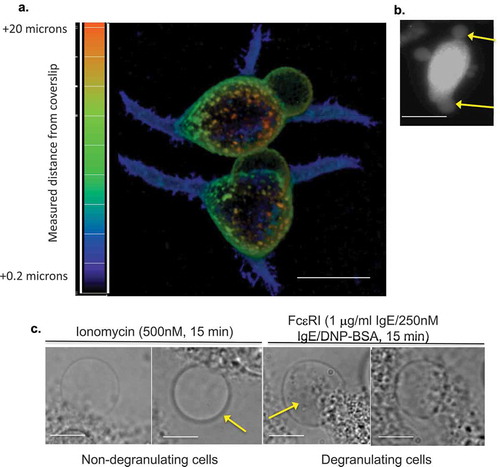
Figure 1. (Continued).
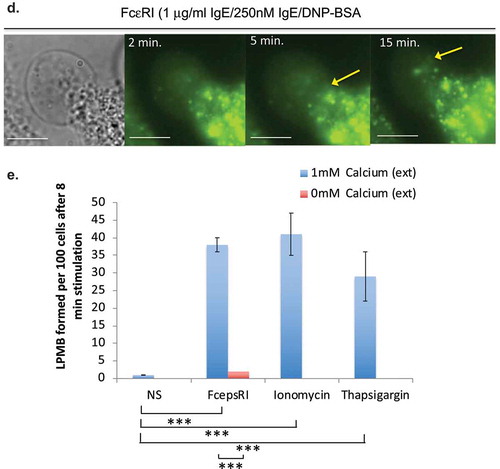
Table I. Frequency and magnitude of LPMB formation in primary mast cells, primary basophils and a model basophilic cell line. Bone marrow-derived murine mast cells, peripheral blood-derived human basophils and the rat basophilic leukemia cell line RBL2H3 were exposed to either IgE anti-DNP or IgE anti-DNP followed by DNP-BSA to antigenically-crosslink FcεRI receptors. Triplicate fields of 100 cells live-cell stained with Alexa 568-wheatgerm agglutinin were assessed for the formation of LPMB (a protrusion stably forming on the plasma membrane of diameter that is 7.5% or more of the cell diameter at longest axis by 5 min after stimulation). Numbers of cells exhibiting LPMB were scored, and the mean size of LPMB as a percentage of the cell diameter on the longest axis was calculated.
Table II. Summary of measured rates and lag times (time to onset) of LPMB formation in response to FcεRI stimulation of RBL2H3 across 408 measured LPMB (100 cells per day, 3 replicate days).
We asked if the LPMB-positive cells displayed any signs of cell death. We induced apoptosis and monitored cell morphology, and note both distinct structures from LPMB and a distinct time course, with LPMB formation being maximal by 8 min in all cell types and stimuli tested, while apoptotic blebbing in response to potent stimuli starting at around 18 min and persisting over approximately 1 h. Supplemental shows these data. We perfused LPMB-positive cells with trypan blue (TB) by both replacement of bath media and by use of an applicator pipette. LPMB-positive cells were not TB+ even at 48 min, the longest timepoint for which we could image due to loss of cell adhesion. In contrast, apoptotic cells become TB+ within 20 min (Supplemental Table 1). We also tested for the presence of chloride currents that are associated with cell death. This required that we develop the ability to patch-clamp LPMB and LPMB-containing cells. We did not observe sodium-permeant ‘death currents’ in cells that are forming LPMB (data not shown). Therefore, we conclude that while cells with LPMB may die, the LPMB themselves are not markers of apoptosis and are distinct from apoptotic blebbing.
Characterization of LPMB formation dynamics
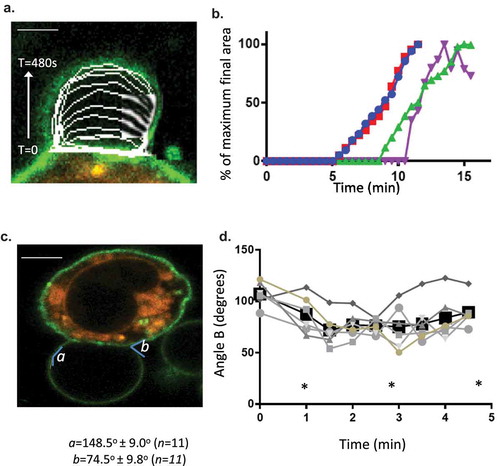
The formation of LPMB appeared to be non-random based on our initial observations. We sought to characterize them and to parameterize their formation. The rates of formation of the LPMB (the rate at which they inflate) are remarkably similar between cells ( and ). shows an example LPMB formation over time. To quantify, we established a measurement system where we acquired confocal time series for z stacks for forming LPMB and standardized measurement for the z discs that represented the vertical midpoint of each LPMB. shows example formation dynamics for four LPMBs following stimulation of RBL2H3 via FcεRI, and summarizes the ranges of formation rate and time to onset (lag time after stimulus added) found on examination of 112 LPMB z discs. We also looked at the angles of formation and curvature of the LPMB. We noted consistency again in both the final attained angle of curvature of the LPMB (here designated as angle a) and the acute angle of formation (angle b) at the point where the LPMB starts to evolve from the membrane of the cell body ().
Figure 2. Formation dynamics of LPMB. (a) Formation kinetics of a LPMB in a representative cell. Cells were stimulated via FcεRI and live-cell stained with Alexa 488-WGA. Live-cell confocal time series of an evolving LPMB were captured for a single z disc. Each white line represents the size of the LPMB at 15 s intervals. Scale bar 2 microns. (b) Example formation kinetics of LPMB from four cells. Four LPMB were measured over a 15 min period in FcεRI-stimulated and live-cell Alexa 488-WGA-stained RBL2H3. Live-cell confocal time series of an evolving LPMB was captured for a single z disc. LPMB size over time was normalized as a percentage of their final attained area. Each colour represents a different LPMB, and diversity in lag time, and similar formation kinetics and occasional deflation of the LPMB are observed. . Statistical analysis of LPMB formation. (c) Formation angles of LPMB. Example LPMB from RBL2H3 stimulated for 8 min via FcεRI and live-cell stained with Alexa 488-WGA. Two angles were selected for measurement (a and b). (d) Acute formation angle b measurements over time. Measurements were taken at indicated intervals, with 0 min being the earliest visible onset of GMPV formation. Each line represents a LPMB from a different cell. Data points at the times indicated by asterisks (*) were tested for significant difference by a Student’s t test and no significant variation was found (p > 0.05).
Constraints on LPMB formation sites
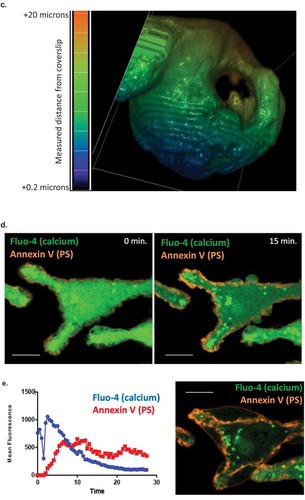
We investigated the formation sites for LPMB, with the question of how they are differentiated from the rest of the membrane and whether they could give us insight into the driving processes for LPMB formation and inflation. Initially, we developed a model to test for how these structures could form and be localized to specific areas of membrane and why calcium influx is a necessary and sufficient initiating signal for their formation. This model is shown in . The model proposes that LPMB formation sites are constrained by the cytoskeleton and membrane potential. Hydrostatic pressure of the cytosol (pa) is held in check by membrane tension and the stiffness of the cortical actin cytoskeleton. In turn, electrostatic interactions are present between the net positive actin cytoskeleton and the net negative inner leaflet of the PM where high phosphatidylserine content is associated with negative charge accumulation. When PS flips to the exofacial leaflet, the intracellular face may become more net positively charged, which might play a role in weakening the electrostatic interaction between inner leaflet and cytoskeletal proteins. Calcium flux is clearly an initiating necessary and sufficient signal for LPMB formation since extracellular conditions that lack calcium are not supportive of LPMB formation (). Calcium flux also causes PS relocation to the exofacial leaflet of the PM in a similar time course [Citation26]. The model predicts that actin cytoskeleton dissociation from the PM accompanies PS relocation to the exofacial leaflet of the PM, and that LPMBs inflate due to a positive hydrostatic pressure on the PM in those locations. show actin cytoskeleton dissociation in a LPMB formation zone and shows that some but not all sites of positive PS exofacial relocation are also sites for LPMB formation. Across 35 cells analysed, we noted that 100% of membrane regions that later developed a LPMB showed PS exofacial relocation. However, the vast majority of WGA-Annexin V-staining positive membrane areas do not evolve LPMB, so more features must define the LPMB initiation sites than simply PS exposure and actin cytoskeleton dissociation.
Figure 3. (a) LPMB formation model. This model suggests a relationship between calcium-induced exofacial relocation of PM PS, localized dissociation of the actin cytoskeleton and hydrostatic pressure (Pa)-induced inflation of LPMB in areas of membrane where Pa is not opposed by the stiffness of the cortical actin. (b) Cortical actin disruption at LPMB formation site. RBL2H3 were live-cell stained with Alex488-WGA and lysotracker (included to visualize intracellular vesicular structures including secretory granules) (i-iii) or Alexa-488 Phallioidin (iv, v, vi, vii) and stimulated with IgE/DNP-BSA for 15 min at 37°C. I, ii, iii, vi, vii. Localized Alexa-488 WGA staining and intensity profiles in areas of LPMB formation at 0 (i) and 15 (ii, iii) min after stimulation. (iv, v). Alexa-488 phalloidin (iv) and bright-field (v) imaging of a LPMB 15 min after stimulation, showing disruption of cortical actin cytoskeleton in septal area. Scale bar 10 microns. (vi). Single z disc from example Alexa-488 Phallioidin-stained cell showing perforated actin cytoskeleton at LPMB formation site. (vii) Assembled z stack (24 z discs) of cell stained in (vi). Scale bars 5 microns. (c) z-depth coded 3D reconstructed projection of cortical actin staining in LPMB-positive area of activated mast cell as shown in (iv) and (v). A series of 64 z discs were assembled and projected in NIS elements and z depth coded using a 20.2 micron pseudo-coloured look-up table prior to deconvolution. (d) Exofacial relocation of plasma membrane phosphatidylserine (PS). Example confocal images of RBL2H3 stimulated with PMA and ionomycin (500 nM each) for 15 min at 37°C. Cells were pre-incubated with 4 µM Fluo-4 and the imaging bath contained 1 µM alexa-568 Annexin V. Individual z planes at 0 (left panel) and 15 min (right panel) are shown. (e) Relationship between calcium flux and exofacial PS relocation in activated RBL2H3. Cells were pre-incubated with 4 µM Fluo-4 and the imaging bath contained 1 µM Alexa-568 Annexin V. Representative ROI of whole cytosol or PM were analysed for Fluo-4 and Alexa-538 Annexin V-staining intensity over time in response to PMA/ionomycin stimulation. Left panel. Florescence intensity of Fluo-4 (measured in a whole-cytosol ROI) and Alexa 568-Annexin V (measured in a membrane located ROI) over time. Right panel. Confocal image of RBL2H3 stimulated with PMA and ionomycin (500 nM each) for 15 min at 37°C. Individual z plane at 5 min is shown.
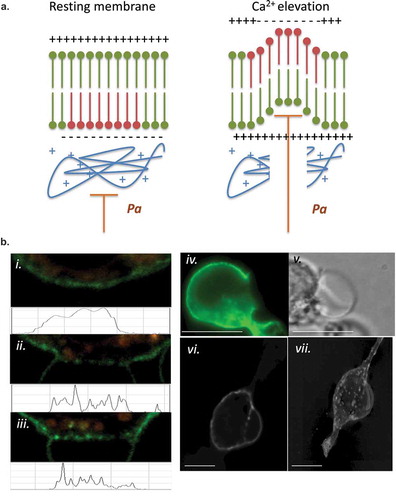
Figure 3. (Continued).
Origins of LPMB membrane
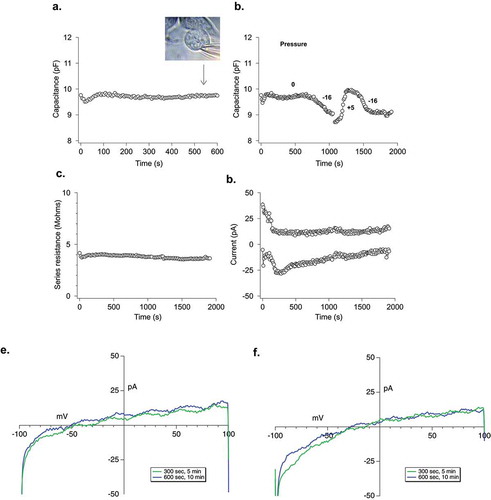
We asked several questions regarding the membrane that comprises the LPMB itself. First, all observed LPMBs are WGA positive, indicating the presence of surface lectins (). Second, LPMBs late in their formation tend to be Annexin V positive, indicating the presence of increased levels of exofacial phosphatidylserine (). Third, we asked if the LPMB formation was associated with an overall increase in membrane capacitance (which would indicate increased cell surface area and the fusion of internal membranes with the PM during the LPMB formation process) or with stable membrane capacitance (indicating the presence of no ‘new’ membrane in the PM post LPMB formation). (a) shows uninterrupted whole-cell patch-clamp capacitance measurement from a cell evolving a large LPMB, where capacitance does not fluctuate during the LPMB formation. A control experiment where a cell was ‘deflated’ and ‘inflated’ to approximately ±10% cell volume using positive and negative pipette pressure is shown in , indicating that the system used here does have the sensitivity to detect changes in membrane surface area of similar orders to those observed in LPMB formation. shows that series resistance of the cell is not changing across the LPMB formation time course in , indicating no fluctuation in seal during this experiment. It should be noted that since patch-clamp configurations tend to be unstable at 37°C, these experiments were performed at room temperature (21–25°C), and so we cannot completely eliminate the possibility that different data would be obtained at 37°C. shows a relatively stable whole-cell current recording, suggesting the LPMB formation is not interfering with basal ion channel functioning in the cell. These data suggest that the LPMB is not being formed from internal membranes newly fused into the PM (e.g. from a population of membrane-adjacent endosomes or SGs), as that would likely be reflected in an increase in capacitance. Remaining possible origins for LPMB membrane are either stretch of the existing membrane, or inflation of a micro-ruffled membrane. Stretch- or swelling-associated chloride currents do not manifest during LPMB formation [Citation24] (), indicating that the most likely origin of the inflated LPMB membrane is the inflation and smoothing of a complex ruffled membrane.
Figure 4. Electrophysiological analysis of LPMB. (a) Cellular capacitance during LPMB formation. Capacitance recording under whole-cell patch clamp of RBL2H3 cell where stimulation was mimicked by 1.2 µM buffered calcium in the internal solution. LPMB formation started after ~80 s. Bright-field image of the LPMB showing the position of patch pipette at 540 s timepoint is shown in inset. LPMB is displayed at 540 s. The capacitance recording was taken every 2 s for the duration of the recording. (b) Effect of mimicking altered hydrostatic pressure on membrane capacitance. An extended recording of capacitance in the RBL2H3 cell that showed LPMB formation. Positive and negative pressure was applied to the pipette to shrink and expand the cell with internal pressure, showing that while LPMB formation did not cause a change in capacitance, this change could be elicited form the same cell artificially. The capacitance recording was taken every 2 s for the duration of the recording. (c) Series resistance during LPMB formation. Series resistance recording spanning 2000 s, taken every 2 s of an RBL2H3 cell that showed LPMB formation. The series resistance recording was performed on the same RBL2H3 cell that was used in . (d) Absence of inward and outward currents throughout the LPMB formation period. Current recording in pA spanning 2000 s of an RBL-2H3 cell that showed LPMB formation. The current was generated with a ramp pulse from −100 mV to +100 mV with the current extract at −80 mV and + 80 mV. The ramp was pulsed every 2 s for the 2000 s duration. (e) Representative current voltage relationship displayed at 300 s and 600 s into recording during LPMB formation. Each of the graphs represents a single cell with two traces (green and blue which represents 300 s and 600 s, respectively) extracted and displayed to show the current voltage relationship of the cell during LPMB formation.
Discussion
LPMBs are enigmatic structures, and the present study provides new data on their manifestation in mast cells. The data show that physiological stimuli which are mast cell activators cause LPMB formation, including antigenic stimulation of the FcεRI, bee venom and venom-derived components, and activate LPMB formation in a primary murine mast cell line, in primary human basophils and in a rat basophilic cell line with mast cell features. These data raise the possibility that LPMBs form under select conditions as a physiological response to activating stimuli and are not solely indicators of extreme cell stress or initiation of death pathways. We observe these structures in live cells that are not apoptotic or dying, at least as indicated by a combination of viability, morphological and electrophysiological criteria. Possible functions that such large membrane structures could fulfil will now need to be addressed. Three possible avenues for future analysis are as follows. First, revisiting of the concept of the degranulation channel, second, potentially looking for a role in volume regulation as part of a cell’s adaptation to an inflammatory site and third considering the potential increase in contact area that a GMPV would offer within a three-dimensional tissue context. To look at the first of these [Citation27], degranulation channels are large, somewhat poorly structurally defined, features of activating mast cells and basophils. They have primarily been observed in elegant EM studies dating to the 1980s and 1990s from the Dvorak laboratory. Some EM images from these studies [Citation11] are strikingly similar to our observations, but in general non-EM imaging techniques have not been used to examine DG in more recent literature. Degranulation channels may or may not be delimited by a distended PM, but appear to be a space into which the contents of SGs (especially the proteoglycan cores of SG) are released. We have some images that are consistent with this feature of LPMB since we observe LPMB that contain vesicular cargo, but we have not attempted to verify that this cargo is SG cores.
Second, LPMB may represent a volume correction mechanism for mast cells. Swelling and hypo-osmolarity are features of the inflammatory sites that form in response to injury or envenomation. This adaptation uses increased vascular permeability, which produces an inflammatory site that is osmotically hostile to infecting organisms. Mast cell swelling in response to secretagogues has been noted histologically [Citation28], and reversible swelling as a form of volume regulation has been noted in diverse cell types including lymphocytes. Hypotonicity results in calcium-permeant cation channel activation and cell swelling [Citation29]. We have some evidence that LPMB formation is partially and occasionally reversible in these cells, but we have yet to explore the effects of altered external osmolarities or the activation of channels such as anoctamins and aquaporins [Citation30] through patch-clamping the LPMB themselves.
Third, we recognize that the experiments in this study were only performed in two-dimensional cell cultures. The implications of LPMB formation in the three-dimensional context of tissue-resident mast cells may be interesting to consider. These large structures are not stiff in comparison to the PM (they have no cortical actin) and within tissue they could conceivably intercolate through interstitial spaces and greatly increase the contact area between mast cell and the surrounding cell types. Tissue-resident mast cells make important functional and bidirectional regulatory contact with sensory neurons, vascular epithelia and many cell types within skin and mucosa. It may be of interest to therefore examine whether LPMB membranes contain cell adhesion molecules, or other receptors that mediate cell–cell interactions, as well as to determine what LPMBs look like in three-dimensional co-culture systems. We note that LPMBs have intact membranes that are stained positively by WGA, indicating at least the presence of lectins on the membrane surface.
We identified some ‘rules of formation’ for LPMBs. Their formation seems highly dependent on the presence of external calcium, suggesting that the signalling events that initiate their formation may be downstream of the FcεRI/IP3/CRAC pathway for store-operated calcium entry that is central to many aspects of mast cell activation. However, other calcium entry pathways, especially those of the TRP related to external physical stimuli such as osmolarity (e.g. TRPV2, TRPA1 [Citation29]), may also play a role as they have been shown to be expressed in mast cells and basophils [Citation31–Citation33]. The initiating events remain unclear, although we are intrigued by some preliminary observations showing that areas of phosphatidylserine relocation to the exofacial side of the PM [Citation26] seem to be related to LPMB formation. It is not clear if this is a cause or effect, but it does seem likely that actin cytoskeleton dissociation would be a permissive step that precedes the hydrostatically driven LPMB formation.
The origin of the membrane that comprises the LPMB is also of interest for future studies. Our data suggest that the membrane is not ‘new’, i.e. it does not represent internal membranes that fuse with the PM. Our reasoning here is that such fusion would be detected as an increase in membrane capacitance using electrophysiological techniques. Rather, we favour a model where the LPMB formation represents a smoothing of the highly wrinkled and crenellated resting mast cell membrane. In support of this, we note that Solsona et al. observed that when mast cells were inflated by ~4× during patch clamping by applied hydrostatic pressure, there was no change in membrane conductance and minimal change in capacitance [Citation34].
In summary, this study provides new insights into the physiological manifestations of LPMB in response to immunologically relevant stimuli and in the absence of cell death or apoptotic pathways. These structures manifest in living primary mast cells and peripheral blood basophils as well as in transformed cell lines. Our model of GMPV inflation through hydrostatic pressure in areas of membrane where the cortical actin has dissociated will need to be further developed as there remain unanswered questions. It will be especially important to identify what the calcium-signalling target is that is upstream of the permissive steps for LPMB formation, and to understand why, if PS flipping (which affects the whole PM) is involved, only a few specific membrane areas in cells evolve LPMB. What is ‘special’ about these areas is an intriguing question. Further experiments will be required to more fully elucidate LPMB function and mechanism of formation, especially in 3D tissue culture and in the technically challenging primary mast cells and basophils.
Supplemental Material
Download Zip (149.7 KB)Acknowledgments
This work is dedicated with fond memories to Carl Sung. Work in this article was funded by NIH INBRE P20GM103466, NIH R15DK100978 and NIH P20MD0006084. AJS is supported by NIH P20GM113134. We thank Lynn Haff for proofreading.
Disclosure statement
No potential conflict of interest was reported by the authors.
Supplemental material
Supplementary data can be accessed here.
Additional information
Funding
Related Research Data
References
- Kelly CV, Kober MM, Kinnunen P, et al. Pulsed-laser creation and characterization of giant plasma membrane vesicles from cells. J Biol Phys. 2009;35(3):279–13.
- Baumgart T, Hammond AT, Sengupta P, et al. Large-scale fluid/fluid phase separation of proteins and lipids in giant plasma membrane vesicles. Proc Natl Acad Sci U S A. 2007;104(9):3165–3170.
- Sezgin E, Kaiser HJ, Baumgart T, et al. Elucidating membrane structure and protein behavior using giant plasma membrane vesicles. Nat Protoc. 2012;7(6):1042–1051.
- Veatch SL, Cicuta P, Sengupta P, et al. Critical fluctuations in plasma membrane vesicles. ACS Chem Biol. 2008;3(5):287–293.
- Rafelski SM, Theriot JA. Crawling toward a unified model of cell mobility: spatial and temporal regulation of actin dynamics. Annu Rev Biochem. 2004;73:209–239.
- Charras G, Paluch E. Blebs lead the way: how to migrate without lamellipodia. Nat Rev Mol Cell Biol. 2008;9(9):730–736.
- Jungbluth A, von Arnim V, Biegelmann E, et al. Strong increase in the tyrosine phosphorylation of actin upon inhibition of oxidative phosphorylation: correlation with reversible rearrangements in the actin skeleton of Dictyostelium cells. J Cell Sci. 1994;107(Pt 1):117–125.
- Zielinska E Side-chain theory, circa 1900. Foundations July 2013 [ cited 2018]. Available from: https://www.the-scientist.com/?articles.view/articleNo/36175/title/Side-Chain-Theory–circa-1900/
- Dvorak AM. Degranulation and recovery from degranulation of basophils and mast cells. Chem Immunol Allergy. 2005;85:205–251.
- Dvorak AM. Ultrastructural enzyme-affinity-gold and inhibitor-gold techniques identify subcellular sites of histamine and heparin in basophils and mast cells. Chem Immunol Allergy. 2005;85:98–134.
- Dvorak AM. Ultrastructural studies of human basophils and mast cells. J Histochem Cytochem. 2005;53(9):1043–1070.
- Dvorak AM. Ultrastructure of human mast cells. Int Arch Allergy Immunol. 2002;127(2):100–105.
- Dvorak AM. New aspects of mast cell biology. Int Arch Allergy Immunol. 1997;114(1):1–9.
- Dvorak AM, Morgan ES, Schleimer RP, et al. Diamine oxidase-gold ultrastructural localization of histamine in isolated human lung mast cells stimulated to undergo anaphylactic degranulation and recovery in vitro. J Leukoc Biol. 1996;59(6):824–834.
- Dvorak AM, Ishizaka T. Ultrastructural analysis of the development of human basophils and mast cells in vitro. Int J Clin Lab Res. 1995;25(1):7–24.
- Dvorak AM, McLeod RS, Onderdonk A, et al. Ultrastructural evidence for piecemeal and anaphylactic degranulation of human gut mucosal mast cells in vivo. Int Arch Allergy Immunol. 1992;99(1):74–83.
- Dvorak AM, Schleimer RP, Lichtenstein LM. Morphologic mast cell cycles. Cell Immunol. 1987;105(1):199–204.
- Xie G, Yang H, Peng X, et al. Mast cell exosomes can suppress allergic reactions by binding to IgE. J Allergy Clin Immunol. 2018;141(2):788–791.
- Vukman KV, Forsonits A, Oszvald A, et al. Mast cell secretome: soluble and vesicular components. Semin Cell Dev Biol. 2017;67:65–73.
- Wernersson S, Pejler G. Mast cell secretory granules: armed for battle. Nat Rev Immunol. 2014;14(7):478–494.
- Azouz NP, Fukuda M, Rothenberg ME, et al. Investigating mast cell secretory granules; from biosynthesis to exocytosis. J Vis Exp. 2015;(95):52505.
- Friedman MM, Kaliner M. Ultrastructural changes in human skin mast cells during antigen-induced degranulation in vivo. J Allergy Clin Immunol. 1988;82(6):998–1005.
- Breckenridge LJ, Almers W. Final steps in exocytosis observed in a cell with giant secretory granules. Proc Natl Acad Sci U S A. 1987;84(7):1945–1949.
- Sardini A, Amey JS, Weylandt KH, et al. Cell volume regulation and swelling-activated chloride channels. Biochim Biophys Acta. 2003;1618(2):153–162.
- Passante E, Ehrhardt C, Sheridan H, et al. RBL-2H3 cells are an imprecise model for mast cell mediator release. Inflamm Res. 2009;58(9):611–618.
- Rysavy NM, Shimoda LM, Dixon AM, et al. Beyond apoptosis: the mechanism and function of phosphatidylserine asymmetry in the membrane of activating mast cells. Bioarchitecture. 2014;4(4–5):127–137.
- Joulia R, Gaudenzio N, Rodrigues M, et al. Mast cells form antibody-dependent degranulatory synapse for dedicated secretion and defence. Nat Commun. 2015;6:6174.
- Rothschild AM, Gomes EL, Rossi MA. Reversible rat mesenteric mast cell swelling caused by vagal stimulation or sham-feeding. Agents Actions. 1991;34(3–4):295–301.
- Fujita F, Uchida K, Takayama Y, et al. Hypotonicity-induced cell swelling activates TRPA1. J Physiol Sci. 2018;68(4):431–440.
- Sirianant L, Ousingsawat J, Wanitchakool P, et al. Cellular volume regulation by anoctamin 6: ca(2)(+), phospholipase A2 and osmosensing. Pflugers Arch. 2016;468(2):335–349.
- Zhang D, Spielmann A, Wang L, et al. Mast-cell degranulation induced by physical stimuli involves the activation of transient-receptor-potential channel TRPV2. Physiol Res. 2012;61(1):113–124.
- Stokes AJ, Shimoda LM, Koblan-Huberson M, et al. A TRPV2-PKA signaling module for transduction of physical stimuli in mast cells. J Exp Med. 2004;200(2):137–147.
- Stokes AJ, Wakano C, Del Carmen KA, et al. Formation of a physiological complex between TRPV2 and RGA protein promotes cell surface expression of TRPV2. J Cell Biochem. 2005;94(4):669–683.
- Solsona C, Innocenti B, Fernandez JM. Regulation of exocytotic fusion by cell inflation. Biophys J. 1998;74(2 Pt 1):1061–1073.