
 ?Mathematical formulae have been encoded as MathML and are displayed in this HTML version using MathJax in order to improve their display. Uncheck the box to turn MathJax off. This feature requires Javascript. Click on a formula to zoom.
ABSTRACT
The expanding field of extracellular vesicle (EV) research needs reproducible and accurate methods to characterize single EVs. Nanoparticle Tracking Analysis (NTA) is commonly used to determine EV concentration and diameter. As the EV field is lacking methods to easily confirm and validate NTA data, questioning the reliability of measurements remains highly important. In this regard, a comparison addressing measurement quality between different NTA devices such as Malvern’s NanoSight NS300 or Particle Metrix’ ZetaView has not yet been conducted. To evaluate the accuracy and repeatability of size and concentration determinations of both devices, we employed comparative methods including transmission electron microscopy (TEM) and single particle interferometric reflectance imaging sensing (SP-IRIS) by ExoView. Multiple test measurements with nanospheres, liposomes and ultracentrifuged EVs from human serum and cell culture supernatant were performed. Additionally, serial dilutions and freeze-thaw cycle-dependent EV decrease were measured to determine the robustness of each system. Strikingly, NanoSight NS300 exhibited a 2.0–2.1-fold overestimation of polystyrene and silica nanosphere concentration. By measuring serial dilutions of EV samples, we demonstrated higher accuracy in concentration determination by ZetaView (% BIAS range: 2.7–8.5) in comparison with NanoSight NS300 (% BIAS range: 32.9–36.8). The concentration measurements by ZetaView were also more precise (% CV range: 0.0–4.7) than measurements by NanoSight NS300 (% CV range: 5.4–10.7). On the contrary, quantitative TEM imaging indicated more accurate EV sizing by NanoSight NS300 (% DTEM range: 79.5–134.3) compared to ZetaView (% DTEM range: 111.8–205.7), while being equally repeatable (NanoSight NS300% CV range: 0.8–6.7; ZetaView: 1.4–7.8). However, both devices failed to report a peak EV diameter below 60 nm compared to TEM and SP-IRIS. Taken together, NTA devices differ strongly in their hardware and software affecting measuring results. ZetaView provided a more accurate and repeatable depiction of EV concentration, whereas NanoSight NS300 supplied size measurements of higher resolution.
Introduction
It is becoming more and more evident that extracellular vesicles (EVs) play a vital role in a variety of physiological and pathological processes. The preparation of a metastatic niche in pancreatic cancer [Citation1], the mediation of immune modulation by mesenchymal stem cells [Citation2] or the communication between neurons and glia cells [Citation3] are only few examples highlighting the immense impact of EVs in biomedical research. EVs are a heterogeneous group of membrane-confined particles including endosome-derived exosomes and plasma membrane-originated microvesicles and oncosomes [Citation4]. To this date, it is still challenging to distinguish the subgroups of EV, although they differ in biogenesis and size. Due to the lack of specific markers, the definition of the different EV subgroups remains non-uniform and the term “exosome” is often used synonymously to the concept of EVs [Citation5]. Still, most laboratories claim to investigate exosomes based on the isolation method applied, such as high-speed differential ultracentrifugation (UC) [Citation6] or other size- and density-dependent isolating techniques yielding EVs with a characteristic diameter of 50–150 nm. As particle size plays a significant role in EV characterisation, reliable methods to determine particle size in the nanometre range are of great need [Citation7,Citation8]. Early in biomedical EV research, transmission electron microscopy (TEM) was used to assess EVs that are undetectable by standard means of light microscopy due to their small size and low refractive index [Citation9,Citation10]. However, TEM has considerable disadvantages such as its dehydrating preparations causing shrinkage and an artificial cup-shaped morphology of EVs [Citation4,Citation11] as well as being time-consuming and technically challenging. Thus, it is not fully suitable to analyse EV size under a variety of different conditions. Moreover, the measurement of a single sample capturing narrow EV sections might fail to reflect the nature of a very heterogeneous EV fraction. Although EV concentration estimations can be provided by TEM via high-speed sedimentation on EM grids [Citation12], preparation complexity and limitations in comprehensive sample analysis demonstrates the need for high-throughput single particle methods that allow reliable quantification and size estimation.
A different approach to analyse EVs regarding their size, quantity and surface-protein characteristics is through single particle interferometric reflectance imaging sensing (SP-IRIS) [Citation13]. The SP-IRIS measurement was done using the ExoView platform (NanoView Biosciences, Boston), which employs a multiplexed microarray chip for the immuno-capture of EVs. CD9, CD63 and CD81-positive EVs are immuno-captured on a microarray chip and imaged on a single EV-basis. These images can then be analysed to enumerate and size the EVs bound to each of the antibody spots on the ExoView chip. Particles down to 50 nm can be detected with ExoView. Co-expression of up to three different proteins on a single EV-basis can be assessed by probing the captured EV with additional fluorescent antibodies. Accordingly, the major difference of ExoView to TEM and Nanoparticle tracking analysis (NTA) is that ExoView analyses particles selectively, based on the expression of the three “classical EV markers”, while in TEM and NTA, all particles exceeding the detection limit in the samples are detected, measured and counted.
The so far more commonly used NTA allows the analysis of EVs on a single particle-level in scatter and also in fluorescence mode (F-NTA) [Citation14,Citation15]. The principle of NTA is based on the characteristic movement of (nano)particles in solution according to the Brownian motion. The trajectory of the particles in a defined volume is documented by a camera that captures the scatter light upon illumination of the particles with a laser. Applying the Stokes–Einstein equation results in size determination for each tracked particle [Citation16–Citation18]. In addition, single particle count in relation with the cell volume allows determining particle concentration of samples. The NTA devices NanoSight NS300 (Malvern, UK) and ZetaView (Particle Metrix, Germany) both provide the means for size and concentration determination, which are of great importance for EV characterisation. Although both make use of NTA, their composition of hardware and software differs considerably. Camera magnification, measuring cell build-up, movement of sample and standardised settings are examples of differences between those two devices. To our knowledge, no comparative study has yet been conducted to evaluate different NTA devices regarding their measurement accuracy and repeatability of concentration and size determinations. Although several publications addressing device-dependent and -independent sources of NTA measurement error and uncertainty are available [Citation19–Citation24], more consideration to the technical aspects of NTA is needed to ensure the validity of acquired data. Thus, we performed an experimental comparison of the two instruments to assess this aspect. In this study, we provide a comprehensive analysis comparing NanoSight NS300 and ZetaView using synthetic nanospheres, liposomes, cell line- and serum-derived EVs. By performing multiple size and concentration test measurements, our results provide technical considerations on both the hardware and software setup of the NTA devices NanoSight NS300 and ZetaView and their impact on the reproducibility of EV analysis with nanoparticle tracking. Moreover, we discuss the findings in conjunction with the TEM data and ExoView results.
Materials and methods
Ethics approval
The collection of blood samples from healthy donors was approved by the local ethics committee of the University of Cologne under reference number 11–140.
Nanospheres
The 100 nm polystyrene nanospheres (Distrilab, Netherlands) and 100 nm silica nanospheres (nanoComposix, CA, USA) were used to assess measurement bias of size and concentration. Polystyrene (and silica) mean nanosphere size of 99.1 nm (97.0 nm) with an SD of 4.7 nm (5.0 nm) was determined by TEM (product information provided by the manufacturer). The nanosphere concentration was calculated by the known parameters nanosphere diameter, nanosphere density and percentage solids of nanosphere according to the formula provided below. For polystyrene nanospheres, our calculation resulted in a nanosphere concentration of 1.86E+13 per ml (nanosphere diameter: 99.1 ± 4.7 nm, sphere density: 1.054 g/cm3, percentage solids of nanosphere fraction: 1.00% w/w, fluid density of water: 1.00 g/cm3). For silica nanospheres, our calculation resulted in a nanosphere concentration of 9.99E+12 per ml (nanosphere diameter: 97.0 ± 5 nm, nanosphere density: 2.20 g/cm3, percentage solids of nanosphere fraction: 1.05% w/w, fluid density of water: 1.00 g/cm3).
Nanosphere concentration calculation:
where c: concentration [#/ml], ρ: density of nanospheres, W: percent solids of nanosphere fraction (w/w), and D: nanosphere diameter [µm].
Liposomes
90 nm–120 nm DOPC/CHOL (55:45 mol/mol) liposomes (FormuMax Scientific Inc., USA) were kept in hydration buffer (10% sucrose, 20 mM HEPES, pH 7.5 ± 0.2) at 4°C and processed for experiments (NTA and TEM) exactly as EVs.
EV isolation
For serum EVs: Blood samples were drawn from three healthy donors by venipuncture using serum tubes with gel (Sarstedt, Cat. No. 03.1524) and processed immediately for EV isolation. The blood was undisturbedly allowed to clot for 20 min at room temperature and was then centrifuged at 2000 xg for 10 min at 4°C. The obtained serum (28 ml) was diluted 1:10 in ice-cold PBS (4 × 70 ml UC tubes) and pre-centrifuged twice at 3500 xg for 20 min to deplete cell debris. For cell line EVs: L-540 Hodgkin cell lines were purchased from DSMZ (Brauschweig, Germany) and cultured in RPMI 1640 Medium + GlutaMax (Gibco) supplemented with 20% FCS (Gibco) and 1% Pen Strep (Gibco). For EV isolation, 6.0E+8L-540 cells (trypan blue determined viability >95%) were washed twice and seeded in serum-free medium (280 ml) for 24 h, afterwards cell supernatant was harvested by centrifugation at 300 xg for 5 min. The obtained supernatant was centrifuged at 2000 xg for 10 min followed by two pre-centrifugation steps at 3500 xg for 20 min to deplete cell debris. EV isolation by differential UC: The cleared supernatant from sera and L-540 cells was centrifuged at 10,000 xg for 30 min to receive the 10,000 xg (10k xg) EV fraction. Subsequently, the 10,000 xg cleared supernatant was passed through a 0.22 µm PES membrane filter (VWR) and ultracentrifuged (Type 45 Ti rotor, k-Factor 133, Beckman Coulter) with 100,000 xg for 90 min yielding the 100,000 xg (100k xg) EV fractions. Both, the 10k xg and the 100k xg pellets were washed twice (TLA-55 rotor, k-Factor 66, Beckman Coulter) with 1.5 ml PBS before they were resuspended in 250 µl PBS for analyses. Wash steps were performed under following settings: 10k xg pellet: centrifugation at 10,000 xg for 30 min; 100k xg pellet: centrifugation at 100,000 xg for 90 min. All steps were carried out at 4°C or on ice. The purified EVs from the three different donors as well as the purified EVs from three independent preparations of L-540 cell line conditioned media were pooled together. Samples were pooled to obtain biologically broad EV fractions for the evaluation and comparison of the respective measurement methods.
Transmission electron microscopy (TEM) imaging of liposomes and EVs
Formvar-coated copper grids (Science Services, München) were loaded with 5 µl of diluted sample (1:20) containing 0.17 µg (Serum 10k xg), 0.24 µg (L-540 10k xg), 0.35 µg (L-540 100k xg) or 0.78 µg protein (Serum 100k xg) as determined by BCA protein assay. The grids and samples were incubated for 20 min before being fixed with 2% paraformaldehyde for 5 min. Samples were washed with PBS and fixed again with 1% glutaraldehyde for 5 min, washed with Milli-Q water and contrasted for 4 min with 1.5% uranyl acetate. Images were acquired using a Gatan OneView 4K camera mounted on a Jem-2100Plus (Jeol) operating at 200kV. Samples were analysed with ImageJ software (NIH).
Western blot analysis of cell and EV lysates
Cells or EVs were lysed with RIPA buffer (Cell Signalling Technology Cat. No. 9806) and sonication. Then, 10 µg of total protein of each sample was separated on 10% SDS-PAGE under reducing conditions and transferred onto a nitrocellulose membrane (GE Healthcare, Freiburg, Germany). The membranes were blocked overnight with 5% milk at 4°C and incubated with primary antibodies (ABs) against CD63 (1:1000, BioLegend Cat. No. 353013), TSG101 (1:1000, Abcam Cat. No. ab83), HSP70 (1:1000, Enzo Life Sciences Cat. No. ADI-SPA-810-F,) and Calnexin (1:1000, Santa Cruz Biotechnology Cat. No. sc-23954) for 2 h at RT. After washing, the blots were incubated with HRP-conjugated anti-mouse IgG secondary antibody (1:3000, Cell Signalling Technology Cat. No. 7076) for 1 h at RT. Protein expression was visualised using the Immobilon Forte Western HRP Substrate (Merck Millipore, USA) and Bio-Rad ChemiDoc MP imaging system (Munich, Germany).
EV analyses with ExoView (NanoView Biosciences, USA)
All samples were diluted in PBS with 0.05% Tween-20 (PBST). The samples were incubated on the ExoView Tetraspanin Chip (EV-TC-TTS-01) placed in a sealed 24-well plate for 16 h at room temperature. The chips were then washed three times in 1 mL PBST for 3 min each on an orbital shaker. Then, chips were incubated with ExoView Tetraspanin Labelling ABs (EV-TC-AB-01) that consist of anti-CD81 Alexa-555, anti-CD63 Alexa-488, and anti-CD9 Alexa-647. The antibodies were diluted 1:5000 in PBST with 2% BSA. The chips were incubated with 250 µL of the labelling solution for 2 h. The chips were then washed once in PBST, three times in PBS followed by a rinse in filtered DI water and dried. The chips were then imaged with the ExoView R100 reader using the ExoScan 2.5.5 acquisition software. The data were then analysed using ExoViewer 2.5.0 with sizing thresholds set to 50 to 200 nm diameter.
Microsphere-based flow cytometric analyses of EVs
EVs were incubated overnight (4°C) with polystyrene microspheres (Polysciences INC, Warrington, PA). The microspheres were blocked with 2% BSA (v/w) in PBS for 1 h in a thermoshaker (25°C, 800 rpm). Next, the samples were incubated with unlabelled primary antibodies (BioLegend anti-human ABs: CD9 Cat. No. 312102; CD63 Cat. No. 353013; CD81 Cat. No. 349502) or annexin V-PE (BioLegend Cat. No. 640908). Subsequently, unlabelled antibody bound to EVs was detected by a secondary PE-labelled rat anti-mouse IgG1 AB (BioLegend, Cat. No. 406608). All ABs were diluted 1:100 and annexin V-PE was diluted 1:20 in flow cytometry buffer. Microspheres were analysed by a Gallios flow cytometer (Beckman Coulter).
NTA measurement with Nanosight NS300 (Malvern, UK)
All samples were diluted in PBS to a final volume of 1 ml. Ideal measurement concentrations were found by pre-testing the ideal particle per frame value (20–100 particles/frame). Following settings were set according to the manufacturer’s software manual (NanoSight NS300 User Manual, MAN0541-01-EN-00, 2017): camera level was increased until all particles were distinctly visible not exceeding a particle signal saturation over 20% (polystyrene nanospheres and 10k xg fractions of serum and cell line-derived EVs: level 12; 100k xg fractions of serum and cell line EVs and liposomes: level 14). The ideal detection threshold was determined to include as many particles as possible with the restrictions that 10–100 red crosses were counted while only <10% were not associated with distinct particles. Blue cross count was limited to 5. Autofocus was adjusted so that indistinct particles were avoided. For each measurement, five 1-min videos were captured under the following conditions: cell temperature: 25°C; Syringe speed: 40 µl/s. After capture, the videos have been analysed by the in-build NanoSight Software NTA 3.1 Build 3.1.46 with a detection threshold of 5. Hardware: embedded laser: 45 mW at 488 nm; camera: sCMOS. The number of completed tracks in NTA measurements was always greater than the proposed minimum of 1000 in order to minimise data skewing based on single large particles [Citation23].
NTA measurement with Zetaview (Particle Metrix, Germany)
All samples were diluted in PBS to a final volume of 1 ml. Ideal measurement concentrations were found by pre-testing the ideal particle per frame value (140–200 particles/frame). The manufacturer’s default software settings for EVs (& liposomes) or nanospheres were selected accordingly. For each measurement, three cycles were performed by scanning 11 cell positions each and capturing 30 frames per position under following settings: Focus: autofocus; Camera sensitivity for all samples: 75; Shutter: 100; Scattering Intensity: detected automatically; Cell temperature: 25°C. After capture, the videos were analysed by the in-built ZetaView Software 8.04.02 SP2 with specific analysis parameters: Maximum area: 1000, Minimum area 5, Minimum brightness: 25. Hardware: embedded laser: 40 mW at 488 nm; camera: CMOS. The number of completed tracks in NTA measurements was always greater than the proposed minimum of 1000 in order to minimise data skewing based on single large particles [Citation23].
Statistics
Data were analysed with GraphPad Prism 7 (CA, USA). All diagrams are presented either as mean ± SD or as representative single experiments. EV diameters were depicted as size distributions or stated as mode. As NTA sizing and concentration values derived from one sample are normally distributed, unpaired two-tailed Student’s t-test was used to compare both devices. A P value > 0.05 equals not significant (ns), ≤ 0.05 *, ≤0.01 **, ≤ 0.001 ***, ≤0.0001 ****.
Goodness-of-fit was quantified by calculating the coefficient of determination (R2) or the root-mean-square error (RMSE). Precision/repeatability was quantified by calculating the coefficient of variation (% CV):
Coefficient of variation = (standard deviation/mean) * 100.
Accuracy was quantified by calculating the measurement bias (% BIAS):
The deviation between NTA and TEM sizing was calculated as percent deviation from TEM (% DTEM):
EV-track
We have submitted all relevant data of our experiments to the EV-TRACK knowledgebase (EV-TRACK ID: EV180021) [Citation25]. Our EV-METRIC is 77%.
Results
Characterisation of EV samples using non-NTA methods
A prerequisite to evaluate and compare the measurement accuracy of NTA devices is the selection of suitable samples. Therefore, we employed independent methods including TEM, Western Blot, microsphere-based flow cytometry assay as well as a multiplexed microarray to characterise the purified EVs from human serum samples and L-540 conditioned medium (). After initial pre-centrifugations, EV pellets were collected after a 10,000 xg (10k xg fraction) centrifugation, intermittent 0.22 µm filtration step and a further 100,000 xg (100 xg fraction) ultra-centrifugation step.
Figure 1. Quality control of EVs utilised for comparative NTA device analysis.
(a). Representative electron microscopy images of pooled EVs isolated by ultracentrifugation (10k or 100k x g fractions) from human serum or L-540 conditioned medium. 30k and 100k magnifications are shown. (b). Immunoblot analysis of EVs isolated by ultracentrifugation (10k or 100k x g fractions) from serum or L-540 conditioned medium and corresponding cell lysates using the indicated antibodies. Data are representative of three independent experiments (biological replicates) using pooled EV samples. (c). Flow cytometric analysis of EVs bound to polystyrene microspheres and stained for the indicated EV marker proteins and phosphatidylserine by annexin V staining in comparison to IgG1 isotype control. Data are representative of three independent experiments (biological replicates) using pooled EV samples. (d). SP-IRIS immunophenotypic analysis by the multiplexed microarray ExoView of EVs isolated by ultracentrifugation (10k or 100k x g fractions) from serum or L-540 conditioned medium. EV samples were incubated with microarray chips coated with the indicated antibodies. Images of scattered light were taken (Supplemental Figure 1) and analysed regarding total EV number (captured EVs) or stained with the indicated fluorescent detection antibodies to count EVs expressing either CD9, CD63 or CD81 in addition to the marker used for capturing (EVs co-expressing CD9, CD63 or CD81). The error bars represent the SD from at least three technical replicates measuring pooled serum EVs (donors n = 3) and pooled L-540 EVs (independent EV isolations n = 3). The experiment has been performed twice at different time points using the same sample pool.
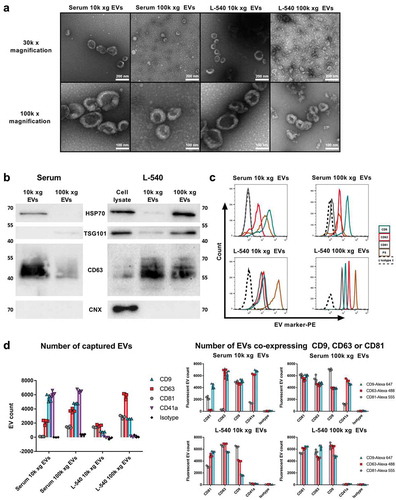
Analysis by TEM showed that these fractions contained EVs with a typical cup-shaped structure with larger and more heterogeneous particle sizes in the 10k xg compared to 100k xg fractions ()). Moreover, the serum 100k xg fraction magnified by 30k depicted non-EV particles with the same diameter as EVs. These particles such as lipoproteins cannot be differentiated from EVs with NTA in scatter mode, but show distinct contrast properties and morphology when visualised by TEM. This emphasises the need to compare and validate NTA data with microscopy techniques [Citation5,Citation26]. Western blotting of the purified EV fractions verified the presence of the EV marker proteins TSG101, CD63 and HSP70, of which CD63 and HSP70 were enriched in the L-540 EV fractions compared to the cell lysate. The lack of calnexin proved the purity of all EV samples ()). In addition, the EV-associated tetraspanins CD9, CD63 and CD81 as well as the phospholipid marker phosphatidylserine were detected in both EV fractions of serum and L-540 EVs with varying but mostly strong intensities using bead-assisted flow cytometry ()). An exception was CD81 on serum EVs, which was detected in the 100k xg fraction with low intensity, but not detectable on 10k xg EVs. Due to their nanoscale size, conventional flow cytometry can only detect EVs bound in bulk to microspheres.
To obtain more elaborate results, EV fractions were analysed by SP-IRIS using ExoView platform in order to quantify EVs depending on their expression of EV marker proteins. Here, EVs were captured by antibodies targeting CD9, CD63, CD81 (common EV marker) or CD41 (platelet EV marker) and subsequently imaged (Supplemental Figure 1) and quantified ()). The counts of captured CD9, CD63 and CD81 positive EVs correlated with the relative level of intensities obtained by bead-assisted flow cytometric analysis including the absence of CD81 on 10k xg and a low expression on 100k xg serum EVs (), left graph). Confirming the nature of isolated EVs, high levels of EVs bearing CD41a as a platelet marker were captured in both 10k and 100k xg fractions derived from serum EVs but were absent in EV preparations from L-540 conditioned medium, as expected. ExoView allows analysing the differential co-expression of EV markers on a single EV basis by probing captured EVs with a secondary fluorescence-labelled antibody (), right graphs). The most striking differential expression profiles were observed in the serum 10k xg EV fractions: CD63-captured EVs have virtually no CD81, while CD9 and CD63 co-expressing EVs are found in almost equal amounts. This is reflected in the CD81-captured EV sample of the same serum fraction, in which CD63 cannot be detected. Few CD41a-captured serum EVs expressed CD81in both, 10k xg and 100k xg, fractions, while the number of these EVs co-expressing CD9 and CD63 was comparable. No signal was detected from CD41a-captured L-540-EVs, as expected. The 10k xg EVs derived from L-540 conditioned medium and captured with CD9 showed a variable distribution of co-expressing EVs (CD9 < CD63 < CD81). Interestingly, CD81-captured serum 10k xg EV, which could not be counted under unlabelled conditions, showed clear fluorescent signals when probed with CD9 as well as CD81. This suggests that these CD81-positive EVs were smaller than 50 nm and thus below the threshold for non-fluorescent detection.
Overall, the analysis with these different techniques validated high-quality EV preparations that were subsequently used for the systematic comparison between the NTA devices NanoSight NS300 and ZetaView.
NTA devices overestimated EV size compared to TEM and SP-IRIS
First, the particle size distributions (PSDs) provided by the NTA devices NanoSight NS300 and ZetaView were systematically compared. For this, a spectrum of different synthetic samples was used in addition to the biological EV preparations characterised in . We used synthetic polystyrene as well as silica nanospheres to estimate the accuracy of size measurements with ZetaView and NanoSight NS300. Measurements of synthetic polystyrene and silica nanospheres produced major peaks at 100 nm in both NTA devices. This corresponded to the actual size specifications provided by the manufacturers ().
Figure 2. Device-dependent size determination of synthetic and biological samples.
Particle size distributions (PSDs) obtained by NanoSight NS300 (orange), ZetaView (blue), TEM (black) or ExoView [CD9 (cyan), CD63 (red) and CD81 (grey)] of different synthetic particle types (polystyrene or silica nanospheres and liposomes) and biological EVs isolated by ultracentrifugation (10k and 100k xg EVs from serum or L-540 cells) are depicted in . The particle size distribution overlays (left-hand side) combine and summarise all methods applied (NTA, TEM and SP-IRIS) for the respective samples. The TEM size distribution of polystyrene and silica nanospheres was plotted based on the manufacturers’ specifications (dashed filled area). Values of completed tracks for PSDs by NTA (CT), counted particles (CP) for TEM and ExoView PSDs and bin width of histograms are indicated, and graphs are representative for measuring samples using the optimal particle/frame rate according to the operating manual for each device (20–100 particles/frame for NanoSight NS300 and 140–200 particles/frame for ZetaView). Individual histograms of size distributions from NTA data comparing NanoSight NS300 and ZetaView, quantifications by TEM and ExoView data are shown. Standard deviations obtained from the size distributions comparing NanoSight NS300 and ZetaView are provided in Supplemental Figure 2.
![Figure 2. Device-dependent size determination of synthetic and biological samples.Particle size distributions (PSDs) obtained by NanoSight NS300 (orange), ZetaView (blue), TEM (black) or ExoView [CD9 (cyan), CD63 (red) and CD81 (grey)] of different synthetic particle types (polystyrene or silica nanospheres and liposomes) and biological EVs isolated by ultracentrifugation (10k and 100k xg EVs from serum or L-540 cells) are depicted in Figure 2. The particle size distribution overlays (left-hand side) combine and summarise all methods applied (NTA, TEM and SP-IRIS) for the respective samples. The TEM size distribution of polystyrene and silica nanospheres was plotted based on the manufacturers’ specifications (dashed filled area). Values of completed tracks for PSDs by NTA (CT), counted particles (CP) for TEM and ExoView PSDs and bin width of histograms are indicated, and graphs are representative for measuring samples using the optimal particle/frame rate according to the operating manual for each device (20–100 particles/frame for NanoSight NS300 and 140–200 particles/frame for ZetaView). Individual histograms of size distributions from NTA data comparing NanoSight NS300 and ZetaView, quantifications by TEM and ExoView data are shown. Standard deviations obtained from the size distributions comparing NanoSight NS300 and ZetaView are provided in Supplemental Figure 2.](/cms/asset/aad6d206-288a-4ceb-be16-6ed511513aff/zjev_a_1596016_f0002_oc.jpg)
However, we observed distinct differences in the size distribution profiles: ZetaView generated broader distributions, while the narrower distribution by NanoSight NS300 matched more closely the uniformity of the synthetic samples. The size distribution of liposomes and biological EV preparations (10k and 100k xg serum and L-540 fractions) was not only analysed by both NTA devices but also by TEM imaging and ExoView SP-IRIS technology. ExoView measurements are based on the light scattering intensity and have a detection limit of 50 nm. NTA measurements using both devices produced higher size peaks and broader distributions for 10k as compared to 100k xg serum and cell line EV fractions, which was consistent with the greater heterogeneity revealed by TEM imaging ( and )). However, size measurements by both NTA devices in general produced peaks at substantially higher sizes and broader size distributions as compared to TEM imaging as well as to SP-IRIS. This discrepancy might at least in part result from the physical principle of size determination of the NTA devices, which is calculated based on the motion of particles in solution and influenced by the surface protein composition of EVs [Citation27]. In line, measurements of liposomes, which are devoid of protein decorations, produced the lowest size peak using NanoSight NS300 followed by TEM imaging and ZetaView measurements. However, there is likely an overestimation of liposome size by TEM as we frequently detected larger structures in these samples. This could be due to the hydrodynamic instability of liposomes, which seem to be prone to fusion, especially during TEM preparations.
Taken together, size estimations of EV samples by TEM and ExoView revealed clearly that both NTA devices fail to report EVs smaller than 50 nm. By approximating the intersection of the curves produced by NTA with those of TEM image-based and ExoView-based curves (using the most homogeneous 100k xg serum EV fraction), the lower limit of detection of NTA could be estimated to be 60–70 nm. Moreover, we statistically compared the width of single size distribution as a parameter to evaluate the accuracy of sizing (Supplemental Figure S2). Here, TEM showed a narrower size distribution than both NTA measurements as indicated by a smaller standard deviation of both polystyrene and silica nanospheres. Comparing the two NTA devices, NanoSight NS300 showed lower SDs than ZetaView, which was also closer to the size distributions provided by TEM. Thus, NanoSight NS300 seemed to be more accurate in sizing synthetic nanospheres than ZetaView.
Analysing nanospheres, ZetaView determined concentrations more accurately and precisely, while NanoSight NS300 was superior in size estimations
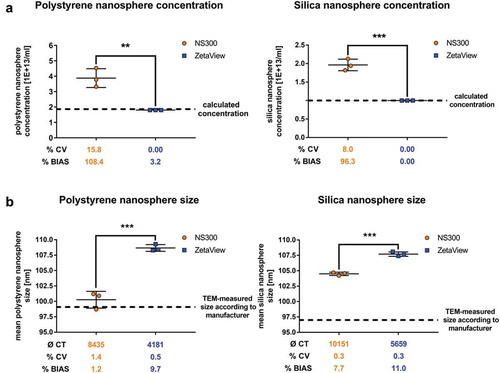
The major focus of our studies was to assess both NTA devices regarding their abilities to determine the size as well as the concentration of samples. Therefore, synthetic polystyrene and silica nanosphere solutions were measured in triplicates. Results were statistically compared to each other and also to the known size and concentration (according to the manufacturer’s specifications), respectively.
NanoSight NS300 showed a 2.1-fold overestimation of the expected synthetic polystyrene nanosphere concentration, whereas ZetaView measured the concentration very accurately with a substantially lower bias (NS300 108.4% vs ZetaView 3.2%) (), left panel). In line, NanoSight NS300 showed less precision as indicated by a higher coefficient of variation than ZetaView for triplicates measured with identical settings (NS300 CV 15.8% vs. ZetaView CV 0.00%). We confirmed this observation using silica nanospheres (with a refractive index closer to EVs than polystyrene nanospheres), which were overestimated by NanoSight NS300 2.0-fold (BIAS 96,3% and CV 8.0%) and measured more precisely by ZetaView (BIAS 0.00% and CV 0.00%) (), right panel). In contrast, NanoSight NS300 measurements displayed a more accurate sizing than ZetaView of both polystyrene (NS300 BIAS 1.2% vs. ZetaView BIAS 9.7%) and silica nanospheres (NS300 BIAS 7.7% vs. ZetaView BIAS 11.0%) ()). Taken together, these data showed that the measurement of the concentration of synthetic nanospheres was more precise and accurate using ZetaView, while NS300 was more accurate in sizing.
Figure 3. Concentration and size measurements of synthetic nanospheres comparing NanoSight NS300 and ZetaView.
Concentration measurements (a) or size measurements (b) of polystyrene and silica nanospheres acquired with NanoSight NS300 or ZetaView. Measurements of the same dilution were performed using the optimal particle/frame rate according to the operating manual for each device (20–100 particles/frame for NanoSight NS300 and 140–200 particles/frame for ZetaView). Each measurement results from 5 one-minute videos (NanoSight NS300) or the mean of 11 cell position records (ZetaView). The average of completed tracks (CT), the coefficient of variation (% CV, precision) and the measurement bias (% BIAS, accuracy) are indicated. The dashed lines indicate the calculated sphere concentration of the stock solution (polystyrene nanospheres 1.86E+13 #/ml; silica nanospheres 1.00E+13 #/ml) in (a) and the particle size as stated by the manufacturer in (b). Mean and SD of three technical measurements are shown.
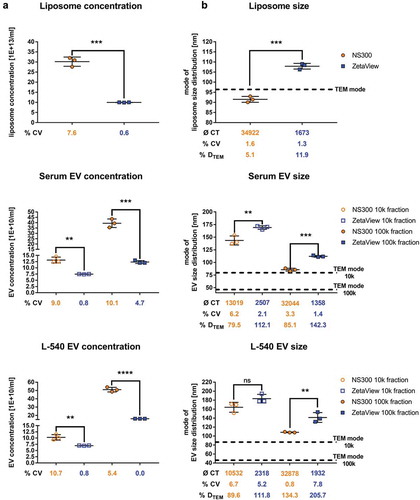
ZetaView and NanoSight NS300 provided different concentration and size measurements of liposomes and EVs
Unlike monodispersed synthetic nanospheres, polydispersed samples such as EVs are greater challenges for accurate and precise measurements. Here, we evaluated both NTA devices regarding their accuracy and repeatability using liposomes and purified EVs from human serum and conditioned medium of the Hodgkin lymphoma cell line L-540.
Similar to synthetic nanosphere measurements (), NanoSight NS300 provided significantly higher concentrations of liposomes and purified EV fractions compared to ZetaView (), liposomes 3.0-fold; EV samples 1.5–3.2-fold). The calculated size obtained by ZetaView was significantly higher than by NanoSight. Sole exception was the 10k xg L-540 EV fraction, which did not show statistically significant differences in particle size and provided the lowest NanoSight NS300/ZetaView concentration ratio of 1.5. This is probably due to decreased camera level settings. The camera level had to be decreased in both the 10k xg fractions of serum and cell line EVs to accommodate higher sample scatter, which lead to a decreased detection of smaller particles. ZetaView showed concentration measurements with higher repeatability compared to NanoSight NS300 regarding liposome (CV: NanoSight NS300 7.6% vs. ZetaView 0.6%), serum EVs (CV: 10k xg NanoSight NS300 9.0% vs. 0.8% ZetaView; 100k xg NanoSight NS300 10.1% vs. 4.7% ZetaView) as well as L-540 cell line EVs (10k xg NanoSight NS300 10.7% vs. 0.8% ZetaView; 100k xg NanoSight NS300 5.4% vs 0.0% ZetaView). In summary, the precision of EV concentration measurements ranged from 0.0% to 4.7% CV in ZetaView and from 5.4% to 10.7% CV in NanoSight NS300. Furthermore, size measurements of liposomes, as well as serum and cell line EV fractions, revealed significant differences between both devices: comparing the mode of size distributions, ZetaView consistently measured higher particle diameters (approximately 20–40 nm) than NanoSight NS300 ()). Compared to size measurements compiled by TEM imaging, both devices reported substantially higher diameters of biological EV preparations (NanoSight NS300 DTEM 79.5%–134.3%; ZetaView DTEM 111.8%–205.7%). The associated implications on the accuracy of EV sizing are discussed later. Interestingly, liposomes measured by NanoSight NS300 did not show exceeded size determinations compared to TEM.
Figure 4. Concentration and size measurements of liposomes and biological EV preparations comparing NanoSight NS300 and ZetaView.
Concentration measurements (a) or size measurements (b) of liposomes or EVs isolated by ultracentrifugation (10k and 100k x g fractions) from serum or L-540 cell culture supernatants. Measurements were performed using the optimal particle/frame rate according to the operating manual for each device (20–100 particles/frame for NanoSight NS300 and 140–200 particles/frame for ZetaView). Each measurement results from five 1-min videos (NanoSight NS300) or the mean of 11 cell position records (ZetaView). The average of completed tracks (CT), the coefficient of variation (% CV, precision) and the measurement deviation from TEM (% DTEM) are indicated. Horizontal dashed lines indicate the mode of particle size from TEM measurements of the respective samples. Mean and SD of three technical measurements are shown.
ZetaView was more accurate in determining concentrations of serially diluted EV
Measurements of serially diluted samples were used to obtain information about accuracy, consistency and data reproducibility. Furthermore, a standard curve generated by stepwise dilutions provided a tool to analyse the accuracy of the tested devices to measure the concentration of samples with unknown absolute concentration (due to a lack of biological EV standards). To assess the capacity of the two NTA devices in this respect, we performed measurements of serially diluted liposomes, serum EVs, as well as L-540 conditioned medium-derived EVs.
Starting concentrations of the serial dilutions were chosen to match the upper limit of ideal measurement conditions. In accordance with , the starting concentration values obtained by NanoSight NS300 exceeded the values acquired by ZetaView for all samples ranging from 1.8 to 2.6-fold concentrations (). The ZetaView device precisely and accurately determined concentrations of liposomes and EV samples as the measured values of the serially diluted samples fitted to the expected linear regression model with R2 values close to 1 (R2 > 0.999; %BIAS range 1.9–8.5). In contrast, NanoSight NS300 was considerably less precise and accurate and overestimated all measured dilution steps (R2 of 0.975–0.985; %BIAS range 31.6–36.8).
Figure 5. Serial dilution concentration measurements of liposomes and biological EV preparations.
Concentration measurements (a) or size measurements (b) of serially diluted liposomes or serially diluted EVs isolated by ultracentrifugation (100k x g fractions) from serum or L-540 cell culture supernatants using NanoSight NS300 and ZetaView. The starting EV concentration was chosen at the highest end of the optimal settings range to analyse as many dilution steps with optimal settings as possible. Solid lines depict expected linear regression models and goodness-of-fit is indicated as the coefficient of determination (R2) and the root-mean-square error (RMSE). The measurement bias (%BIAS, accuracy) is indicated for concentrations measurements in (a) and the number of completed tracks (CT) is indicated for size measurements in (b). Mean and SD of three technical measurements are shown. The experiment has been performed twice at different time points using different sample pools.
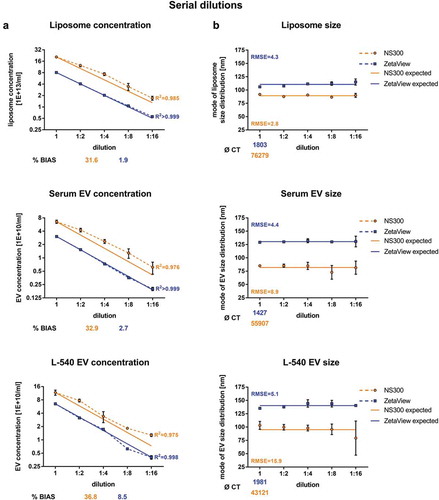
An ideal measurement device should provide the same particle size of the same sample regardless of its dilution. Therefore, we compared the measured sizes to the mean of all serial dilution measurements of the respective samples ()). The size distributions of liposomes remained unaffected by the dilution. In contrast, size measurements of biological EV samples posed higher difficulty for the NanoSight NS300 device to reliably determine the expected size, reflected in high standard deviations and high RMSE values (8.9 for serum EVs and 15.9 for L-540 cell line EVs), whereas ZetaView determined the size of serum and L-540 cell line EVs more consistently (RMSE 4.4 for serum EVs and 5.1 for L-540 cell line EVs). Overall, the relative inaccuracy of NanoSight NS300 correlated with the lower reproducibility of measurements observed in previous experiments ( and ).
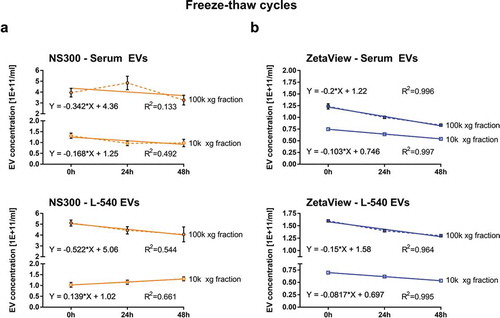
Impact of freeze-thaw-cycles on EV concentration was only detected by ZetaView
Next, we compared the sensitivity of the devices regarding their ability to discriminate slight changes in EV concentration. For this, we used two repeated 24 h freeze-thaw-cycles (23.5 h freeze; 0.5 h thaw) at -80°C to investigate sample stability of purified EVs in PBS over 2 days. Using NanoSight NS300, EV sample concentrations increased and decreased without any allegeable biological pattern, which was reflected by relatively low R2 values ()). In contrast, the same sample measured by ZetaView showed a constantly declining concentration in all EV fractions analysed with increasing freeze-thaw-cycles. The measured decrease of EVs by 8%–20% per freeze-thaw-cycle the R2 values yielded close to 1 (Serum 10k xg EVs -10% per cycle, Serum 100k xg -20% per cycle; L-540 10k xg EVs: -8% per cycle; L-540 100k xg EVs: -15% per cycle) ()). Our results indicate that concentration changes in response to freeze-thaw-dependent EV degradation can be better monitored using ZetaView, whereas NanoSight NS300 does not seem to be able to detect these differences.
Figure 6. Measurement of freeze-thaw-cycle-dependent EV concentration.
Particle concentration measurements of EVs isolated by ultracentrifugation (10k and 100k x g fractions) from serum or L-540 conditioned medium before and after 1. and 2. freeze-thaw-cycles using NanoSight NS300 (a) and ZetaView (b). One freeze-thaw-cycle consisted of 23.5 h at −80°C followed by 30 min thawing on ice before measurement. Depicted are the mean and SD of three technical measurements. The experiment has been performed twice at different time points using different sample pools.
Discussion
As NTA enables EV characterisation by size and concentration determination, it is widely used among laboratories interested in the field of EVs. So far, Malvern’s NanoSight NTA devices are most frequently cited (Supplemental Figure 3), but with the release of ZetaView by Particle Metrix, an interesting competitor instrument complements the market. Therefore, we aimed to provide a systematic comparison of measurement accuracy and repeatability of both devices. We also discuss measurement-affecting software and hardware build-up as well as the evaluation of NTA data generated with different settings.
The EV samples used to compare the two NTA instruments were thoroughly characterised according to the MISEV guidelines 2014 by Lötval et al. [Citation5]. These analyses confirmed the presence of EV markers by Western blot of cell line-derived EVs and of EVs isolated from serum. To further characterise the EV samples with another method, we applied an immunophenotypical analysis with SP-IRIS and determined the size distribution of CD9, CD63 and CD81-positive EVs.
To compare size and concentration accuracy of measurements with both devices, we performed multiple test measurements with polystyrene and silica nanospheres, liposomes and EVs derived from serum and cell. Quantified TEM imaging was performed to obtain size distributions as a reference to compare the sizing of both devices.
Interestingly, NanoSight NS300 overestimated nanosphere concentration by twofold while providing detailed PSDs of both mono- and polydispersed samples. On the other hand, ZetaView provided more repeatable nanosphere concentration but displayed higher SDs of size distribution, indicating a less precise size determination for single particles. Further, ZetaView’s superiority regarding particle quantification was confirmed by more accurate measurements of serial dilutions and the tracking of freeze-thaw-cycle-dependent concentration loss of EVs. To compare the repeatability of both devices, every measurement was performed with technical triplicates. For all samples applied, we demonstrated that concentration measurements by ZetaView displayed high repeatability, which was not achieved by Malvern’s NanoSight NS300.
NTA software and settings
To assess NTA device performance with respect to accuracy and reproducibility, it is necessary to consider the importance of NTA software and settings. Reported previously by Maas et al. [Citation20] and also in our experience, most notably the camera settings in both devices (NanoSight NS300: camera level; ZetaView: camera sensitivity) have a profound impact on size and concentration of the measured particles [Citation28,Citation29]. It is not possible to measure a sample with highest camera setting, because increased noise will impede analysis of scattered light from EVs. Thus, every measurement deals with the inevitable measurement error generated by the choice of lower camera setting. If the camera setting is reduced, the measured concentration will decline by excluding relatively dim EVs. The number of lost particles per reduced camera level is sample-dependent and cannot be determined by manual standardisation. Considering this, it is absolutely necessary that the settings are always clearly stated. An absolute measurement value for EV size, and more importantly, for concentration without specification of camera level/sensitivity and other applied settings is useless and cannot be reproduced. A major focus needs to be on the standardisation of software settings and measurement protocols to prevent non-reproducibility due to operator’s variability and to allow comparison between different studies [Citation30–Citation33]. However, it is important to keep in mind that analysis algorithms can also produce unwanted manipulation of data. As previously described, the finite track length adjustment (FTLA) created irreproducible artificial subpeaks that could be mistaken for EV subpopulations [Citation22,Citation34]. On the other hand, the inbuilt ZetaView software 8.02.31 supplies an algorithm displaying camera sensitivity against traced particles [Citation35], which simplifies and standardises the choice of camera settings. ZetaView’s software provides a real-time concentration display, calculating concentration estimations from the field-of-view (Supplemental Figure 4). This convenient feature strongly facilitated the finding of optimal measurement concentrations and thus supported reproducibility.
NTA hardware
The NTA hardware plays a key role comparing both devices. ZetaView’s choice of 10x magnification camera in combination with a broad cell could allow for a better determination of the z-plane and, therefore, could offer a better out-of-focus determination for single EVs. This would explain more repeatable concentration measurement compared to NanoSight NS300. To rule out that NanoSights NS300’s lack in repeatability resulted from a low number of completed tracks compared to ZetaView, we have demonstrated that every comparative measurement between ZetaView and NanoSight depicted far more EVs tracked by NanoSights NS300 than ZetaView. This is probably caused by the combination of syringe pump and long video capture settings of NanoSight NS300. Hence, we ruled out that the number of completed particle tracks is the reason for the measurement variance of NanoSight NS300 in concentration determinations of nanospheres. The exact reason for the overestimating polystyrene and silica nanospheres and strong differences in repeatability remain to be examined. Moreover, we suspect that the NanoSight software does not clearly distinguish individual EVs to avoid counting each EV multiple times, presumably because the focus plane cannot be precisely defined.
However, ZetaView’s strength of repeatability comes at the expenses of a less accurate, (though not necessarily less repeatable) size determination, especially for heterogeneous EV samples. The not fully repeatable but more accurate size measurements by NanoSight NS300 could be explained by better trajectory determination through a greater magnification (20x) but also by a more limited analysis due to tracking only particles in a narrow field of view. Additionally, in our experience and confirmed by previous studies [Citation36], the syringe pump used by NanoSight NS300 and moving samples with a speed of 0–50 µl/s caused overlapping effects and analysis error distorting concentration measurements. On the other hand, high particle throughput by adequately high syringe speed has to be achieved to ensure reliable statistics, in particular in combination with a narrow 20x magnification capture. This syringe speed dilemma is one of NanoSight NS300’s bigger disadvantages regarding concentration measurement. Particle Metrix solved this problem by using the mentioned 10x magnification capture and additionally by moving the camera on a slide above to 11 distinct positions throughout the broad cell. This results in an improved statistic without having to move the sample, possibly leading to an extensive analysis of particles and steady capture less prone to overlapping phenomena and analysis errors.
Accuracy of concentration and size measurements by NTA
We observed that the estimation of the concentration using both NTA devices differed significantly and was always approximately 2–3-fold higher for NanoSight NS300 than for ZetaView suggesting that the concentration was either overestimated for NanoSight NS300 or underestimated for ZetaView. Interestingly, this was true for EV samples of different origin and for measurements of synthetic nanospheres and liposomes. A recent study by Vestad and colleagues found similar overestimations of 128% to 158% in independent measurements of 100 nm polystyrene nanospheres (Duke Scientific Corp./NanoSight) and 150 nm silica nanospheres (168%) (Polysciences, Inc.) performed using a different NanoSight device (NS500) [Citation37]. They argued that this error could be explained by a possibly inaccurate mathematical determination of polystyrene nanosphere concentration. Here, we did not only independently confirm the results for polystyrene and silica nanospheres, but verified the error by comparative ZetaView measurements. Additionally, NanoSight NS300 measurements were performed strictly adhering to the instructions given by the NanoSight NS300 user manual. Thus, it is highly unlikely that the described measurement error is due to incorrect instrument settings, but rather related to device- and software-dependent attributes of NanoSight devices. We, therefore, claim that polystyrene and silica nanosphere concentrations are overestimated by NanoSight NS300 and operators should be cautious in interpreting absolute concentration determinations. The limitations of standardisation and calibration approaches such as instrument setting alteration or mathematical factor correction of observed overestimation of synthetic nanospheres reveal the requirement for novel calibration and standardisation beads and approaches. Decreasing the camera level or increasing the detection threshold would lead to an exclusion of smaller EVs causing a right-shifted PSD. A mathematical correction factor would vary between sample types and different measurement concentrations () and is thus not easily applicable. It is, therefore, important to further investigate the overestimation of concentrations observed in synthetic nanospheres and its implications for measuring EV concentrations.
General conclusions on over- or underestimation for EV sample concentration cannot be drawn from the measurements of synthetic nanospheres, which do not reflect the complexity of size and refractive index spectra of EV samples. Therefore, instead of polystyrene nanospheres, which have a considerably higher refractive index than EV samples, silica or hollow organosilica nanospheres should be assessed to calibrate concentration measurements by light scattering methods [Citation9,Citation10,Citation38]. However, although both NTA devices are still being calibrated with polystyrene nanospheres, ZetaView seemed to be less affected reporting substantially lower biases and higher precision for concentration analyses of synthetic nanospheres.
The concentration measurement may depend on various parameters including size and device-dependent detection limits. Important for this consideration is the EV surface protein cargo, which can attenuate EV motility in solution [Citation27]. Thus, the protein surface cargo falsifies the diameter measured by NTA resulting in a broader and phase-shifted size distribution of EVs.
The comparison of NTA and TEM-estimated EV size distributions showed that both NTA devices measured substantially larger EV diameter compared to TEM and it seemed that smaller EVs (diameter less than 60 nm) were not detected by NTA (). TEM preparations cause dehydration and shrinkage, which is estimated to be 0%–21% of the real EV diameter as determined by cryo-electron microscopy or resistive pulse sensing [Citation22,Citation39,Citation40]. Thus, TEM cannot be considered an exact reference to evaluate the accuracy of sizing. Nonetheless, the NTA size deviation from TEM values, ranging from 79.5% to 205.7% for both devices, exceeded the estimated shrinkage by far, leading to the conclusion that the comparison to TEM strongly indicated more accurate sizing reported by NanoSight NS300 compared to ZetaView. All in all, the strong increase of the EV size measured by NTA compared to TEM is due to the fact that part of the EVs are below the resolution limit of NTA, due to a distortion of NTA sizing caused by surface cargo of EVs impeding motility and also due to an underestimation of the EV size measured by TEM based on sample preparation causing shrinkage. Taking everything into account for concentration analyses, we cannot tell whether small EVs are overestimated in their size, but still tracked and consequently included in the concentrations measurement or not tracked and not counted due to the detection limit of the devices.
Given that the correct concentration of an EV sample is unknown, we can still conclude that ZetaView measurements were more repeatable and required less replicates to obtain both size and concentration estimations, whereas the absolute accuracy remains to be determined. For that matter, future studies should also compare EV quantification by scatter mode NTA with more EV-specific methods like F-NTA or SP-IRIS.
Repeatability of concentration and size measurements by NTA
Our study showed that Particle Metrix’ device ZetaView allowed more repeatable concentration measurements and equally repeatable size measurements (only under ideal particle/frame ratio) for monodispersed synthetic nanospheres as well as biologically relevant polydispersed EVs and liposomes than NanoSight NS300. ZetaView was sensitive enough to measure biological effects such as EV degradation in frozen purified EV samples and represented more reliable measurements of serial dilutions. Due to software features and hardware build-up, concentration determinations were less prone to operator variability and thus more reproducible.
Conclusion
NTA determinations for scientific purpose need to be handled with caution. We showed that accurate and repeatable measurements cannot be taken for granted and depend strongly on measurement settings, sample heterogeneity and device-dependent attributes. Investigations of EV concentrations and concentration changes under different conditions could benefit from using ZetaView, which provides more repeatable measurements requiring less replicates to obtain both size and concentration estimations for synthetic nanospheres, liposomes and EVs of different origins. Consequently, due to the software and hardware build-up, ZetaView was more accurate in determining serially diluted EVs (%BIAS range: 2.7–8.5) and more precise (%CV range: 0.0–4.7) in comparison with NanoSight NS300.
However, laboratories prioritizing accurate size measurement with higher resolution in the nanometre range would benefit from NanoSight NS300’s 20x magnification. Of note, both NTA devices could not reproduce TEM-derived size distributions with peak diameter below 50 nm pointing out limitations of NTA. Differences might depend on the detection limit of NTA for smaller EVs and on the impact of protein surface cargo of EVs on their motility falsifying NTA-derived size distributions [Citation27].
In summary, NTA operators need to be aware of potential measurement errors demanding scientific transparency by stating all measurement conditions and settings. Future development of NTA devices’ software and hardware should focus on standardizing measurements for biological application in order to minimise operator’s influence on measurements. Combining hardware and software features of the NTA devices tested here to improve both size and concentration determinations is a worthwhile aim so that the very promising field of EV research can be accompanied by reproducible measurements.
Geolocation information
Department of Internal Medicine I, University Hospital Cologne, Kerpener Str. 62, 50,937 Cologne, Germany: 50°55ʹ22.8”N 6°54ʹ53.7”E
Experimental Tumour Research Centre for Tumour Biology and Immunology, Philipps-Universität Marburg, Hans-Meerwein-Straße 3, 35043 Marburg, Germany: 50°48ʹ41.5”N 8°48ʹ39.0”E
Supplemental Material
Download PDF (673.1 KB)Acknowledgments
DB was supported by the graduate program in Pharmacology and Experimental Therapeutics at the University of Cologne, which is financially and scientifically supported by Bayer. The work was supported by a DFG grant (KFO325) and by the Wilhelm Sander-Stiftung (grant 2015.145.1) to EPvS.
Disclosure statement
No potential conflict of interest was reported by the authors.
Supplementary material
Supplemental data for this article can be accessed here.
Additional information
Funding
Related Research Data
References
- Costa-Silva B, Aiello NM, Ocean AJ, et al. Pancreatic cancer exosomes initiate pre-metastatic niche formation in the liver. Nat Cell Biol. 2015 Jun;17(6):816–18. PubMed PMID: 25985394; PubMed Central PMCID: PMCPMC5769922. eng.
- Borger V, Bremer M, Ferrer-Tur R, et al. Mesenchymal stem/stromal cell-derived extracellular vesicles and their potential as novel immunomodulatory therapeutic agents. Int J Mol Sci. 2017 Jul 6;18(7). PubMed PMID: 28684664; PubMed Central PMCID: PMCPMC5535941. eng.
- Fruhbeis C, Frohlich D, Kuo WP, et al. Neurotransmitter-triggered transfer of exosomes mediates oligodendrocyte-neuron communication. PLoS Biol. 2013 Jul;11(7):e1001604. PubMed PMID: 23874151; PubMed Central PMCID: PMCPMC3706306. eng.
- van Niel G, D’Angelo G, Raposo G. Shedding light on the cell biology of extracellular vesicles. Nat Rev Mol Cell Biol. 2018;19(4):213–228. PubMed PMID: 29339798.
- Lotvall J, Hill AF, Hochberg F, et al. Minimal experimental requirements for definition of extracellular vesicles and their functions: a position statement from the international society for extracellular vesicles. J Extracell Vesicles. 2014;3:26913. PubMed PMID: 25536934; PubMed Central PMCID: PMCPMC4275645. eng.
- Momen-Heravi F. Isolation of extracellular vesicles by ultracentrifugation. Methods Mol Biol. 2017;1660:25–32. PubMed PMID: 28828645; eng.
- Erdbrugger U, Lannigan J. Analytical challenges of extracellular vesicle detection: a comparison of different techniques. Cytometry A. 2016 Feb;89(2):123–134. PubMed PMID: 26651033.
- Buzas EI, Gardiner C, Lee C, et al. Single particle analysis: methods for detection of platelet extracellular vesicles in suspension (excluding flow cytometry). Platelets. 2017 May;28(3):249–255. PubMed PMID: 28033028.
- Gardiner C, Shaw M, Hole P, et al. Measurement of refractive index by nanoparticle tracking analysis reveals heterogeneity in extracellular vesicles. J Extracell Vesicles. 2014;3:25361. PubMed PMID: 25425324; PubMed Central PMCID: PMCPMC4247498.
- Van Der Pol E, Coumans FA, Sturk A, et al. Refractive index determination of nanoparticles in suspension using nanoparticle tracking analysis. Nano Lett. 2014;14(11):6195–6201.
- Szatanek R, Baj-Krzyworzeka M, Zimoch J, et al. The methods of choice for extracellular vesicles (EVs) characterization. Int J Mol Sci. 2017 May 29;18(6). PubMed PMID: 28555055; PubMed Central PMCID: PMCPMC5485977.
- Linares R, Tan S, Gounou C, et al. Imaging and quantification of extracellular vesicles by transmission electron microscopy. Methods Mol Biol. 2017;1545:43–54. PubMed PMID: 27943206; eng.
- Daaboul GG, Gagni P, Benussi L, et al. Digital detection of exosomes by interferometric imaging. Sci Rep. 2016 Nov 17; 6:37246. PubMed PMID: 27853258; PubMed Central PMCID: PMCPMC5112555 Daaboul is the chief scientific officer of Nexgenarrays LLC. David Freedman is the chief executive officer of NexgenArrays LLC. All remaining contributing authors declare no competing financial interests.
- Carr B, Wright M. Nanoparticle tracking analysis. Innovations Pharm. Technol. 2008;26:38–40.
- Carnell-Morris P, Tannetta D, Siupa A, et al. Analysis of extracellular vesicles using fluorescence nanoparticle tracking analysis. Methods Mol Biol. 2017;1660:153–173. PubMed PMID: 28828655; eng.
- Giebel B, Helmbrecht C. Methods to analyze EVs. Methods Mol Biol. 2017;1545:1–20. PubMed PMID: 27943203; eng.
- Dragovic RA, Gardiner C, Brooks AS, et al. Sizing and phenotyping of cellular vesicles using nanoparticle tracking analysis. Nanomed. 2011 Dec;7(6):780–788. PubMed PMID: 21601655; PubMed Central PMCID: PMCPMC3280380. eng.
- Kestens V, Bozatzidis V, De Temmerman PJ, et al. Validation of a particle tracking analysis method for the size determination of nano- and microparticles. J Nanopart Res. 2017;19(8):271. PubMed PMID: 28824287; PubMed Central PMCID: PMCPMC5543194.
- Tian X, Nejadnik MR, Baunsgaard D, et al. A comprehensive evaluation of nanoparticle tracking analysis (nanosight) for characterization of proteinaceous submicron particles. J Pharm Sci. 2016;105(11):3366–3375.
- Maas SL, de Vrij J, van der Vlist EJ, et al. Possibilities and limitations of current technologies for quantification of biological extracellular vesicles and synthetic mimics. J Control Release. 2015 Feb 28;200:87–96. PubMed PMID: 25555362; PubMed Central PMCID: PMCPMC4324667.
- Matsuura Y, Ouchi N, Nakamura A, et al. Determination of an accurate size distribution of nanoparticles using particle tracking analysis corrected for the adverse effect of random Brownian motion. Phys Chem Chem Phys. 2018 Jul 4;20(26):17839–17846. PubMed PMID: 29923555.
- van der Pol E, Coumans FA, Grootemaat AE, et al. Particle size distribution of exosomes and microvesicles determined by transmission electron microscopy, flow cytometry, nanoparticle tracking analysis, and resistive pulse sensing. J Thromb Haemost. 2014 Jul;12(7):1182–1192. PubMed PMID: 24818656; eng.
- Gardiner C, Ferreira YJ, Dragovic RA, et al. Extracellular vesicle sizing and enumeration by nanoparticle tracking analysis. J Extracell Vesicles. 2013;2. PubMed PMID: 24009893; PubMed Central PMCID: PMCPMC3760643. DOI:10.3402/jev.v2i0.19671
- Filipe V, Hawe A, Jiskoot W. Critical evaluation of nanoparticle tracking analysis (NTA) by NanoSight for the measurement of nanoparticles and protein aggregates. Pharm Res. 2010 May;27(5):796–810. PubMed PMID: 20204471; PubMed Central PMCID: PMCPMC2852530. eng.
- Consortium E-T, Van Deun J, Mestdagh P, et al. EV-TRACK: transparent reporting and centralizing knowledge in extracellular vesicle research. Nat Methods. 2017 Feb 28;14(3):228–232. PubMed PMID: 28245209.
- Thery C, Witwer KW, Aikawa E, et al. Minimal information for studies of extracellular vesicles 2018 (MISEV2018): a position statement of the international society for extracellular vesicles and update of the MISEV2014 guidelines. J Extracell Vesicles. 2018;7(1):1535750. PubMed PMID: 30637094; PubMed Central PMCID: PMCPMC6322352.
- Skliar M, Chernyshev VS, Belnap DM, et al. Membrane proteins significantly restrict exosome mobility. Biochem Biophys Res Commun. 2018 Jul 2;501(4):1055–1059. PubMed PMID: 29777705.
- Gross J, Sayle S, Karow AR, et al. Nanoparticle tracking analysis of particle size and concentration detection in suspensions of polymer and protein samples: influence of experimental and data evaluation parameters. Eur J Pharm Biopharm. 2016 Jul;104:30–41. PubMed PMID: 27108267; eng.
- Defante AP, Vreeland WN, Benkstein KD, et al. Using image attributes to assure accurate particle size and count using nanoparticle tracking analysis. J Pharm Sci. 2017 Dec 23. PubMed PMID: 29277640; eng.
- Hole P, Sillence K, Hannell C, et al. Interlaboratory comparison of size measurements on nanoparticles using nanoparticle tracking analysis (NTA). J Nanopart Res. 2013;15:2101. PubMed PMID: 24348090; PubMed Central PMCID: PMCPMC3857864.
- Parsons MEM, McParland D, Szklanna PB, et al. A protocol for improved precision and increased confidence in nanoparticle tracking analysis concentration measurements between 50 and 120 nm in. Fluids B. Front Cardiovasc Med. 2017;4:68. PubMed PMID: 29164135; PubMed Central PMCID: PMCPMC5675884.
- Defante AP, Vreeland WN, Benkstein KD, et al. Using image attributes to assure accurate particle size and count using nanoparticle tracking analysis. J Pharm Sci. 2018 May;107(5):1383–1391. PubMed PMID: 29277640.
- ASTM E2834-12. Standard guide for measurement of particle size distribution of nanomaterials in suspension by nanoparticle tracking analysis (NTA). ASTM International. West Conshohocken, PA. 2012. Available from: www.astm.org
- Majka M, Durak-Kozica M, Kamińska A, et al. The effects of subdiffusion on the NTA size measurements of extracellular vesicles in biological samples. arXiv preprint arXiv:170109001. 2017.
- Mehdiani A, Maier A, Pinto A, et al. An innovative method for exosome quantification and size measurement. J Vis Exp. 2015 Jan 17;95:50974. PubMed PMID: 25650897; PubMed Central PMCID: PMCPMC4354536.
- Tong M, Brown OS, Stone PR, et al. Flow speed alters the apparent size and concentration of particles measured using NanoSight nanoparticle tracking analysis. Placenta. 2016 Feb;38:29–32. PubMed PMID: 26907379; eng.
- Vestad B, Llorente A, Neurauter A, et al. Size and concentration analyses of extracellular vesicles by nanoparticle tracking analysis: a variation study. J Extracell Vesicles. 2017;6(1):1344087. PubMed PMID: 28804597; PubMed Central PMCID: PMCPMC5533132.
- Varga Z, van der Pol E, Palmai M, et al. Hollow organosilica beads as reference particles for optical detection of extracellular vesicles. J Thromb Haemost. 2018 Jun 7. PubMed PMID: 29877049.
- Jensen OA, Prause JU, Laursen H Shrinkage in preparatory steps for SEM. A study on rabbit corneal endothelium Albrecht von Graefes Archiv fur klinische und experimentelle Ophthalmologie. Albrecht Von Graefes Arch Klin Exp Ophthalmol. 1981;215(4):233–242. PubMed PMID: 6164307; eng.
- Štěpka K, Maška M, Pálenik JJ, et al. TEM ExosomeAnalyzer: a computer-assisted software tool for quantitative evaluation of extracellular vesicles in transmission electron microscopy images AU - Kotrbová, Anna. J Extracell Vesicles. 2019;8(1):1560808.