
ABSTRACT
Extracellular vesicles (EVs) are a heterogeneous group of small secreted particles involved in intercellular communication and mediating a broad spectrum of biological functions. EVs cargo is composed of a large repertoire of molecules, including glycoconjugates. Herein, we report the first study on the impact of the isolation strategy on the EV populations’ glycosylation profile. The use of different state-of-the-art protocols, namely differential ultracentrifugation (UC), total exosome isolation (TEI), OptiPrepTM density gradient (ODG) and size exclusion chromatography (SEC) resulted in EV populations displaying different sets of glycoconjugates. The EV populations obtained by UC, ODG and SEC methods displayed similar protein and glycan profiles, whereas TEI methodology isolated the most distinct EV population. In addition, ODG and SEC isolation protocols provided an enhanced EV glycoproteins detection. Remarkably, proteins displaying the tumour-associated glycan sialyl-Tn (STn) were identified as packaged cargo into EVs independently of the isolation methodology. STn carrying EV samples isolated by UC, ODG and SEC presented a considerable set of cancer-related proteins that were not detected in EVs isolated by TEI. Our work demonstrates the impact of using different isolation methodologies in the populations of EVs that are obtained, with consequences in the glycosylation profile of the isolated population. Furthermore, our results highlight the importance of selecting adequate EV isolation protocols and cell culture conditions to determine the structural and functional complexity of the EV glycoconjugates.
Introduction
Extracellular vesicles (EVs) are cell-derived structures that emanate from practically all cell types, both in vivo and in vitro [Citation1]. After cell membrane release, EVs transporting specific cargo between cells, including cancer cells, contribute to horizontal reprogramming and functional re-education of recipient cells [Citation2,Citation3]. Three main classes of EVs have been widely described: exosomes, originating from the inward budding of endosomal membrane during maturation of multivesicular endosomes (ranging between 40 and 150 nm in size); microvesicles, which are shed from the plasma membrane (ranging between 50 and 2000 nm); and apoptotic-bodies, that are released upon fragmentation of cells undergoing apoptosis (ranging between 50 and 5000 nm) [Citation4]. Recently, a new and smaller cell-derived population called exomeres has been identified and fully characterized, with a smaller size of 35 nm in average [Citation5]. Up to this date, EVs are known to carry a broad repertoire of cargoes, including proteins (e.g. cytokines, membrane receptors, receptor ligands), nucleic acids (e.g. DNA, mRNA, long and short non-coding RNA), lipids and glycans [Citation1,Citation5–Citation7].
Glycosylation is the most abundant post-translational modification of proteins, and its functional roles provide the basis for several pathophysiological processes, revealing to be crucial in complex diseases, such as cancer. Tumour cells express a wide variety of glycosylation alterations, which interfere with key cancer cell processes and with the tumour microenvironment, contributing to cancer progression and patients’ poor prognosis [Citation8]. Particularly, the cancer-associated glycan sialyl-Tn (STn) has been shown to be highly related with tumour cell aggressive features, cancer metastasis and patients’ poor survival [Citation9–Citation14]. This truncated structure results from a deregulation of the O-glycosylation biosynthetic pathway, such as overexpression of ST6GalNAc1 enzyme [Citation15,Citation16] or loss of function of Cosmc chaperone [Citation17,Citation18]. STn is overexpressed in several cancer types [Citation16,Citation19–Citation23], although its detection is rare or absent in healthy adult tissue [Citation24–Citation26].
Despite the recent increase in the number of studies on EVs, the ones addressing the role of its glycosylation are scarce. Previous reports have described that glycoconjugates are important regulators of exosomes biogenesis [Citation27] as well as being critical players in the recognition and the uptake of exosomes by the recipient cells [Citation28–Citation33]. Moreover, it has been shown that N-glycosylation directs the sorting of glycoproteins into exosomes [Citation28]. Considering that cancer cells shed EVs displaying diverse glycosylation profiles [Citation5,Citation34], it is of great importance to characterize the EV glycan content and its functional implications in cancer. Previous studies demonstrated the impact of using different isolation methodologies in the yield and the purity of EVs from either cell culture supernatant or plasma samples with consequences in the further protein and/or RNA analyses [Citation35–Citation39]. Consequently, a strong effort has been done to standardize EV isolation protocols. Despite the recent evidences showing that glycans are critical players in EVs biology, to date, the effect of using different EV isolation methods for glycan analysis has never been reported.
In the present study, we assessed the impact on EVs glycosylation profile of different state-of-the-art isolation methodologies, namely differential ultracentrifugation (UC), total exosome isolation (TEI), OptiPrepTM density gradient (ODG) and size exclusion chromatography (SEC), as well as the implications of FBS in the cell culture medium on the downstream analysis (). The use of a genetically engineered gastric cancer cell line displaying truncated O-glycosylation allowed us to isolate EVs containing the tumour-associated glycan STn.
Figure 1. Schematic representation of the four methodologies applied for extracellular vesicles (EVs) isolation and further EV profiling and glycosylation characterization. EVs were isolated by ultracentrifugation (UC), total exosome isolation (TEI), OptiPrepTM density gradient (ODG) and size exclusion chromatography (SEC) methodologies. ODG and SEC were applied after UC washing step (EVs*). TEI solution was applied directly to the conditioned medium (without previous UC).
Methods
Cell lines and culture conditions
The human gastric cancer cell line MKN45 (Japanese Collection of Research Bioresources) and the previous established glycoengineered MKN45 [Citation40] were cultured in RPMI GlutaMAXTM, HEPES medium supplemented with 10% FBS and 1% penicillin-streptomycin (all from Invitrogen, Carlsbad, CA, USA) and maintained at 37ºC in an atmosphere of 5% CO2. EVs collection was performed after culturing cells for 48 h with medium without FBS or with medium supplemented with 10% of EVs-depleted FBS. The FBS was depleted of bovine EVs by ultracentrifugation at 100,000 g for 16 h [Citation41]. Cultured cells were routinely tested for mycoplasma contamination and cell line identity was confirmed by STR profiling.
Immunofluorescence
Cells were grown in Ibidi slides (Planegg, Germany) for 48 h using medium with and without FBS supplementation. Cells were fixed with 4% paraformaldehyde (Alfa Aesar, Haverhill, MA, USA) at RT for 20 min and permeabilized with 0.5% TritonTM X-100 (Sigma-Aldrich, Saint Louis, MO, USA) in PBS at 4ºC for 10 min. Double staining with STn (TKH2) [Citation26] and actin (I-19) (Santa Cruz Biotechnology, Dallas, TX, USA) was performed as follows. First, a blocking step with non-immune goat serum (Dako, Agilent, Santa Clara, CA, USA) diluted 1/5 in PBS 10% BSA was performed. Then, anti-STn antibody diluted 1/5 overnight at 4ºC and anti-mouse conjugated with Alexa Fluor® 488 diluted 1/500 in PBS, 5% BSA. Thereafter, antibody anti-actin diluted 1/150 in PBS containing 5% BSA, followed by anti-rabbit Alexa Fluor® 594 diluted 1/500 in PBS containing 5% BSA. Single immunofluorescence with the biotinylated L-PHA lectin (Vector Laboratories, Burlingame, CA, USA) was performed by blocking with PBS, 10% BSA, the lectin diluted 1/500 in PBS overnight at 4ºC and FITC-conjugated streptavidin diluted 1/1000 in PBS. DAPI was used for nuclear staining at RT for 10 min and slides were mounted in VectaShield (Vector Laboratories, Burlingame, CA, USA). All incubation steps were performed at RT for 1 h or otherwise specified. Images were acquired with a Confocal Leica TCS SP5 II (Leica Microsystems, Wetzlar, Germany) using Leica LAS AF software version 2.6.0.7266 (Leica Microsystems).
Viability assay
The effect on cell viability produced by FBS removal from the culture medium was determined by cell proliferation assay (CellTiter 96® AQueous One Solution Cell Proliferation Assay, Promega, Madison, WI, USA). We seeded 120,000 cells/mL of MKN45 and glycoengineered MKN45 cell lines in 96-well plates. After reaching 80% confluence, cells were PBS washed and cultured with medium supplemented with 10%, 5%, 1% and 0% FBS. Treatment with 1 mM H2O2 was performed as positive control of the assay, since H2O2 induces cell death. After 48 h, 20 µL of 3-(4,5-dimethylthiazol-2-yl)-5-(3-carboxymethoxyphenyl)-2-(4-sulfophenyl)-2H-tetrazolium (MTS) was added to the medium, incubated for 2 h and absorbance was read at 490 nm in an automated microplate reader (BioTek, Winooski, VT, USA). The quantity of MTS formazan product, measured by absorbance at 490 nm, is directly proportional to the number of living cells in culture. Two independent experiments with three replicates for each condition were performed.
Isolation of extracellular vesicles by ultracentrifugation
EVs were obtained by differential centrifugation by collecting the media, spin at 800 g for 5 min, followed by a centrifugation at 2,000 g for 10 min. The supernatant was filtered using a 0.22 µm constant pore filtration system (Corning, New York, NY, USA). Media was centrifuged for 16 h in a polyallomer centrifuge tube (Beckman Coulter, Fullerton, CA, USA) at 100,000 g and 4ºC in a swinging bucket rotor (Optima XPN-80, SW 55 Ti rotor, Beckman Coulter). A washing step with saline solution (0,9% of NaCl) was performed for 2 h at 100,000 g and 4ºC. Pellets were resuspended in saline solution.
Isolation of extracellular vesicles by total exosome isolationTM
TEI was performed according to the manufacturer´s instructions (Invitrogen). Briefly, media was collected and centrifuged at 2,000 g, 4ºC for 30 min. The supernatant was then filtered using 0.22 µm constant pore filtration system (Corning, New York, NY, USA). The supernatant was mixed with TEI solution (2:1) by vortexing and incubated overnight at 4ºC. EVs were spun down by centrifugation at 10,000 g and 4ºC for 1 h. The supernatant was discarded and the pellet resuspended in saline solution (0,9% of NaCl). According to the manufacturer, this method forces less soluble components, such as EVs, out of solution, by tying up water molecules.
Isolation of extracellular vesicles by OptiPrepTM density gradient
A discontinuous iodixanol gradient was prepared as described [Citation42]. Briefly, solutions of 5%, 10%, 20% and 40% iodixanol were made by mixing a homogenization buffer [0.25 M sucrose, 10 mM Tris-HCl, pH 7.5] and OptiPrepTM 60% (w/v) aqueous iodixanol solution. The gradient was formed by layering 3 mL of 40%, 3 mL of 20%, 3 mL of 10% and 2.5 mL of 5% solutions on top of each other in a 16.8 mL open top polyallomer tube (Beckman Coulter). After differential ultracentrifugation, the pellet obtained after the 2 h washing step was resuspended in 500 µL of saline solution (0,9% of NaCl) and overlaid on top of the gradient. An extra 5 mL of saline solution was added on top of the gradient to reach the volume required to fill the tubes. Tubes were centrifuged at 100,000 g and 4ºC for 16 h (SW 32.1 Ti rotor, Beckman Coulter). From the top to the bottom, the first 5 mL was collected as fraction 0 and the following 12 mL as independent fractions of 1 mL each. Fraction 0 was not analysed as it corresponds to the extra 5 mL of saline solution. Each of the 12 fractions were weight scaled for density assessment and syntenin-1 was used to evaluate the EVs presence (). These results were used to determine the density of fractions to be collected for EVs further analysis. Fractions containing the EVs were pooled together after the 16 h spin, diluted with 2 mL of saline solution and concentrated by ultrafiltration using 10K Amicon Ultra-15 centrifugal filter units (EMD Millipore, Burlington, MA, USA).
Figure 2. Representative example of the 12 fractions obtained by OptiPrepTM density gradient. Fractions were weight scaled for density evaluation and syntenin-1 expression was assessed. Fractions 6 and 7 showed a density of approximately 1.1 g/mL and the highest expression of syntenin-1 extracellular vesicle marker.
Isolation of extracellular vesicles by size exclusion chromatography
SEC was performed according to the manufacturer’s instructions of the qEV column (Izon, Christchurch, New Zealand). Briefly, after differential ultracentrifugation, the pellet obtained after the 2 h washing step was resuspended in 500 µL of saline solution (0,9% of NaCl) and overlaid on top of the qEV column. A total of 25 fractions of 500 µL were collected. Fractions from 6 to12 were collected, and the fractions 7 to 12 were pulled together. Samples were concentrated by ultrafiltration with 10K Amicon Ultra-15 centrifugal filter units (EMD Millipore).
Nanoparticle tracking analysis
Nanoparticle tracking analysis (NTA) was performed according to manufacturer’s instructions using a NanoSight NS300 system (Malvern Technologies, Malvern, UK) configured with a Blue 488 laser and a high sensitivity scientific sCMOS camera. For NTA analysis of the EVs, saline solution (0,9% of NaCl) was used as diluent, a syringe pump with constant flow injection was used and three videos of 60 s were captured with 749 frames and camera level at 13–16. The videos were recorded and analysed with NTA software version 2.3 to determine the size and concentration of the particles.
Negative-staining transmission electron microscopy
EVs size, morphology and integrity were visualized by transmission electron microscopy (TEM) using negative staining. For this, 10 µL of sample solution was mounted on Formvar/carbon film-coated mesh nickel grids (Electron Microscopy Sciences, Hatfield, PA, USA). The excess liquid was removed with filter paper, and 10 µL of 1% uranyl acetate was added onto the grids. Visualization was carried out on a JEOL JEM 1400 TEM at 120 kV (Tokyo, Japan). Images were digitally recorded using a CCD digital camera (Orious 1100W Tokyo, Japan).
Analysis of protein and glycan expression by western and lectin blotting
EV samples were resuspended in RIPA lysis buffer supplemented with 1 mM sodium orthovanadate, 1 mM PMSF and protease inhibitor cocktail (Roche, Basel, Switzerland) for 30 min on ice, followed by centrifugation at 16,000 g for 20 min. Silver staining was used to adjust protein amounts loaded per sample. SDS-PAGE of equal amounts of protein followed by electrophoretic transfer into nitrocellulose membranes (GE Healthcare, UK) was performed. Membranes were protein blocked and then incubated with the following antibodies: rabbit anti-CD9 (EXOAB-CD9A-1), rabbit anti-HSP70 (EXOAB-Hsp70A-1), rabbit anti-CD63 (EXOAB-CD63A-1), rabbit anti-CD81 (EXOAB-CD81A-1) (1/1000, all from ExoAb Antibody Kit, Systems Biosciences, Palo Alto, CA, USA), mouse anti-Alix (1A12), mouse anti-syntenin-1 (S-31) and mouse anti-cytochrome C (7H8) (1/200, all from Santa Cruz Biotechnology). For glycan detection, membranes were incubated with an anti-STn antibody (TKH2) [Citation26] and the following biotinylated lectins Aleuria aurantia lectin (AAL), Phaseolus vulgaris leucoagglutinin (L-PHA) and Phaseolus vulgaris erythroagglutinin (E-PHA) (all lectins were purchased from Vector Laboratories, Burlingame, CA, USA, and used at 1/2000 dilution and 1/1000 dilution for L-PHA). The corresponding HRP-conjugated secondary antibodies and the Vectastain Elite ABC HRP Kit (Vector Laboratories) were used for primary antibodies and lectins recognition, respectively. Chemiluminescence signal was obtained using ECL detection reagent (GE Healthcare Life Sciences). The total protein profile of the samples was assessed in parallel on a silver-stained gel. A control was performed by collecting the pellet obtained from cell culture medium supplemented with 10% FBS (EVs-depleted) and without cell contact. The glycan recognition of each lectin is as follows: AAL, Fucα6GlcNAc, Fucα3GlcNAc and Fucα2Gal; L-PHA, Galβ4GlcNAcβ6(Galβ4GlcNAcβ2)Manα6; E-PHA, Galβ4GlcNAcβ2Manα6(GlcNAcβ4)(Galβ4GlcNAcβ2Manα3)Manβ4. (Abbreviations: Fuc, fucose; GlcNAc, N-acetylglucosamine; Man, mannose; Gal, galactose; GalNAc, N-acetylgalactosamine).
Mass spectrometry for protein identification of silver-stained bands
After silver staining of equal amounts of protein lysate from EVs, representative bands were selected and excised from the gel and washed with 50% acetonitrile in 50 mM ammonium bicarbonate. Reduction and alkylation were sequentially performed with 25 mM DTT at 56ºC and 55 mM IAA at RT in the dark, both for 20 min. Proteins were digested with 20 ng of trypsin for 3 h at 37ºC in the presence of 0.01% surfactant (Promega). The resulting peptides were analysed on a MALDI mass spectrometer (4800 Plus MALDI TOF/TOF Analyzer, SCIEX) as described in [Citation43]. Proteins were identified by Peptide Mass Fingerprint using the Mascot software v2.6.1 (Matrix Science, London, UK). Protein searches were performed against the UniProt protein sequence database for the Homo sapiens and Bos taurus taxonomic selections (2017_11). The established search parameters were: maximum of two missed trypsin cleavages, cysteine carbamidomethylation (fixed modification) and methionine oxidation (variable modification). The peptide tolerance was 25 ppm.
Sample preparation for proteomic analysis
Equal amounts of EVs were digested in a lysis buffer containing 0.6% RapiGest, 1 mM sodium orthovanadate, 1 mM PMSF and protease inhibitor cocktail. The lysed material was left on ice for 30 min with occasional vortexing followed by centrifugation (16,000 g for 10 min and 4ºC). The cleared lysate was heated at 80°C, 10 min followed by reduction with 5mM DTT at 60°C, 30 min and alkylation with 10mM IAA at RT for 30 min before overnight digestion at 37°C with 5 µg trypsin (Roche). The RapiGest was quenched by adding 2 µL trifluoroacetic acid, 37°C, 20 min and cleared by centrifugation at 10,000 g, 10 min. The cleared acidified digests were purified by in-house packed Stage tips (Empore disk-C18, 3M).
Mass spectrometry for proteomic analysis
EASY-nLC 1000 UHPLC (Thermo Scientific) interfaced via nanoSpray Flex ion source to an Orbitrap Fusion/Lumos mass spectrometer (Thermo Scientific) was used for the proteomic study. A precursor MS1 scan (m/z 350–1,700) of intact peptides was acquired in the Orbitrap at a nominal resolution setting of 120,000. The 15 most abundant multiply charged precursor ions in the MS1 spectrum at a minimum MS1 signal threshold of 50,000 were triggered for sequential Orbitrap HCD-MS2 (m/z of 100–2,000). MS2 spectra were acquired at a resolution of 50,000. Activation time for HCD fragmentation was 30 min. Isolation width was 1.6 mass units, and 1 microscan was collected for each spectrum. Automatic gain control targets were 1,000,000 ions for Orbitrap MS1 and 100,000 for MS2 scans. Dynamic exclusion for 60 s was used to prevent repeated analysis of the same components. Polysiloxane ions at m/z 445.12,003 were used as a lock mass in all runs.
For the analysis, data processing was performed using Proteome Discoverer 2.2 software (Thermo Scientific) using Sequest HT Node. All spectra were initially searched with full cleavage specificity, filtered according to the confidence level (medium, low and unassigned) and further searched with the semi-specific enzymatic cleavage. In all cases, the precursor mass tolerance was set to 6 ppm and fragment ion mass tolerance to 20 mmu. Carbamidomethylation on cysteine residues was used as a fixed modification. Methionine oxidation was used as variable modifications. All spectra were searched against a concatenated forward/reverse human-specific database (UniProt, January 2013, containing 20,232 canonical entries and another 251 common contaminants) using a target false discovery rate (FDR) of 1%. FDR was calculated using target decoy PSM validator node. The resulting protein list was filtered to include only proteins identified by the minimum of two peptides. The identified list of proteins in each sample was used to plot a Venn diagram [Citation44]. Proteins highlighted in the Venn diagram were selected based on known relevance in human cancer or as EV markers. The proteins identified by MS were analysed using NetOGlyc 4.0 Server [Citation45] to predict the presence of O-glycosylation sites.
Statistical analysis
Mean comparison of the variables was performed using the SPSS statistical software for Windows (version 19; SPSS Inc., Chicago, IL, USA). After tested for normality and homoscedasticity using the Shapiro-Wilk and Levene’s tests, differences among the non-normally mean values were analysed by Kruskal-Wallis test. P > 0.05 was considered non-statistically significant.
EV-TRACK
We have submitted all relevant data of our experiments to the EV-TRACK knowledgebase (EV-TRACK ID: EV190018) [Citation46].
Results
MKN45 and glycoengineered MKN45 secrete extracellular vesicles with variable size depending on the EV isolation approach applied
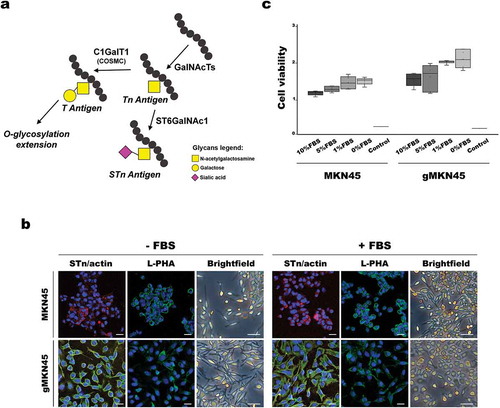
In this study, we used a genetically engineered gastric cancer cell line displaying simplified truncated homogeneous O-glycosylation, whereas the wild type cell line presents a heterogeneous glycosylation profile, due to O-glycosylation extension ()). Taking into consideration that FBS carries many glycosylated proteins, which could interfere with further EVs glycosylation analysis [Citation47], we have first evaluated the impact of FBS removal on the cell culture medium. We then analysed the cell glycosylation profile and the morphological features after 48 h without serum supplementation and compared with cells cultured with medium supplemented with 10% FBS. As expected, the gMKN45 showed homogeneous expression of the O-glycan truncated structure STn, and this expression was not altered by FBS depletion ()). In addition, no major changes in N-glycosylation were observed after FBS removal, as detected by L-PHA staining which recognizes branched N-glycans ()). Furthermore, no significant alterations in cell viability were observed when comparing cells grown in the presence or absence of FBS ()). However, the lack of FBS led to the acquisition of a more elongated cellular phenotype in both cell models, which was more marked in the gMKN45 ()).
Figure 3. Effects of FBS depletion in morphology and viability of MKN45 and glycoengineered MKN45 human gastric cancer cell lines. (a) Schematic depiction of STn biosynthesis. Increased expression of ST6GalNAc1 enzyme or mutations on COSMC gene preclude elongation of the O-glycosylation. (b) Cells grown in the absence (-FBS) or presence (+FBS) of FBS in the culture medium were fixated and stained with STn (green) and actin (red) antibodies and L-PHA (green) lectin. Nuclei were stained with DAPI (blue). Images were taken with a confocal microscope. Scale bar represents 10 µm. Brightfield pictures acquired in an inverted microscope show the differences in cell morphology. Scale bar represents 50 µm. (c) Comparison of viable cells in proliferation when subjected to culture medium supplemented with different percentages of FBS for 48 h. Boxplot represents the values corresponding to the absorbance at 490 nm corrected by the blank. Two independent experiments with triplicates were conducted. As positive control, 1 mM H2O2 was added to the cells. Statistical analysis was calculated with Kruskal-Wallis test: MKN45 p = 0.212 and gMKN45 p = 0.244; p-value > 0.05 was considered non-significant. Abbreviations: FBS: fetal bovine serum; L-PHA: Phaseolus vulgaris leucoagglutinin; STn: sialyl-Tn.
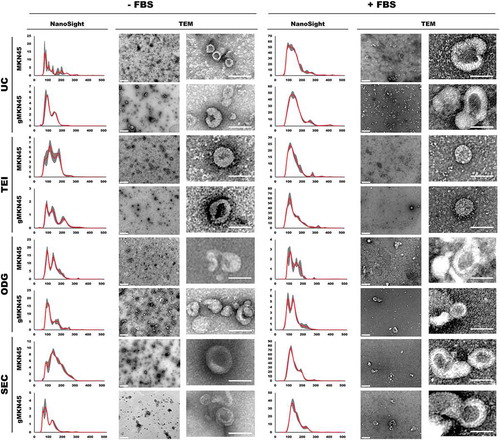
EVs isolation was performed using four different methodological approaches, namely UC, TEI, ODG and SEC, from both cell lines either in the presence or in the absence of FBS. EVs characterization by NTA and TEM revealed the size and concentration heterogeneity depending on the different isolation technique applied within each cell line ( and Supplementary Table 1). Although a trend towards less and smaller particles was observed in gMKN45 when compared to MKN45, UC, ODG and SEC methods resulted in similar particle concentration for the same cell line growing in the absence of FBS (Supplementary Table 1). The particle size and concentration assessed by NTA revealed that in the presence of FBS, EV samples obtained from MKN45 and gMKN45 were more alike when isolated by the same method. Noteworthy, TEI protocol resulted in comparable concentration of isolated particles as the other methods using less starting volume, especially in the presence of FBS ( and Supplementary Table 1). We cannot exclude that these results may reflect the presence of non-EV contaminants that co-precipitated when applying TEI methodology.
Figure 4. Characterization of extracellular vesicles isolated by differential ultracentrifugation (UC), total exosome isolation (TEI), OptiPrepTM density gradient (ODG) and size exclusion chromatography (SEC) methodologies using NTA analysis and transmission electron microscopy (TEM) imaging, including lower magnification (left) and zoomed in pictures (right). Extracellular vesicles were collected from MKN45 and glycoengineered MKN45 (gMKN45) cell lines cultured in the absence (-FBS) or presence (+FBS) of FBS in the cell culture medium. At least two independent experiments were conducted. NTA graphs display in y-axis: concentration (in 106 particles/mL) and in x-axis: size (nm). TEM images: Scale bar represents 400 nm (left TEM panel) and 100nm (right TEM panel), respectively.
Extracellular vesicles display different protein profile depending on the isolation methodology applied
EVs were successfully isolated from both MKN45 and gMKN45 cell lines using the four aforementioned methodologies. Silver staining was used for total protein profile analysis and as protein loading control (). The total protein profile of the two cell lines was similar whenever the same methodology and culture condition were applied. However, the different EV isolation methodologies affected the protein profile obtained for both cell lines. Moreover, the presence or the absence of FBS in the culture medium also showed to impact the total protein profiles for both MKN45 and gMKN45 cell lines. In particular, TEI led to the largest co-isolation of BSA and ODG to the least (). The band around 65 kDa was identified by MS as BSA (). Some additional contaminant bovine proteins were detected in the EV samples isolated from the cells cultured with medium supplemented with FBS (). In the EV samples collected from non-supplemented medium, common EV markers, such as syntenin-1 or CD9, were detected by MS (), and then validated by Western blot in both culture conditions (,)).
Figure 5. Identification by MS of representative proteins from lysates of extracellular vesicles. Silver staining of extracellular vesicle lysates obtained by different isolation methodologies from MKN45 (M) human gastric cancer cell line and glycoengineered MKN45 (gM) cultured 48 h with 1640 RPMI (-FBS) or with 1640 RPMI supplemented with 10% FBS (+FBS). The total cell lysates are also shown. *These bands were identified with a high number of candidate peptides without reaching statistical significance.
Figure 6. Protein profile of extracellular vesicles (EVs) isolated by differential ultracentrifugation (UC), total exosome isolation (TEI), OptiPrepTM density gradient (ODG) and size exclusion chromatography (SEC) from MKN45 (M) human gastric cancer cell line and glycoengineered MKN45 (gM) cells. (a) Western blotting of HSP70, syntenin-1, CD9, CD63, Alix and CD81 extracellular vesicle markers and cytochrome C mitochondria marker performed on total cell lysates and EV lysates in non-FBS supplemented medium or (b) cells cultured with medium supplemented with 10% FBS. At least two independent experiments were conducted. (c) Western blotting of syntenin-1, CD9 and CD63 EV markers on total cell lysates and EV lysates in non-FBS supplemented medium. EV samples were isolated by UC or ODG followed by TEI.
The common EV markers heat shock protein 70 (HSP70) and syntenin-1 were detected in all populations of secreted vesicles, independently on the methodology applied (,)). All samples also showed the absence of the cell organelle-specific marker cytochrome C (,)). Depending on the isolation methodology applied, differences in the EV markers were detected. The UC, ODG and SEC protocols isolated EV populations carrying HSP70, syntenin-1, CD9, CD83, Alix and CD81 markers independently of the culture condition; however, CD9, Alix and CD81 were differentially expressed in MKN45 and gMKN45 cell lines (,)). CD9 protein was not detected by western blotting in the EVs isolated by TEI protocol independently of the cell line or the culture condition used as well as for CD63 and CD81 when EVs were isolated in the absence of FBS (,)). We performed TEI either after UC or ODG, and our results showed that TEI was able to isolate EVs positive for CD63 and CD9 only if the samples were previously submitted to UC or ODG ()). Altogether, TEI seems to have a weak selectivity in precipitating EVs, being the enrichment strongly influenced by the complexity of the sample. Therefore, when applied directly to cell culture medium TEI co-precipitates additional non-EV proteins, precluding the detection by western blotting of EV markers, such as the tetraspanins CD9, CD63 or CD81 (,)). The different protein cargo isolated by TEI is also demonstrated by the specific protein profile observed by silver staining (). Overall, different isolation methods resulted in EV subpopulations carrying different proteins.
Distinct extracellular vesicle glycosylation profiles are obtained depending on the isolation technique applied
A panel of glycan recognizing lectins and a specific antibody for the STn glycan structure were used to analyse the glyco-cargo of the EVs obtained by applying different isolation techniques.
The cancer-associated STn simple O-glycan, as expected, showed to be expressed in the total extract of the gMKN45 cell line and absent in the MKN45 parental cells ()) [Citation40,Citation45]. Remarkably, this modification on the cells had an impact on the isolated EVs. STn antigen showed to be highly present in the glycoproteins carried by the EVs isolated from the gMKN45 cells, and being absent in the EV glycoproteins derived from the MKN45 parental cell line. Furthermore, a high molecular weight set of STn carrying glycoproteins were preferentially packaged into EVs when compared with the whole gMKN45 cellular lysate ()). Moreover, strong differences were observed in the STn positive proteins enriched in the gMKN45 EVs depending on the applied methodology. In particular, TEI protocol resulted in the most distinct STn staining profile, with very low levels of STn detected in the EVs isolated by TEI from cells cultured in the presence of FBS ()).
Figure 7. Glycan detection of extracellular vesicles obtained by differential ultracentrifugation (UC), total exosome isolation (TEI), OptiPrepTM density gradient (ODG) and size exclusion chromatography (SEC) in the absence (-FBS) or presence (+FBS) of FBS in the culture medium. Western blotting of total cell lysates and extracellular vesicle lysates secreted by MKN45 (M) human gastric cancer cell line and glycoengineered MKN45 (gM) using (a) an anti-STn antibody (red dots indicate high molecular weight glycoproteins displaying STn) and the different lectins (b) E-PHA, (c) L-PHA and (d) AAL. Glycan epitopes recognized by the lectins and the antibody used are depicted (left panel). At least two independent experiments were conducted. The right panel shows the control condition performed with total cell lysates and the pellet obtained after UC of medium supplemented with 10% FBS and without cell contact. Abbreviations: STn: sialyl-Tn; AAL: Aleuria aurantia lectin; E-PHA: Phaseolus vulgaris erythroagglutinin; L-PHA: Phaseolus vulgaris leucoagglutinin.
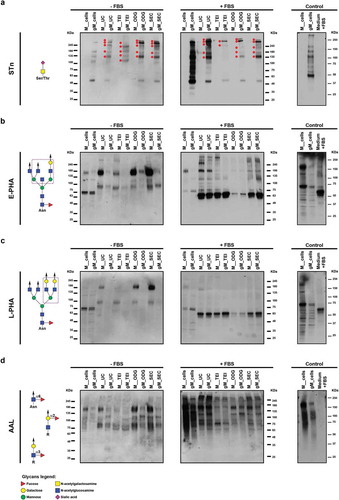
Similar to what we observed regarding the protein content, the presence or the absence of FBS in the culture medium also showed to affect the detection of glycosylated proteins for both MKN45 and gMKN45 cell lines. In order to assess these glycosylation changes in the EV profile, three lectins detecting cancer relevant N-glycans (E-PHA and L-PHA) and fucosylated structures (AAL) were used. These lectins have been recently used to disclose glycosylation profiles in different EV populations [Citation5]. The EVs collected from MKN45 using non-FBS supplemented medium displayed high molecular weight glycoproteins exhibiting different degree of reactivity to the E-PHA and L-PHA lectins, responsible for the detection of bisected and branched N-glycans, respectively (,)). Although to a lesser extent, these glycosylation patterns were also detected in glycoproteins from EVs derived from gMKN45 regarding E-PHA, but very faint reactivity for L-PHA. Different bisected N-glycoproteins were also detected by lectin affinity in the EVs isolated in the presence of FBS. Regarding branched N-glycans, detected with L-PHA, it was possible to identify high molecular weight glycoproteins displaying these glycans in EVs from MKN45 cells, which were not visible in the EVs collected from the gMKN45 cells. When the cells were cultured in the presence of FBS, a major reactive band around 65 kDa precluded the detection of less abundant proteins (,)). The reactivity of the lectins E-PHA and L-PHA to this major band is likely to result from non-specific lectin binding to BSA. Supporting this, when UC was applied to medium containing EV-depleted FBS but without any cell contact, a major band of approximately 65 kDa was also detected by E-PHA and L-PHA lectins. Remarkably, no unspecific STn or fucosylation (AAL) detection was observed (, right panel).
Regarding AAL lectin reactivity, our results demonstrated that the different isolation protocols enriched different EV subpopulations, both in MKN45 and gMKN45 cell lines. This effect was observed in the isolated EVs independently of the cell culture conditions ()).
Altogether, the UC, ODG and SEC methods resulted in a similar EVs glycoprofile, illustrated by the STn and lectin staining (). Nevertheless, the signal detection in the blots was increased in the EVs isolated using the ODG and SEC protocols. On the other hand, the ODG approach resulted in the isolation of EVs with less contaminants from the FBS of the medium, as observed by the lower reactivity at the BSA molecular weight ( and ). The TEI protocol showed to be the least efficient to enrich in EV glycoproteins, as evidenced by the lectin staining (–)). All the tested methodologies were able to isolate, although to a different extent, glycosylated EVs from cancer cells including glycoproteins bearing both N-glycans and simple truncated O-glycans.
Different isolation methodologies result in distinct proteomes of sialyl-Tn expressing extracellular vesicles
The proteomic evaluation of the EVs from gMKN45 cells revealed that protein cargo varies according to the EV isolation protocol applied ( and Supplementary Table 2).
Figure 8. Representation of the proteins identified from extracellular vesicles (EVs) isolated by differential ultracentrifugation (UC), total exosome isolation (TEI), OptiPrepTM density gradient (ODG) and size exclusion chromatography (SEC) methodologies from glycoengineered MKN45 cells grown in the absence of FBS. Venn diagram demonstrates the number (and percentage) of unique and overlapping proteins identified by proteomic analysis for each EV isolation methodology. One experiment was conducted. Boxes highlight key cancer-related proteins (framed in full line) or EV markers (framed in dotted line) identified in the EV samples.
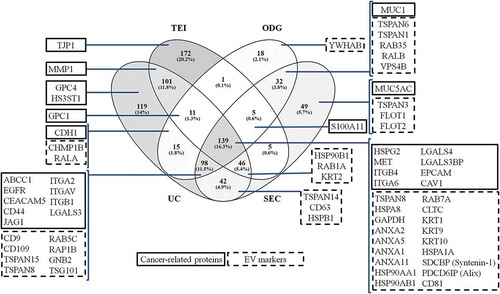
The proteomic analysis identified a total of 853 proteins whereas 139 proteins (16.3%) were present in all EV samples independently of the isolation methodology applied. This overlapping cargo included several human cancer-related proteins and EV markers. In addition, a large number of proteins (n = 98; 11.5%) was identified in EV samples obtained by UC, ODG and SEC. The EV protein content obtained by these three methods (UC, ODG and SEC) contained important cancer-related proteins as well as known EV markers that TEI failed to isolate. Importantly, additional EV markers were enriched in the samples isolated by both ODG and SEC. Although all protocols isolated EVs, each one enriched a unique set of proteins. A large number of proteins was only detected in TEI (n = 172; 20.2%) and UC (n = 119; 14%) EV samples ().
Further bioinformatic analysis using NetOGlyc 4.0 server showed that more than 80% of the identified EV proteins are putatively O-glycosylated (Supplementary Table 2). Interestingly, several glycoproteins previously identified as carrying Tn/STn in the gMKN45 cells, such as PDCD6I (Alix), LGALS3BP, GPC1, GPC4, CDH1, CD44, ITGB1, MUC5AC and MET [Citation40], were also detected in gMKN45 secreted EVs ().
Discussion
Glycosylation has proven to be crucial in a wide variety of cancer cell processes, including tumour angiogenesis, immune response modulation, interaction with tumour microenvironment and metastasis formation [Citation8]. Therefore, variations of the cellular surface glycans have significant structural and functional consequences for cancer cells, influencing the progression of the disease and impacting patients’ prognosis [Citation8]. Previous studies have demonstrated that EVs play major roles in the horizontal transfer of material from donor to recipient cells, thereby acting as important intercellular communication tools in physiological and pathological settings [Citation1,Citation2,Citation48]. Furthermore, EVs have been shown to be key players in the modulation and establishment of the pre-metastatic niche, responsible for cancer progression and metastasis [Citation49–Citation51]. Accordingly, EVs displaying different ‘glycan coats’ hold the potential to differently interplay with other cells within the tumour microenvironment as well as at distant sites [Citation52].
Despite the relevance of improving the knowledge regarding the functional diversity of distinct EV subtypes [Citation53], previous studies evaluating the impact of each EV isolation protocol, including the measurement of the isolation efficiency and the yield, have been mainly limited to the analysis of proteins, lipids and nucleic acids (reviewed in [Citation54]). To the best of our knowledge, the impact of the isolation methodology on the EV glycosylation profile has never been reported.
In the present study, we took advantage of a unique glycoengineered cancer cell model with previously fully characterized O-glycoproteome, displaying homogenous truncated O-glycosylation with expression of the tumour-associated Tn and STn O-glycan structures [Citation40,Citation55]. The analysis of the EVs secreted by this cell model in comparison with the EVs produced by the parental cell line allowed an accurate evaluation of how the different isolation methods affect the enrichment of differently glycosylated EV subpopulations. This cell model proved to be of great importance since we were able to demonstrate that the STn glycan, which is a tumour-specific antigen associated with cancer cell aggressiveness features and patients’ poor prognosis [Citation13,Citation56], is present in the secreted EVs.
In addition to the evaluation of the impact that different state-of-the-art methods for EVs isolation have in the EV populations’ glycosylation profile, this study has addressed how differences on cell culture conditions, namely serum supplementation of the medium, affect the purity of the isolated EVs.
When collecting EVs, it is important to use culture medium supplemented with the minimum concentration of serum since proteins, such as BSA, can non-specifically bind to the EVs membranes and be co-purified [Citation41,Citation57]. Several bovine proteins were identified in the EV samples isolated from cells growing in medium supplemented with FBS. In particular, TEI led to the largest co-isolation of BSA and ODG to the least. In this regard, the FBS removal has been previously described as a crucial step for EVs content analysis by mass spectrometry [Citation58]. However, some cell lines are sensitive to the complete removal of serum for their viable growth. In our study, we show that 48 h of serum deprivation did not cause significant alterations in cell viability. Considering the abundance of glycosylated proteins in the FBS that could interfere with the downstream EV glycosylation analysis, we performed all the experiments in parallel without FBS-supplemented medium. Our results are in agreement with previous reports that disclosed FBS as a major component when isolating EVs from medium containing FBS, which interferes with the further study of specific features of the cancer cell-derived EVs [Citation59]. In our present study, EVs were isolated through long centrifugation protocols and therefore we cannot exclude that shorter centrifugation times could reduce the presence of FBS soluble contaminants in the isolated EV samples. Furthermore, we observed that for the same amount of protein, a distinct EV protein profile could be better discriminated when cells were grown in the absence of FBS in the culture medium.
Previous studies have demonstrated that the selected isolation method influences the yield and the functional characteristics of the EV samples obtained [Citation60]. Our evaluation by TEM imaging and NTA analysis revealed that UC, TEI, ODG and SEC isolate heterogeneous EV populations in agreement with previous reports [Citation35,Citation38,Citation42].
Furthermore, each applied protocol was able to isolate EVs with distinct protein contents, as demonstrated by the general protein profile and validated by the global proteomic analysis as well as by specific EV markers. In this study, following the recommendations of the Society for Extracellular Vesicles, the characterization of the different EV-enriched samples included transmembrane proteins (CD9, CD63 and CD81), the cytoplasmic HSP70 and Alix proteins, and a cytosolic protein with membrane binding capacity (syntenin-1), as well as negative staining for an intracellular marker (cytochrome C) [Citation57]. The purification methods ODG and SEC isolated the most similar EV populations. In contrast, the least labour-intensive protocol TEI resulted in the most distinct EVs. The absence/low expression of CD9 in the TEI sample that we observed is in accordance with previous reports [Citation61]. Interestingly, when TEI was applied to previously UC or ODG isolated EVs, it isolated EVs with comparable EV markers detection as UC or ODG isolated samples. However, when TEI was directly applied to conditioned media co-precipitated soluble proteins together with EVs, precluding the detection of some EV markers. These results highlight the importance of a detailed characterization of the EV populations isolated applying different techniques.
EV glycosylation analysis is a very challenging and a recent emerging field of research [Citation5,Citation6]. There are still few approaches for glycoconjugate content analysis, which are particularly relevant for the biogenesis, secretion and uptake of the EVs [Citation27–Citation33]. Different approaches using lectins are being developed to selectively enrich in EV subpopulations with specific glycan content [Citation62]. The present work evidences the relevance of the methodology applied towards a biased-enrichment in the assortment of glycosylated EV populations. Overall, the tested protocols, UC, TEI, ODG and SEC were successful in isolating EVs carrying glycoproteins bearing N-linked and truncated O-linked glycans, although leading to the enrichment of different EV subpopulations. ODG and SEC protocols add a purification step to the UC isolation, which resulted in an improved detection of the EVs glycosylation. TEI methodology enriched in EV populations carrying less detectable glycoproteins. Remarkably, changing the glycosylation of the MKN45 cells towards the expression of the cancer-associated STn glycan, also impacted the glycosylation of the isolated EVs. The evaluation of other glycosylation determinants, such as bisected and branched N-glycans, detected by E-PHA and L-PHA, as well as fucosylation detected by AAL, further indicated differences in the enriched EVs glycoprofile depending on the method applied for isolation. These results further support the previously known cargo specificity characteristics of EVs. Previous reports demonstrated that specific glycosylation signatures were detected in EVs, including large and small exosomes, relative to plasma membrane or microsomal glycoproteins [Citation63,Citation64], as well as in the recently described exomere subpopulation [Citation5]. The cellular synthesis of STn has been shown to promote an aggressive malignant phenotype and is often associated with poor prognosis of gastric cancer patients [Citation14]. Interestingly, the EVs derived from the gMKN45 were enriched on specific high molecular weight glycoproteins carrying the STn antigen, when compared with the whole gMKN45 cellular lysate. Moreover, our proteomic results showed that EVs displaying STn carried several cancer-related proteins. More than 80% of the identified proteins were predicted to be O-glycosylated. Furthermore, proteins previously demonstrated to display STn in the gMKN45 cells [Citation40] were detected in the EV samples. Noteworthy, a considerable set of cancer-related proteins and EV markers were identified by UC, ODG and SEC which were not detected in the TEI isolated sample. This observation is in agreement with the distinct STn profile of the TEI sample, supporting different STn carriers. The large number of proteins exclusively identified in TEI may reflect the co-isolation of non-EV proteins. Moreover, the identification of additional EV markers in the samples isolated by ODG and SEC reflected a more pure EV population, highlighting the positive impact of ODG and SEC purification steps after UC. Therefore, a thorough EV purification strategy, such as UC followed by ODG or SEC, is required for EV glycosylated biomarkers discovery.
The potential applications of the EVs in the clinical setting have been proposed, mostly due to their promising utility in the diagnosis and prognosis of several diseases [Citation65,Citation66]. Furthermore, the secretion of EVs with defined glycan profile into body fluids makes them a valuable source of biomarkers for non-invasive diagnosis. Nevertheless, prior to this implementation, the isolation methods need to be standardized.
In conclusion, the analysis of the glycosylation pattern of the proteins carried by EVs isolated from cancer cells uncovered that the different isolation approaches result in different EV subpopulations. UC, ODG and SEC methods isolated EVs with similar protein and glycan contents, allowing the detection of the tumour-associated glycan antigen STn. The TEI technique enriched the most different EV population and presented the higher content of non-EV co-purified proteins. Given the importance that EVs have in transporting specific cargo between cells, including cancer cells, and the recognized role of glycans in tumour progression, it is of major interest that future studies take into account the populations of EVs displaying diverse glycosylation profiles when addressing the roles and functional diversity of these particles.
Author contributions
DF, AM and CAR conceived the hypothesis. DF, MB, AM, CAR designed the experimental approach. DF, MB, JP and AM performed the experiments. DF, MB, JP, HO, SYV, AM and CAR analysed the data. DC contributed to the glycoengineered cell line model. HO, AK and SYV performed the mass spectrometry and proteomic analyses. DF, MB, AM and CAR wrote the manuscript. All authors read, reviewed and approved the final manuscript.
Competing interests
The authors declare no competing financial interests.
Supplemental Material
Download Zip (67 KB)Acknowledgments
The authors would like to thank Rui Fernandes and Franscisco Figueiredo (HEMS, i3S Scientific platform) for transmission electron microscopy analysis, Sónia Melo and Cecília Durães (Genetic Dynamics of Cancer Cells, i3S) for the Nanoparticle Tracking Analysis support and discussions, and Ciro Miranda for bioinformatic analysis. The authors acknowledge María G. Lázaro and the support of the Bioimaging/i3S, member of the PPBI (PPBI-POCI-01-0145-FEDER-022122) for confocal microscopy.
Disclosure statement
No potential conflict of interest was reported by the author(s).
Supplementary material
Supplemental data for this article can be accessed here.
Additional information
Funding
Related Research Data
References
- van Niel G, D’Angelo G, Raposo G. Shedding light on the cell biology of extracellular vesicles. Nat Rev Mol Cell Biol. 2018;19(4):213–17.
- Rak J, Guha A. Extracellular vesicles–vehicles that spread cancer genes. Bioessays. 2012;34(6):489–497.
- Tkach M, Thery C. Communication by extracellular vesicles: where we are and where we need to go. Cell. 2016;164(6):1226–1232.
- Vader P, Breakefield XO, Wood MJ. Extracellular vesicles: emerging targets for cancer therapy. Trends Mol Med. 2014;20(7):385–393.
- Zhang H, Freitas D, Kim HS, et al. Identification of distinct nanoparticles and subsets of extracellular vesicles by asymmetric flow field-flow fractionation. Nat Cell Biol. 2018;20(3):332–343.
- Williams C, Royo F, Aizpurua-Olaizola O, et al. Glycosylation of extracellular vesicles: current knowledge, tools and clinical perspectives. J Extracell Vesicles. 2018;7(1):1442985.
- Lin J, Li J, Huang B, et al. Exosomes: novel biomarkers for clinical diagnosis. ScientificWorldJournal. 2015;2015:657086.
- Pinho SS, Reis CA. Glycosylation in cancer: mechanisms and clinical implications. Nat Rev Cancer. 2015;15(9):540–555.
- Chugh S, Barkeer S, Rachagani S, et al. Disruption of C1galt1 gene promotes development and metastasis of pancreatic adenocarcinomas in mice. Gastroenterology. 2018;155(5):1608–1624.
- Ozaki H, Matsuzaki H, Ando H, et al. Enhancement of metastatic ability by ectopic expression of ST6GalNAcI on a gastric cancer cell line in a mouse model. Clin Exp Metastasis. 2012;29(3):229–238.
- Nakagoe T, Sawai T, Tsuji T, et al. Pre-operative serum levels of sialyl Tn antigen predict liver metastasis and poor prognosis in patients with gastric cancer. Eur J Surg Oncol. 2001;27(8):731–739.
- David L, Carneiro F, Sobrinho-Simoes M. Sialosyl Tn antigen expression is associated with the prognosis of patients with advanced gastric cancer. Cancer. 1996;78(1):177–178.
- Victorzon M, Nordling S, Nilsson O, et al. Sialyl Tn antigen is an independent predictor of outcome in patients with gastric cancer. Int J Cancer. 1996;65(3):295–300.
- Freitas D, Campos D, Gomes J, et al. O-glycans truncation modulates gastric cancer cell signaling and transcription leading to a more aggressive phenotype. EBioMedicine. 2019;40:349–362.
- Marcos NT, Pinho S, Grandela C, et al. Role of the human ST6GalNAc-I and ST6GalNAc-II in the synthesis of the cancer-associated sialyl-Tn antigen. Cancer Res. 2004;64(19):7050–7057.
- Marcos NT, Bennett EP, Gomes J, et al. ST6GalNAc-I controls expression of sialyl-Tn antigen in gastrointestinal tissues. Front Biosci (Elite Ed). 2011;3:1443–1455.
- Ju T, Lanneau GS, Gautam T, et al. Human tumor antigens Tn and sialyl Tn arise from mutations in Cosmc. Cancer Res. 2008;68(6):1636–1646.
- Radhakrishnan P, Dabelsteen S, Madsen FB, et al. Immature truncated O-glycophenotype of cancer directly induces oncogenic features. Proc Natl Acad Sci U S A. 2014;111(39):E4066–75.
- Baldus SE, Hanisch FG. Biochemistry and pathological importance of mucin-associated antigens in gastrointestinal neoplasia. Adv Cancer Res. 2000;79:201–248.
- Werther JL, Rivera-MacMurray S, Bruckner H, et al. Mucin-associated sialosyl-Tn antigen expression in gastric cancer correlates with an adverse outcome. Br J Cancer. 1994;69(3):613–616.
- Itzkowitz S, Kjeldsen T, Friera A, et al.. Expression of Tn, sialosyl Tn, and T antigens in human pancreas. Gastroenterology. 1991;100(6):1691–1700.
- Inoue M, Ton SM, Ogawa H, et al. Expression of Tn and sialyl-Tn antigens in tumor tissues of the ovary. Am J Clin Pathol. 1991;96(6):711–716.
- Itzkowitz SH, Yuan M, Montgomery CK, et al. Expression of Tn, sialosyl-Tn, and T antigens in human colon cancer. Cancer Res. 1989;49(1):197–204.
- Yonezawa S, Tachikawa T, Shin S, et al. Sialosyl-Tn antigen. Am J Clin Pathol. 1992;98(2):167–174.
- Julien S, Picco G, Sewell R, et al. Sialyl-Tn vaccine induces antibody-mediated tumour protection in a relevant murine model. Br J Cancer. 2009;100(11):1746–1754.
- Kjeldsen T, Clausen H, Hirohashi S, et al. Preparation and characterization of monoclonal antibodies directed to the tumor-associated O-linked sialosyl-2—-6 alpha-N-acetylgalactosaminyl (sialosyl-Tn) epitope. Cancer Res. 1988;48(8):2214–2220.
- Baietti MF, Zhang Z, Mortier E, et al. Syndecan-syntenin-ALIX regulates the biogenesis of exosomes. Nat Cell Biol. 2012;14(7):677–685.
- Liang Y, Eng WS, Colquhoun DR, et al. Complex N-linked glycans serve as a determinant for exosome/microvesicle cargo recruitment. J Biol Chem. 2014;289(47):32526–32537.
- Saunderson SC, Dunn AC, Crocker PR, et al. CD169 mediates the capture of exosomes in spleen and lymph node. Blood. 2014;123(2):208–216.
- Hao S, Bai O, Li F, et al. Mature dendritic cells pulsed with exosomes stimulate efficient cytotoxic T-lymphocyte responses and antitumour immunity. Immunology. 2007;120(1):90–102.
- Christianson HC, Svensson KJ, van Kuppevelt TH, et al. Cancer cell exosomes depend on cell-surface heparan sulfate proteoglycans for their internalization and functional activity. Proc Natl Acad Sci U S A. 2013;110(43):17380–17385.
- Purushothaman A, Bandari SK, Liu J, et al. Fibronectin on the surface of myeloma cell-derived exosomes mediates exosome-cell interactions. J Biol Chem. 2016;291(4):1652–1663.
- Menard JA, Cerezo-Magana M, Belting M. Functional role of extracellular vesicles and lipoproteins in the tumour microenvironment. Philos Trans R Soc Lond B Biol Sci. 2018;373:1737.
- Gerlach JQ, Griffin MD. Getting to know the extracellular vesicle glycome. Mol Biosyst. 2016;12(4):1071–1081.
- Van Deun J, Mestdagh P, Sormunen R, et al. The impact of disparate isolation methods for extracellular vesicles on downstream RNA profiling. J Extracell Vesicles. 2014;3:10.3402/jev.v3.24858.
- Lobb RJ, Becker M, Wen SW, et al. Optimized exosome isolation protocol for cell culture supernatant and human plasma. J Extracell Vesicles. 2015;4:27031.
- Witwer KW, Buzas EI, Bemis LT, et al. Standardization of sample collection, isolation and analysis methods in extracellular vesicle research. J Extracell Vesicles. 2013;2.
- Taylor DD, Shah S. Methods of isolating extracellular vesicles impact down-stream analyses of their cargoes. Methods. 2015;87:3–10.
- Kowal J, Arras G, Colombo M, et al. Proteomic comparison defines novel markers to characterize heterogeneous populations of extracellular vesicle subtypes. Proc Natl Acad Sci U S A. 2016;113(8):E968–77.
- Campos D, Freitas D, Gomes J, et al. Probing the O-glycoproteome of gastric cancer cell lines for biomarker discovery. Mol Cell Proteomics. 2015;14(6):1616–1629.
- Thery C, Amigorena S, Raposo G, et al. Isolation and characterization of exosomes from cell culture supernatants and biological fluids. Curr Protoc Cell Biol 2006;30:3.22.1-3.22.29. Chapter 3:Unit 3 22.
- Tauro BJ, Greening DW, Mathias RA, et al. Comparison of ultracentrifugation, density gradient separation, and immunoaffinity capture methods for isolating human colon cancer cell line LIM1863-derived exosomes. Methods. 2012;56(2):293–304.
- Gomes C, Almeida A, Ferreira JA, et al. Glycoproteomic analysis of serum from patients with gastric precancerous lesions. J Proteome Res. 2013;12(3):1454–1466.
- Oliveros JC. Venny. An interactive tool for comparing lists with Venn’s diagrams. 2007–2015. http://bioinfogpcnbcsices/tools/venny/indexhtml
- Steentoft C, Vakhrushev SY, Joshi HJ, et al. Precision mapping of the human O-GalNAc glycoproteome through SimpleCell technology. Embo J. 2013;32(10):1478–1488.
- Consortium E-T, Van Deun J, Mestdagh P, et al. EV-TRACK: transparent reporting and centralizing knowledge in extracellular vesicle research. Nat Methods. 2017;14(3):228–232.
- Rosa-Fernandes L, Rocha VB, Carregari VC, et al. A perspective on extracellular vesicles proteomics. Front Chem. 2017;5:102.
- Becker A, Thakur BK, Weiss JM, et al. Extracellular vesicles in cancer: cell-to-cell mediators of metastasis. Cancer Cell. 2016;30(6):836–848.
- Costa-Silva B, Aiello NM, Ocean AJ, et al. Pancreatic cancer exosomes initiate pre-metastatic niche formation in the liver. Nat Cell Biol. 2015;17(6):816–826.
- Hoshino A, Costa-Silva B, Shen TL, et al. Tumour exosome integrins determine organotropic metastasis. Nature. 2015;527(7578):329–335.
- Peinado H, Zhang H, Matei IR, et al. Pre-metastatic niches: organ-specific homes for metastases. Nat Rev Cancer. 2017;17(5):302–317.
- Costa J. Glycoconjugates from extracellular vesicles: structures, functions and emerging potential as cancer biomarkers. Biochim Biophys Acta. 2017;1868(1):157–166.
- Tkach M, Kowal J, Thery C. Why the need and how to approach the functional diversity of extracellular vesicles. Philos Trans R Soc Lond B Biol Sci. 2018;373:1737.
- Konoshenko MY, Lekchnov EA, Vlassov AV, et al. Isolation of extracellular vesicles: general methodologies and latest trends. Biomed Res Int. 2018;2018:8545347.
- Campos D, Freitas D, Gomes J, et al. Glycoengineered cell models for the characterization of cancer O-glycoproteome: an innovative strategy for biomarker discovery. Expert Rev Proteomics. 2015;12(4):337–342.
- Pinho S, Marcos NT, Ferreira B, et al. Biological significance of cancer-associated sialyl-Tn antigen: modulation of malignant phenotype in gastric carcinoma cells. Cancer Lett. 2007;249(2):157–170.
- Lotvall J, Hill AF, Hochberg F, et al. Minimal experimental requirements for definition of extracellular vesicles and their functions: a position statement from the international society for extracellular vesicles. J Extracell Vesicles. 2014;3:26913.
- Sinha A, Alfaro J, Kislinger T. Characterization of protein content present in exosomes isolated from conditioned media and urine. Curr Protoc Protein Sci. 2017;87:24.9.1‐ 24.9.12.
- Stolk M, Seifert M. Protein contaminations impact quantification and functional analysis of extracellular vesicle preparations from mesenchymal stromal cells. J Stem Cells Regen Med. 2015;11(2):44–47.
- Gudbergsson JM, Johnsen KB, Skov MN, et al. Systematic review of factors influencing extracellular vesicle yield from cell cultures. Cytotechnology. 2016;68(4):579–592.
- Royo F, Zuniga-Garcia P, Sanchez-Mosquera P, et al. Different EV enrichment methods suitable for clinical settings yield different subpopulations of urinary extracellular vesicles from human samples. J Extracell Vesicles. 2016;5:29497.
- Gerlach JQ, Maguire CM, Kruger A, et al. Urinary nanovesicles captured by lectins or antibodies demonstrate variations in size and surface glycosylation profile. Nanomedicine (Lond). 2017;12(11):1217–1229.
- Escrevente C, Grammel N, Kandzia S, et al. Sialoglycoproteins and N-glycans from secreted exosomes of ovarian carcinoma cells. PLoS One. 2013;8(10):e78631.
- Escrevente C, Keller S, Altevogt P, et al. Interaction and uptake of exosomes by ovarian cancer cells. BMC Cancer. 2011;11:108.
- Malloci M, Perdomo L, Veerasamy M, et al. Extracellular vesicles: mechanisms in human health and disease. Antioxid Redox Signal. 2019;30(6):813–856.
- Katsuda T, Kosaka N, Ochiya T. The roles of extracellular vesicles in cancer biology: toward the development of novel cancer biomarkers. Proteomics. 2014;14(4–5):412–425.