
ABSTRACT
Long interspersed element-1 (LINE-1 or L1) retrotransposons replicate through a copy-and-paste mechanism using an RNA intermediate. However, little is known about the physical transmission of retrotransposon RNA between cells. To examine the horizontal transfer of an active human L1 retrotransposon mediated by extracellular vesicles (EVs), human cancer cells were transfected with an expression construct containing a retrotransposition-competent human L1 tagged with a reporter gene. Using this model, active retrotransposition events were detected by screening for the expression of the reporter gene inserted into the host genome by retrotransposition. EVs including exosomes and microvesicles were isolated from cells by differential centrifugation. The enrichment of L1-derived reporter RNA transcripts were detected in EVs isolated from cells expressing active L1 retrotransposition. The delivery of reporter RNA was confirmed in recipient cells, and reporter genes were detected in the genome of recipient cells. Additionally, employing qRT-PCR, we found that host-encoded factors are activated in response to increased exposure to L1-derived RNA transcripts in recipient cells. Our results suggest that the horizontal transfer of retrotransposons can occur through the incorporation of RNA intermediates delivered via EVs and may have important implications for the intercellular regulation of gene expression and gene function.
Introduction
Long interspersed element-1 (LINE-1 or L1) retrotransposons are autonomous mobile elements that are able to create new genomic insertions by reverse transcription of an RNA intermediate. The human genome contains more than 500,000 L1 sequences, out of which 100 remain potentially mobile in any given individual [Citation1]. A full-length L1 element consists of a 5ʹ and 3ʹ UTR, two open reading frames (ORFs), and a poly-A tail. ORF1 encodes a 40 kDa protein with RNA biding and chaperone activities, and ORF2 encodes a 150 kDa protein that has endonuclease and reverse transcriptase activities [Citation2]. Due to their propensity for intragenomic spread, they are ubiquitous in eukaryotic genomes and are considered to be a major force driving genomic variation [Citation3–Citation6]. L1 retrotransposons are capable of altering the genome by causing mutations, deletions and rearrangements, and their effects range from local genetic instability to large-scale genomic variation. In somatic cells, these elements are silenced by epigenetic and post-transcriptional mechanisms. However, active retrotransposition have been implicated in various diseases. More than 70 diseases have been documented to be associated with heritable and somatic retrotransposition events [Citation4,Citation7].
Genome-wide studies and extensive phylogenetic evidence suggest that the horizontal transfer of retrotransposons is a common and widespread phenomenon in eukaryotic evolution [Citation6,Citation8–Citation10]. However, unlike retroviruses, L1 retrotransposons do not encode an envelope protein that enables the formation of virus-like particles. Therefore, their intergenomic spread requires a vector for mobilization, the evasion of nucleases in the extracellular environment, and successful integration into the recipient genome. Viruses and parasites have been proposed as potential vectors involved in the spread of retrotransposons across widely diverged species [Citation6,Citation11,Citation12]. A number of studies have provided support for the hypothesis of horizontal transfer, yet the precise mechanisms involved in the physical transmission of retrotransposons between donor and recipient cells remain elusive.
In this study, we focused on extracellular vesicles (EVs), which are cell-derived vesicles containing biologically active molecules including proteins, lipids, metabolites, and RNA that can be functionally delivered between different cells and cell types [Citation13,Citation14]. The discovery of such entities has shed new light on the horizontal transfer of RNA between cells in a single organism, but also between different organisms. EVs have been recognized as key mediators of intercellular communication in a variety of biological processes, including host-parasite interactions [Citation15,Citation16]. Cells release EVs of different size, origin, and functional properties [Citation17–Citation19]. EVs include vesicles of endosomal origin formed within multi-vesicular bodies, termed exosomes, and vesicles that are directly released from the plasma membrane of cells, often called microvesicles (MVs) [Citation19,Citation20].
Given the protective features of EVs and their ability to carry intact RNA to neighboring and distant cells [Citation21–Citation23], we sought to investigate the potential transfer of an active L1 retrotransposon from donor to recipient cells mediated by EVs. A previous report has shown that EVs from cancer cells contain retrotransposon RNA, including human endogenous retrovirus (HERV), L1 and Alu sequences [Citation24]. However, the effects of EVs carrying retrotransposon RNA and their ability to retrotranspose in recipient cells have not been reported. In this study we used a reporter gene-based L1 retrotransposition model to determine the functional transfer and activity of an active L1 retrotransposon in recipient cells, and show that EVs can mediate L1 retrotransposition across cells without direct cell-to-cell contact. The results presented here suggest an EV-mediated mechanism of L1 mobilization and the potential involvement of EVs in horizontal gene transfer.
Materials and methods
Cell culture
The human breast cancer cell line (MDA-MB-231-D3H2LN; gifted from Dr. Nao Nishida-Aoki), human colon cancer cell line (HCT116; purchased from American Type Culture Collection), and normal human dermal fibroblasts (gifted from Dr. Yutaka Naito) were maintained in DMEM (Gibco) supplemented with 10% heat-inactivated FBS and 1% antibiotic-antimycotic (Invitrogen). Cells were incubated at 37°C in 5% CO2 and passaged using standard cell-culture techniques.
Plasmid transfection
Plasmid transfections were performed with Lipofectamine LTX (Invitrogen) in accordance with the manufacturer’s instructions. The L1-EGFP plasmid consists of the retrotransposition-competent human L1 retrotransposon tagged with an EGFP cassette in a pCEP4 backbone (Invitrogen) [Citation25]. The L1mut-EGFP negative control plasmid contains disabling mutations in ORF1 [Citation25]. Plasmids were provided from Eline Luning Prak. Cells were seeded in 6-well plates and transfected with Lipofectamine LTX when they reached 70–80% confluence. Each well received 2.5 µg of L1-EGFP or L1mut-EGFP construct. Antibiotic selection (puromycin, 1µg/ml) was begun 48 hours after transfection. 15 days after transfection, cells were subjected to FACS using Bio-Rad S3e Cell Sorter (Bio-Rad Laboratories) for selection of GFP cells.
EV isolation
EVs were isolated from conditioned cell media of 20.0 × 10⁷ cells (200 ml) by differential centrifugation in a SW41Ti rotor (Beckman Coulter) as described [Citation19,Citation20,Citation26,Citation27]. Briefly, cells were grown in serum-free medium (Advanced DMEM; Gibco) supplemented with 1% antibiotic-antimycotic and 1% L-Glutamine for 48 hours. Conditioned medium was collected and centrifuged at 2,000 × g for 10 min to remove cells and cell debris. The supernatant was first filtered through a 0.8 µm filter (Whatman, GE Healthcare) and centrifuged at 20,000 × g for 60 minutes at 4°C to pellet MVs. To pellet exosomes, the supernatant was filtered through a 0.22 µm filter (Millipore) followed by ultracentrifugation at 210,000 × g for 70 minutes at 4°C. Exosome or MV pellets were washed in PBS and recentrifuged at the same speed before being resuspended in 100 µl of PBS.
Nanoparticle tracking analysis
The particle count and size distribution of EVs was determined using nanoparticle tracking analysis. Samples diluted 500-fold with PBS was analyzed using the NanoSight system LM10 with NTA2.3 Analytical software (NanoSight).
Transmission electron microscopy
Exosomes obtained by ultracentrifugation were submitted for transmission electron microscopy to Tokai Electron Microscopy, Inc. Samples were absorbed to carbon-coated copper grids (400 mesh) and were stained with 2% phosphotungstic acid solution (pH 7.0) for 15 sec. The grids were observed by a transmission electron microscope (JEM-1400plus; JEOL Ltd) at an acceleration voltage of 80 kV. Digital images were taken with a CCD camera (EM-14830RUBY2; JEOL Ltd).
Co-culture experiments
MM231 L1-EGFP or MM231 GFP cells were cultured together with MM231 wild-type cells or NHDF cells, separated by a transwell membrane of 0.4 µm or 1.0 µm pore size (#353090, #353102; BD Falcon). MM231 or NHDF cells were plated onto 6-well plates (100,000 cells/well) and cultured in DMEM. 24 hours later, MM231 L1-EGFP or MM231 GFP cells (100,000 cells/insert) were seeded in the transwell membrane inserts and co-cultured with recipient cells for 14 to 21 days. Cells grown in the transwell system were maintained at an optimal density to prevent the overgrowth of cells and the inhibition of L1 activity. Both donor and recipient cells were passaged into fresh transwell plates at low density before reaching 80% confluency. Cells were carefully rinsed with PBS and replaced with fresh culture media every 72 hours. Donor cells were passaged into new transwell inserts each time. Recipient cells were extensively washed with PBS before RNA or DNA isolation.
Gene silencing by siRNA
siRNA-mediated knockdown of human APOBEC3s in MM231 cells was performed by transfection of ON-TARGETplus Human APOBEC3A, APOBEC3B, APOBEC3C, and APOBEC3F siRNA (LQ-017432-00-0002, LQ-017322-00-0002, LQ-013711-00-0002, LQ-019039-02-0002; Dharmacon). Non-targeting pool (D-001810-10-05; Dharmacon) was used as a control. A final concentration of 25 nM of siRNA was transfected into MM231 cells using the DharmaFECT protocol for 6 well-plates according to the manufacturer’s instructions. RNA was isolated 72h later, and qRT-PCR analysis was performed as described below.
Total RNA isolation and qRT-PCR analysis
Total RNA was prepared from cultured cells and EVs using QIAzol and the miRNeasy Mini Kit (Qiagen) according to the manufacturer’s protocol. The purity and concentration of the isolated RNA were measured using a NanoDrop ND-1000 Spectrophotometer (Thermo Scientific). RNA concentration was determined using Qubit RNA BR Assay Kits (Invitrogen). Size distributions were determined using Agilent 2100 Bioanalyzer System with the RNA 6000 Pico Kit. First-strand cDNA synthesis was performed with the Superscript III Reverse Transcriptase (Invitrogen) using random primers. Real-time PCR was performed in triplicates with Platinum SYBR Green qPCR Super Mix-UDG (Invitrogen) in a StepOne Real-Time PCR System (Applied Biosciences), with primer pairs specific for EGFP-I (Forward 5ʹ-GCA CCA TCT TCT TCA AGG ACG AC-3ʹ, Reverse 5ʹ-TCT TTG CTC AGG GCG GAC TG-3ʹ), L1 (Forward 5ʹ-TGA AGG AAG CGC TAA ACA TGG-3ʹ, Reverse 5ʹ-AGC ACA CTG ATG GGT CTT GA-3ʹ), APOBEC3A (Forward 5ʹ-GAG AAG GGA CAA GCA CAT GG-3ʹ, Reverse 5ʹ-TGG ATC CAT CAA GTG TCT GG-3ʹ), APOBEC3B (Forward 5ʹ-GAC CCT TTG GTC CTT CGA C-3ʹ, Reverse 5ʹ-GCA CAG CCC CAG GAG AAG-3ʹ), APOBEC3C (Forward 5ʹ-AGC GCT TCA GAA AAG AGT GG-3ʹ, Reverse 5ʹ-AAG TTT CGT TCC GAT CGT TG-3ʹ), and APOBEC3F (Forward 5ʹ-CCG TTT GGA CGC AAA GAT-3ʹ, Reverse 5ʹ-CCA GGT GAT CTG GAA ACA CTT-3ʹ). All mRNA quantification data from cultured cells were normalized to the expression of glyceraldehyde 3-phosphate dehydrogenase (GAPDH; Forward 5ʹ-ACC ACA GTC CAT GCC ATC AC-3ʹ, Reverse 5ʹ-TCC ACC ACC CTG TTG CTG TA-3ʹ). To avoid contamination of genomic DNA, isolated total RNA was treated with DNase I (Takara) before reverse transcription.
Genomic DNA PCR
Genomic DNA was prepared using the DNeasy kit (Qiagen). PCR was performed with AmpliTaq Gold DNA polymerase (Applied Biosystems). PCR was performed using a cycling program of 95°C for 10 min, 95°C for 15 sec, 55°C for 30 sec, 72°C for 1 min, 72°C for 5 min, and 35 cycles were run. 10 µl of the PCR product was loaded onto a 2% agarose gel and visualized by SYBR Gold staining (Invitrogen). The resulting 345 bp products were purified using QIAquick Gel Extraction Kit (Qiagen), and subjected to DNA sequencing by Fasmac (Kanagawa, Japan). Alignments were done with ClustalW (Kyoto University Bioinformatics Center).
Western blotting
Whole-cell lysates were prepared with M-PER Mammalian Protein Extract Reagent (Thermo Scientific). Cell lysates or EV suspensions were denatured in 4× sample buffer solution without 2-Mercaptoethanol (Wako Pure Chemical Industries). Signals were detected using ImmunoStar LD (Wako Pure Chemical Industries). Western blots were performed as described previously [Citation27] using antibodies directed to CD9 (sc-59140; Santa Cruz Biotechnology), CD63 (556019; BD Biosciences), GFP (M048-3; MBL), L1TD1 (6439; ProSci), L1-ORF1p (MABC1152; Merck), L1-ORF2p (sc-67197; Santa Cruz Biotechnology), APOBEC3B (ab184990; Abcam), APOBEC3C (GTX102164; GeneTex), APOBEC3F (ab227962; Abcam) or GAPDH (MAB374; Millipore). Uncropped blots are shown in Figures S7, S8, and S9.
Fluorescence microscopy
Phase contrast and fluorescence images of cells were taken using Keyence BZX-700 microscope with a BZ-X filter GFP set with an excitation wavelength of 470/40 and emission wavelength of 525/50 (model OP-87763). Cells transfected with the L1mut-EGFP negative control plasmid were used as a negative control to determine background fluorescence. A constant fluorescence intensity level was used throughout each experiment, and cells that fluoresced above this threshold were considered false positives. Phase contrast and fluorescence images of GFP positive cells were analyzed using Hybrid Cell Count (BZ-H3C; Keyence).
Treatment with trichostatin A
Where indicated, cells were treated with 100, 500, and 1000 nM of trichostatin A (Sigma-Aldrich) for 14 hours to assay for the reactivation of L1-EGFP expression, as described [Citation28].
Statistical analysis
Statistical analyses were performed using the Student’s t-test (two-tailed), or two-way ANOVA using Dunnett’s test for the comparison of means in more than two groups. Data presented are mean±s.d. and P < 0.05 was considered statistically significant.
Results
Establishment of an L1 retrotransposition model
In this study, an L1 retrotransposition model was established using human cancer cells, previously reported to be permissive for L1 retrotransposition [Citation29,Citation30]. Human cancer cell lines MDA-MB-231-D3H2LN (MM231) and HCT116 were transfected with a retrotransposition-competent human L1 tagged with an EGFP reporter gene (L1-EGFP; ) as described previously [Citation25,Citation28,Citation31,Citation32]. In this construct, the EGFP reporter gene is interrupted by an intron and inserted in the opposite transcriptional orientation into the 3ʹ UTR of a retrotransposition-competent human L1. Therefore, EGFP is expressed only when the L1 transcript is spliced, reverse transcribed and integrated into the chromosomal genome during a retrotransposition event [Citation31]. Successful L1 integration by retrotransposition can be detected by screening for EGFP expression, or by performing PCR with primers flanking the EGFP intron (). An inactive L1 containing disabling mutations in ORF1 of L1 was used as a negative control (L1mut-EGFP) [Citation25].
Figure 1. The L1-EGFP retrotransposition model. (a) Representative images of MM231 and HCT116 cell lines transfected with L1-EGFP or L1mut-EGFP. GFP fluorescence is only detected when there is an active L1-EGFP retrotransposition event. Scale bars represent 200 µm. (b) Primers designed to detect L1 (249 bp) and spliced EGFP RNA (EGFP-I; 345 bp) in the L1-EGFP construct. (c) mRNA expression of EGFP-I and (d) L1 in WT, L1-EGFP, and L1mut-EGFP cells relative to GAPDH. N = 3 wells in 6-well plate. Error bars represent SD.
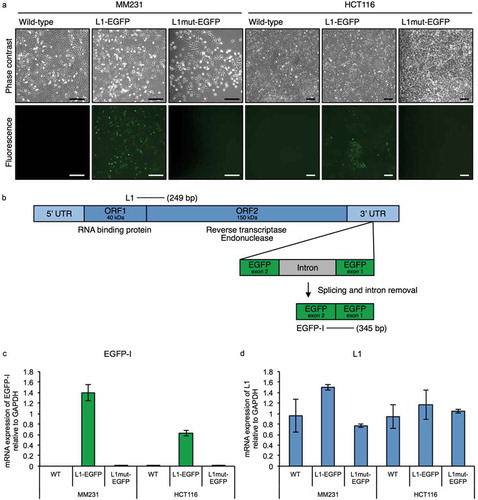
Cells expressing EGFP were observed in both MM231 and HCT116 cells transfected with the L1-EGFP construct, whereas EGFP was not detected in cells transected with the L1mut-EGFP construct, indicating that the L1 retrotransposition machinery is required for the EGFP reporter gene to be integrated into the genome (). Transfected cells were cultivated for 15 days under puromycin selection, and EGFP expressing cells were selected by fluorescent activated cell sorting (FACS) and expanded (termed L1-EGFP cells). Quantitative reverse transcription PCR (qRT-PCR) analysis confirmed the expression of spliced L1-EGFP RNA in cells transfected with the retrotransposition-competent L1, in addition to the expression of endogenous L1 transcripts in MM231 and HCT116 cells (). Cells transfected with the retrotransposition-defective L1 did not express spliced L1-EGFP RNA ()).
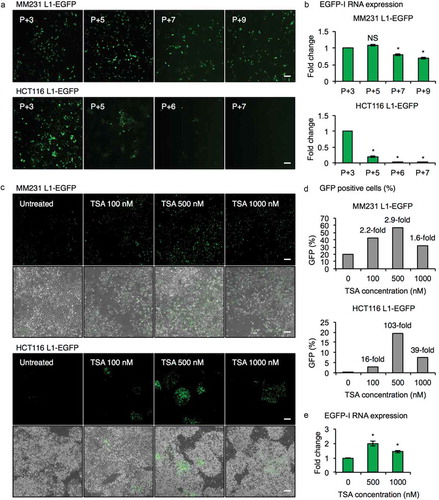
Although L1-EGFP retrotransposition was readily detected in both MM231 and HCT116 cell lines, a marked decrease in L1-EGFP retrotransposition was observed in HCT116 L1-EGFP cells after several passages, as demonstrated by the reduction in the number of EGFP expressing cells ()). qRT-PCR analysis showed that L1-EGFP RNA declined with passage number in MM231 L1-EGFP and HCT116 L1-EGFP cells ()). We hypothesized that retrotransposed L1-EGFP may be subjected to epigenetic silencing, previously reported to be an important mechanism regulating L1 retrotransposons [Citation7,Citation28,Citation33]. To determine whether decrease in EGFP expression was a result of epigenetic silencing, we treated MM231 L1-EGFP and HCT116 L1-EGFP late-passage cells with the histone deacetylase inhibitor, trichostatin A (TSA) for 14 hours and observed the reactivation of EGFP expression after TSA treatment of MM231 L1-EGFP and HCT116 L1-EGFP cells in a dose-dependent manner (up to 2.9-fold and 103-fold, respectively; ). In addition, the expression of L1-EGFP RNA was increased up to 2-fold in MM231 L1-EGFP cells treated with TSA ()). MM231 L1-EGFP cells were used for subsequent experiments due to their stable expression of L1-EGFP retrotransposition.
Figure 2. Epigenetic silencing of L1-EGFP retrotransposition events. (a) Fluorescent images of MM231 L1-EGFP and HCT116 L1-EGFP cell lines. Passage number after selection of EGFP expressing cells by FACS is indicated in the upper left corner. P, passage number. Scale bars represent 200 µm. (b) EGFP-I RNA expression in MM231 L1-EGFP and HCT116 L1-EGFP cell lines over time. EGFP-I expression was normalized to GAPDH and is shown as the fold change relative to P + 3 cells. (c) Fluorescent and phase contrast images of late-passage MM231 L1-EGFP and HCT116 L1-EGFP cell lines 14 hours after treatment with 100, 500 and 1000 nM of TSA. Scale bars represent 200 µm. (d) Percentage of EGFP positive cells in (c). (e) EGFP-I RNA expression following TSA treatment in MM231 L1-EGFP cells. EGFP-I expression was normalized to GAPDH and is shown as the fold change relative to 0 nM TSA. N = 3 wells in 6-well plate. Error bars represent SD. *, P < 0.05; NS, not significant; Dunnett’s test.
MM231 L1-EGFP cells release EVs enriched in L1-EGFP RNA
To examine whether MM231 cells expressing active L1-EGFP retrotransposition release EVs containing L1-EGFP-derived RNA transcripts, EVs including exosomes (50–150 nm) and microvesicles (MVs; ~800 nm) were prepared from the supernatant of early-passage MM231 L1-EGFP cells by differential centrifugation (), as previously described [Citation19,Citation20,Citation26,Citation27]. Conditioned medium from L1-EGFP cells was collected and centrifuged at 2,000 × g to remove cells and cell debris. The supernatant was filtered through a 0.8 µm filter to remove apoptotic bodies greater than 800 nm and centrifuged at 20,000 × g to pellet MVs. The supernatant was filtered through a 0.22 µm filter followed by ultracentrifugation at 210,000 × g to pellet exosomes (Figure S1). EVs were characterized using nanoparticle tracking analysis. Exosome fractions showed a single bell-shaped distribution with a peak at 119 nm, whereas MV fractions showed a heterogeneous population, with multiple peaks ranging from 182 to 500 nm (). In general, the majority of vesicles in MV fractions were larger than 150 nm, and vesicles in the exosome fractions were within 50 nm to150 nm. The total number of particles secreted per cell was slightly smaller in MV fractions than exosome fractions.
Figure 3. Characterization of MM231 L1-EGFP EVs. (a) Exosomes (50–150 nm) and MVs (~800 nm) were isolated from the supernatant of MM231 L1-EGFP cells by a series of filtration and ultracentrifugation steps. (b) Particle size distribution plot of isolated exosomes and MVs measured by nanoparticle tracking analysis. Particle diameter in nanometers on the x-axis is plotted against particle concentration on the y-axis. Particle concentration is estimated based on scattering volume calculated from the dimensions of the field of view and the depth of the laser beam. The total concentration of particles and mode size is displayed on the upper right. All samples were analyzed using the same parameters. (c) Protein from whole cell lysates, exosomes, and MVs from MM231 L1-EGFP cells were separated on SDS-PAGE gels, followed by Western blotting using antibodies against CD9, CD63, GFP, L1TD1 and GAPDH. Equivalent amount of protein (800 ng) was loaded for each sample. (d) Bioanalyzer electropherogram of RNA extracted from MM231 L1-EGFP exosomes and MVs. The x-axis indicates the length of the RNA in nucleotides (nt) and the y-axis indicates fluorescence intensity in arbitrary units. The lowest peak at 25 nt indicates the lower size marker. FU, fluorescent unit. (e) Measurement of exosome and MV RNA by Qubit RNA BR assay kit, normalized to cell number (1 × 10⁶ cells). (f, g) Expression levels of EGFP-I and L1 RNA in MM231 L1-EGFP exosomes and MVs. Expression levels were normalized to GAPDH and are shown as the fold change relative to exosome RNA. CT, cycle threshold value. (h) Abundance of L1 RNA relative to GAPDH RNA in MM231 L1-EGFP EVs. (i) The ratio of L1 to GAPDH RNA was compared in RNA extracted from MM231 L1-EGFP cells and EVs. The data is shown as ratio of L1 to GAPDH RNA relative to cell. N = 3, error bars represent SD. *, P < 0.05; t-test.
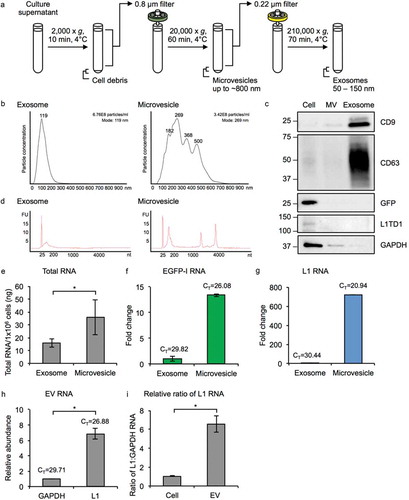
Equal amounts of proteins from cell lysates and isolated EV fractions were characterized by Western blots (). While the tetraspanins CD9 and CD63 were highly present in the exosome fraction, CD9 was faintly present in the MV fraction. CD63 was not detected at all in the MV fraction. EVs lacking CD63 but present in CD9 are known to be associated with the plasma membrane, which could be characteristic of MVs. On the other hand, GAPDH was not detectable in the exosome fraction, but present in the MV fraction, suggesting that large EVs such as MVs contain some cellular protein. This is reflects the likely differences in biogenesis, where smaller EVs such as exosomes are secreted through the endosome pathway and would present endosome markers, whereas larger EVs such as MVs are produced by direct budding from the cell membrane and would present cell proteins or proteins associated with the plasma membrane. Our findings are in line with other reports that have analyzed the expression of proteins in exosome and MV fractions, and reflects differences in biogenesis of EV subtypes [Citation19,Citation26]. GFP and L1-encoded proteins were not detected in both EV fractions ().
Total RNA was isolated from each EV fraction and analyzed by Bioanalyzer (). Exosomes contained small RNA sizes ranging up to 200 nt in length, whereas a broader RNA size distribution profile was observed in MVs (). High-quality cellular RNA with sharp rRNA peaks with no sign of degradation was detected in the MV fraction, indicating intact RNA is contained in MVs. In contrast, RNA from exosomes exhibited mostly short RNA profiles below 200 nt and no rRNA peaks. Overall, total RNA was found to be higher in MVs than in exosomes (). L1 RNA encodes proteins required for L1 to retrotranspose but also serves as a template for reverse transcription (Figure S2A), therefore L1 transcript abundance is suggested to be rate-limiting for retrotransposition [Citation34,Citation35]. We compared the L1-EGFP transcript abundance in exosomes and MVs to determine whether EV size could be an important factor facilitating L1-EGFP retrotransposition in recipient cells. Using qRT-PCR, we confirmed the presence of spliced L1-EGFP transcripts and endogenously expressed L1-derived transcripts in both exosomes and MVs, with greater copies of EGFP and L1 RNA in MVs by 13-fold and 720-fold, respectively (). Notably, L1 RNA was found to be more abundant than GAPDH RNA in both fractions of EVs (). Furthermore, the ratio of L1 to GAPDH RNA was found to be higher in EVs than from the cellular fraction (). These results suggest that L1 RNA is enriched and selectively packaged in EVs released from L1-EGFP cells.
L1-EGFP RNA is delivered to recipient cells and is capable of retrotransposition
To investigate the transfer of L1-EGFP RNA to recipient cells, MM231 L1-EGFP cells were co-cultured with MM231 wild-type (WT) cells as recipient cells (). A co-culture system was employed to evaluate indirect cell-to-cell interaction facilitated by EVs in an environment closer to physiological conditions than the commonly used method of exposing cells to highly concentrated EV preparations. Transwell inserts with pore sizes of 0.4 µm or 1.0 µm were selected, as they allow EVs but not whole cells to pass through. The mobilization of retrotransposons involves reverse transcription of an RNA intermediate; therefore, the translation of L1 RNA and subsequent accumulation of L1 ribonucleoprotein (RNP) complexes are critical for retrotransposition [Citation36,Citation37] (Figure S2A). A co-culture system was employed to ensure a sustained transfer of fresh EVs containing L1-EGFP RNA to recipient cells, as it was found that the administration of isolated MVs or exosomes resulted in the transient delivery of L1-EGFP RNA (Figure S2B). Recipient cells were harvested after 14 days of co-culture with L1-EGFP cells, and total RNA was extracted (). The intercellular transfer of L1-EGFP RNA to recipient cells was confirmed using 0.4 µm and 1.0 µm transwells. Consistent with previous reports [Citation38], increased efficiency of EV RNA transfer to recipient cells was observed using a larger pore size of 1.0 µm ().
Figure 4. L1-EGFP RNA is transferred to recipient cells. (a) A co-culture system was used to assess the transfer of EGFP-I RNA to MM231 recipient cells using 0.4 and 1.0 µm transwells for 14 days. RNA was collected from MM231 recipient cells and analyzed for EGFP-I RNA by qRT-PCR. EGFP-I expression was normalized to GAPDH and is shown as the fold change relative to EGFP-I RNA in recipient cells with the 0.4 µm transwell. CT, cycle threshold value; N.D., not determined. (b) Representative images of MM231 cells co-cultured with MM231 L1-EGFP or (c) MM231 GFP cells using a 1.0 µm transwell for 21 days. Scale bars represent 100 µm. (d) PCR analysis of genomic DNA with primers flanking the intron in the EGFP reporter gene (345 bp). PCR products were analyzed on a 2% agarose gel. Lane 1, DNA ladder; lane 2, MM231 WT; lane 3, MM231 L1-EGFP; lane 4, MM231 recipient cells co-cultured with MM231 GFP; lane 5, MM231 recipient cells co-cultured with MM231 L1-EGFP. (e) Sequence analysis for L1-EGFP DNA, recipient cell DNA, and reference EGFP-I sequence. Genomic DNA was extracted from MM231 L1-EGFP cells and MM231 recipient cells co-cultured with MM231 L1-EGFP cells after 21 days. Alignment of partial sequences of EGFP is shown. The position of the splice site is indicated with an arrow. N = 3 wells in 6-well plate, error bars represent SD.
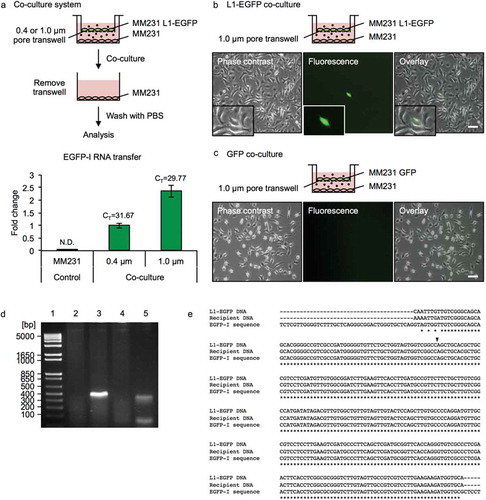
We examined the protein expression of L1-ORF1p and L1-ORF2p in recipient cells at days 5, 10, and 14 of continuous co-culture and found that while L1-ORF1p expression is increased at a constant level from day 5, increase in L1-ORF2p was not observed until day 14 (Figure S3A). In contrast to continuous co-culture, the expression of both L1-ORF1p and L1-ORF2p were reduced to endogenous levels when cells were co-cultured for a shorter period of time (Figure S3B). To investigate whether L1-EGFP RNA delivered to recipient cells is capable of initiating retrotransposition, MM231 WT cells were co-cultured with MM231 L1-EGFP or MM231 GFP cells using a 1.0 µm transwell (). After 21 days of co-culture, EGFP expressing cells were detected in recipient cells that were exposed to L1-EGFP EVs (). In contrast, EGFP expression was not detected in cells co-cultured with MM231 cells expressing GFP alone (MM231 GFP; ), implying that retrotransposition-competent L1 activity is necessary for the EGFP reporter gene to be integrated and expressed from a new insertion site in the genome of recipient cells. These results suggest that active L1 expression in donor cells is required for retrotransposition to occur in recipient cells, and excludes the potential contamination of the GFP protein or cell to recipient cells.
The precise splicing of the intron and the integration of the EGFP gene by L1 retrotransposition was confirmed by PCR analysis of genomic DNA extracted from recipient cells, as indicated by the presence of the 345 bp product (). Sequence alignment of genomic DNA extracted from of L1-EGFP cells and recipient cells confirmed the sequence of the EGFP reporter gene (). The occurrence of L1-EGFP retrotransposition observed in recipient cells was extremely low (on average <1 per 7 × 10⁵ cells). To expand these observations to other recipient cell-types, we applied the same co-culture method using normal human dermal fibroblasts (NHDF) as recipient cells. Recipient fibroblast cells that were exposed to L1-EGFP RNA acquired EGFP expression, which were detected as spindle-shaped fibroblast phenotype, distinct from the appearance of L1-EGFP cells (Figure S4). The frequency of L1-EGFP retrotransposition events observed in NHDF cells was estimated to occur in <1 per 3 × 10⁶ cells.
Host factors are activated in response to L1-EGFP RNA delivered by EVs
We speculated that the low frequency of L1-EGFP retrotransposition observed in recipient cells could be influenced by mechanisms regulating the activity of L1 retrotransposons exerted at the transcriptional or post-transcriptional level. Thus, we tested whether retrotransposed L1-EGFP may be silenced during or immediately after integration in the genome of cells. To address this possibility, we applied a histone deacetylase inhibitor, TSA, to recipient cells co-cultured with MM231 L1-EGFP cells after 21 days; however, the addition of TSA did not increase the overall frequency of EGFP expressing cells. Since reactivation of the integrated EGFP gene will only occur after successful L1 retrotransposition, we speculated that de novo L1 integration in recipient cells occurs at low frequency.
Therefore, we next examined whether host mechanisms regulating L1 activity could be affecting the rate of L1-EGFP retrotransposition in recipient cells. APOBEC3 (apolipoprotein B mRNA-editing enzyme catalytic polypeptide-like protein 3) is a well-known example of an intrinsic factor that inhibits L1 retrotransposition by cytidine deaminase activity [Citation39–Citation41] and deamination-independent mechanisms such as sequestration of retrotransposon RNPs and targeting to cytoplasmic stress granules and processing bodies for degradation [Citation33,Citation36,Citation42–Citation44]. To investigate whether L1-EGFP retrotransposition is inhibited by endogenous APOBEC3 activity, we performed qRT-PCR analysis on total RNA from L1-EGFP cells and recipient cells co-cultured with L1-EGFP cells exposed to L1-EGFP EVs. Increased expression of APOBEC3B (A3B) and APOBEC3C (A3C) was detected in both MM231 L1-EGFP and HCT116 L1-EGFP cells (Figure S5A). APOBEC3F (A3F) expression was increased in HCT116 L1-EGFP cells, but not in MM231 L1-EGFP cells (Figure S5A). APOBEC3A (A3A) was not expressed in both cell lines (Figure S5A). More notably, a significant increase in the expression of A3B, A3C, and A3F was observed in MM231 recipient cells exposed to L1-EGFP EVs (). The gradual increase of corresponding proteins was also observed from day 5 to day 14 in recipient cells (). These findings indicate that A3B, A3C, and A3F in MM231 recipient cells are activated in response to increased exposure to L1-EGFP RNA.
Figure 5. APOBEC3 genes are upregulated in L1-EGFP recipient cells. (a) Expression levels of A3B, A3C and A3F RNA in MM231 cells co-cultured with MM231 L1-EGFP cells. Expression levels were normalized to GAPDH and are shown as the fold change relative to MM231 cells without co-culture. CT, cycle threshold value of each APOBEC3 genes are shown. (b) Expression levels of A3B, A3C and A3F RNA in MM231 cells after siRNA-mediated knockdown of APOBEC3 genes. Expression levels were normalized to GAPDH and are shown as the fold change relative to MM231 untreated cells. (c) Expression levels of A3B, A3C and A3F in MM231 cells co-cultured with L1-EGFP cells after siRNA-mediated knockdown of APOBEC3 genes. Expression levels were normalized to GAPDH and are shown as the fold change relative to MM231 WT cells. (d) Whole cell lysates of MM231 cells and MM231 cells co-cultured with MM231 L1-EGFP cells were separated on SDS-PAGE gels, followed by Western blotting using antibodies against A3B, A3C, A3F and GAPDH. Equivalent amount of protein (20 µg) was loaded for each sample. (e) Whole cell lysates of MM231 untreated cells and MM231 cells transfected with non-targeted (control) siRNA, A3B-1, A3C-1, and A3F-3 siRNA were separated on SDS-PAGE gels, followed by Western blotting using antibodies against A3B, A3C, A3F and GAPDH. Equivalent amount of protein (20 µg) was loaded for each sample. N = 3 wells in 6-well plate. Error bars represent SD. *, P < 0.05; Dunnett’s test.
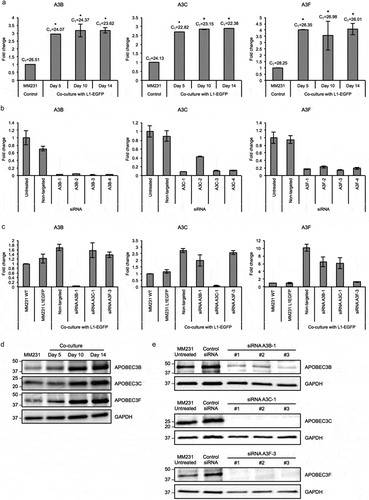
To investigate whether A3B, A3C, and A3F expression could exert inhibitory effects on L1-EGFP retrotransposition in recipient cells, we used siRNA-mediated knockdown to downregulate the expression of endogenous A3B, A3C, and A3F genes in MM231 cells (). Based on the knockdown efficiency (), A3B-1, A3C-1, and A3F-3 were selected and transfected to MM231 cells. The depletion of corresponding proteins was also confirmed using siRNA targeted at A3B, A3C, and A3F genes (). 48 hours after transfection, MM231 cells were co-cultured with L1-EGFP cells. Reduced RNA expression levels of A3B, A3C, and A3F was confirmed in MM231 cells co-cultured with L1-EGFP cells after siRNA-mediated knockdown (). Additionally, when MM231 cells were exposed to L1-EGFP EVs in the co-culture system, the knockdown of A3B, A3C, and A3F induced substantial changes in cell morphology (). This change was only evident in cells exposed to L1-EGFP RNA, and not observed as a consequence of siRNA transfection (Figure S5B). In particular, cellular arrest was observed in A3C knockdown cells, whereas reduced cell growth and spindle-like cells were observed in A3F knockdown cells (). A3C and A3F knockdown cells appeared to express EGFP (), however, these cells did not proliferate.
Figure 6. L1-EGFP retrotransposition after knockdown of APOBEC3 genes. (a) Images of MM231 cells co-cultured with L1-EGFP cells after siRNA-mediated knockdown of APOBEC3 genes. (b) EGFP expression in A3C-1 and A3F-3 siRNA transfected cells co-cultured with L1-EGFP cells for 21 days. All scale bars represent 100 µm. N = 3 wells in 6-well plate.
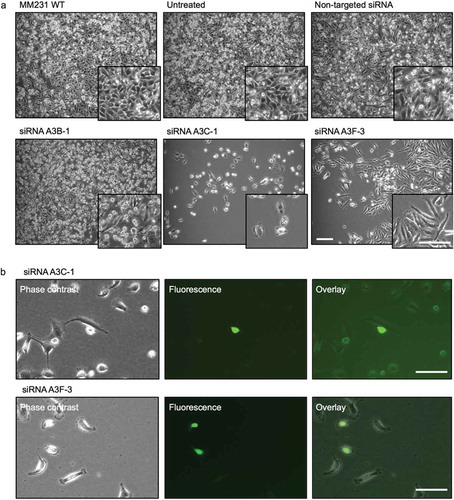
The siRNA-mediated knockdown of endogenous APOBEC3 genes did not significantly increase the overall incidence of L1-EGFP retrotransposition in MM231 recipient cells. However, reduced APOBEC3 activity and exposure to L1-EGFP RNA caused profound impairment of cellular integrity in recipient cells, as demonstrated by increased apoptosis, cell cycle arrest, and reduced cell growth. This data suggest that reduced APOBEC3 activity, the accumulation of L1-EGFP RNA and translated proteins can cause cytotoxic effects in recipient cells. These observations are consistent with other reports that host factors such as APOBEC3 restricts L1 activity and therefore could function to preserve genome integrity [Citation39,Citation41,Citation42].
Discussion
By using a reporter gene-based L1 retrotransposition model, we have demonstrated that RNA transcripts derived from an active human L1 element are packaged in EVs and are capable of initiating retrotransposition in recipient cells. In this study, large EVs such as MVs were recovered by medium centrifugation speed, and small EVs such as exosomes were recovered by high centrifugation speed. The majority of vesicles in MV fractions were larger than 150 nm and up to 550 nm, and vesicles in the exosome fractions were within 50 nm to 150 nm. RNA profiles examined by Bioanalyzer indicated intact RNA including cellular RNA in MVs, and short RNA species of up to 200 nt in exosomes. Using qRT-PCR we have detected the higher expression of L1-EGFP RNA in comparison to GAPDH RNA in both exosomes and MV fractions. Previous reports have examined the RNA landscape of EVs, which include thousands of individual RNA species, including protein-coding and non-coding RNA. Using RNA-seq, it has been demonstrated that near-complete short mRNAs are detected in cellular and EV fractions, but detection of long mRNAs above 1000 nt is limited to cells and MVs only [Citation45]. As suggested by this analysis, long mRNAs could be excluded from packaging into smaller vesicles such as exosomes, or are present as fragments. Larger vesicles such as MVs appear to closely reflect the cellular transcriptome.
We estimated that <1% (<1 per 7 × 10⁵ cells) of de novo L1 retrotransposition events occurred in MM231 recipient cells. The low occurrence of successful L1 retrotransposition in recipient cells could be largely influenced by cellular conditions affecting the accumulation of L1-derived RNA transcripts and the formation of the RNP complex in recipient cells. Based on the reported frequency of retrotransposition in cell culture assays, we regard that an extended period of culture is required for the horizontal transfer of retrotransposon RNA intermediates and successive retrotransposition in recipient cells. Furthermore, the transcription and translation of L1 elements are prerequisites for L1-mediated retrotransposition. Despite the vast majority of L1 encoded in the genome, only RNA transcripts derived from retrotransposition-competent L1 elements can efficiently retrotranspose, as L1-encoded proteins demonstrate a profound cis preference for their encoding RNA [Citation46]. Previous studies have demonstrated that L1 proteins preferentially mobilize the transcript from which they are encoded. Furthermore, for L1-EGFP to be transcribed from the genome and delivered to recipient cells would be processed differently than a sequence delivered on an episome. In this case, the L1-EGFP transcript will be targeted by inhibitory mechanisms that regulate retrotransposition. We regard the delivery of L1 RNA by EVs as the major limiting step in the horizontal transfer of L1, determined by the functional uptake of EVs, the efficiency of RNA cargo transfer, and subcellular fate of EVs in recipient cells.
The expression and activity of L1 elements involves a complex interplay between a variety of host cellular factors that have been shown to restrict or support their activity within a cell [Citation33]. In line with previous reports, we have observed the upregulation of host mechanisms such as APOBEC3 proteins that are known to restrict L1 integration and limit the activity of L1 elements [Citation39–Citation43]. During the period of co-culture with L1-EGFP cells, cellular factors including APOBEC3 proteins could be involved in the inhibition of L1 activity in recipient cells by interacting with L1 RNA and encoded proteins. Other studies have shown that L1 RNPs accumulate in cytoplasmic stress granules and processing bodies for degradation of L1 RNA and machinery [Citation33,Citation36,Citation42–Citation44]. Alternatively, it is also plausible that de novo L1 insertions occurred in recipient cells without the expression of the EGFP reporter gene. L1 insertions may indeed occur in transcriptionally inactive sites, undergo epigenetic silencing or 5ʹ truncation during or soon after retrotransposition that render EGFP copies inactive. Defining the mechanisms that regulate the site and frequency of de novo L1 insertions in somatic cells would help to better define the prevalence and conditions accommodating L1 activity in host cells. Nonetheless, the detection of EGFP in recipient cells indicates an active L1 retrotransposition event and demonstrates the horizontal transfer of a L1 retrotransposon mediated by EVs.
A delay in protein expression of L1-ORF2p in recipient cells was observed, which could be a significant factor in the final stages of the L1 cycle in TPRT and integration in the genome of recipient cells. While L1-ORF1p is an RNA binding protein with chaperone activity, L1-ORF2p contains domains with endonuclease and reverse transcriptase activity. Multiple molecules of L1-ORF1p are required to form the RNP complex in the cytoplasm, whereas only a single molecule of L1-ORF2p is required for TPRT in the nucleus [Citation47–Citation50]. Previous studies have showed the importance of expression of L1-encoded ORF1 and ORF2, particularly the endonuclease and reverse transcriptase activity of ORF2p, in effective retrotransposition. Mutational analysis of ORF2 demonstrates that the endonuclease and reverse transcriptase activity is required for retrotransposition and support the notion that ORF2 is a modular protein [Citation51,Citation52]. As the endonuclease activity of L1-ORF2p could result in excess DNA damage; therefore, the regulation of ORF2p translation would be advantageous to the cell, and will result in lower biogenesis.
The inhibition of APOBEC3 and subsequent exposure to L1-EGFP EVs had a profound effect on the cellular integrity of recipient cells, as demonstrated by increased apoptosis, cell cycle arrest, and reduced cell growth. Host mechanisms such as APOBEC3 protect the cell from accumulating L1 RNA and translated proteins, as misregulated expression of L1 retrotransposons can damage the genome [Citation33]. The L1-encoded endonuclease is capable of forming double-strand breaks in the host DNA, which can result in cell cycle arrest and apoptosis [Citation53,Citation54]. Additionally, L1 retrotransposition requires active host cell divisions [Citation55,Citation56]; therefore cell cycle arrest and apoptosis may also represent host mechanisms that restrict L1 integration to ensure genome integrity.
Retrotransposition gives permanent integration into the host genome. Retrotransposition resulting in gene insertions and translocation of genomic sequences in regulatory regions can alter gene structure, expression, and function [Citation11,Citation57,Citation58]. The uptake of retrotransposon RNA and subsequent retrotransposition can lead to somatic insertions in recipient cells. The disruption of human genes by L1 has been well documented, such as APC [Citation59], Dystrophin [Citation60], CYBB [Citation61], RP2 [Citation62], and CHM [Citation63]. Aberrant L1 activity may be a driving force in tumor evolution and the development of genetic heterogeneity in human cancer. As proposed by others, the differential activation of retrotransposons can generate cellular heterogeneity that typically characterize human cancers [Citation64–Citation66]. In this model, it has been suggested that retrotransposon activation triggered by exogenous or endogenous stimuli would generate a heterogenous cell population with various levels of retrotransposon activity, and varying degrees of metastatic capacity. Cells originating from retrotransposon activation would differentially propagate through cancer development. L1 insertions in transcriptionally active sites that confer favorable traits would be expressed and may contribute to cancer progression through the clonal expansion of select cells [Citation67,Citation68]. We speculate that this effect could be further enhanced by the secretion of EVs containing functional L1-derived RNA transcripts and their uptake in neighboring cells. In this study we observed the increased expression of APOBEC3 family members in recipient cells that were exposed to L1-derived RNA transcripts. This finding may also indicate an additional role by which L1 RNA delivered by EVs may contribute to genome instability in recipient cells. Previous reports have showed that APOBEC3 members are capable of inducing mutations in chromosomal DNA and therefore could contribute to carcinogenesis [Citation69]. Genomic analysis of clinical samples have shown that APOBEC3-signature mutation patterns are prevalent in human tumors [Citation69–Citation71]. However, it has been unclear what induces their endogenous expression under physiological conditions [Citation72]. Given that increased L1 activity is often observed in cancers, APOBEC3 induction as a consequence of exposure to L1-derived RNA transcripts could be a viable hypothesis. Understanding the regulation of L1 mobilization via cancer EVs, and the consequential effects of L1-derived RNA transcripts in recipient cells may help to identify molecular processes involved in the modulation of the cancer microenvironment.
In summary, we have demonstrated that RNA transcripts derived from an active human L1 retrotransposon are packaged in EVs and can initiate retrotransposition in recipient cells. We show that functional RNA intermediates are delivered to recipient cells, which are translated into the encoded proteins, allowing the reverse transcription and genomic integration of EGFP assisted by L1-encoded endonuclease and reverse transcriptase. Characterization of recipient cells by PCR amplification and sequencing analysis confirmed the precise splicing of the intron and the integration of the EGFP gene by retrotransposition. This study demonstrates that an active L1 retrotransposon can be transmitted to neighboring cells without direct cell-to-cell contact mediated by RNA intermediates secreted by the cell. Additionally, we show that RNA transfer may influence recipient transcriptional and post-transcriptional regulation. We demonstrate that L1-derived RNA transcripts and translated proteins are targeted by intrinsic host factors such as APOBEC3 family members, potentially restricting L1 activity to ensure genome stability in the cell. Although further experiments are required to assess the biological consequences of de novo L1 insertions in recipient cells, this study provides evidence for the horizontal transmission of an active L1 retrotransposon mediated by EVs in cultured cells.
Disclosure of interest
The authors report no conflicts of interest with the contents of this article.
Supplemental Material
Download PDF (5.6 MB)Acknowledgments
The authors would like to thank Dr. Nao Nishida-Aoki for providing MDA-MB-231-D3H2LN and MDA-MB-231-D3H2LN-GFP cell lines; Dr. Yutaka Naito for providing the NHDF cell line; Dr. Takeshi Katsuda for providing the GFP antibody; and Dr. Ryou-u Takahashi for help with FACS.
Supplementary material
Supplemental data for this article can be accessed here.
Additional information
Funding
Related Research Data
References
- Brouha B, Schustak J, Badge RM, et al. Hot L1s account for the bulk of retrotransposition in the human population. Proc Natl Acad Sci [ Internet]. 2003;100:5280–17. Available from: http://www.pnas.org/cgi/doi/10.1073/pnas.0831042100.
- Erwin JA, Marchetto MC, Gage FH. Mobile DNA elements in the generation of diversity and complexity in the brain. Nat Rev Neurosci [ Internet]. 2014;15:497–506.
- Singer T, McConnell MJ, Marchetto MCN, et al. LINE-1 retrotransposons: mediators of somatic variation in neuronal genomes? Trends Neurosci. 2010;33:345–354.
- Cordaux R, Batzer MA. The impact of retrotransposons on human genome evolution. Nat Rev Genet [ Internet]. 2009;10:691–703.
- Mita P, Boeke JD. How retrotransposons shape genome regulation. Curr Opin Genet Dev [ Internet]. 2016;37:90–100.
- Schaack S, Gilbert C, Feschotte C. Promiscuous DNA: horizontal transfer of transposable elements and why it matters for eukaryotic evolution. Trends Ecol Evol. 2010;25:537–546.
- Baillie JK, Barnett MW, Upton KR, et al. Somatic retrotransposition alters the genetic landscape of the human brain. Nature [ Internet]. 2011;479:534–537. Available from: https://www.nature.com/articles/nature10531.
- Ivancevic AM, Walsh AM, Kortschak RD, et al. Jumping the fine LINE between species: horizontal transfer of transposable elements in animals catalyses genome evolution. BioEssays. 2013;35:1071–1082.
- Silva JC, Loreto EL, Clark JB. Factors that affect the horizontal transfer of transposable elements. Curr Issues Mol Biol. 2004;6:57–72.
- Wijayawardena BK, Minchella DJ, DeWoody JA. Hosts, parasites, and horizontal gene transfer. Trends Parasitol [ Internet]. 2013;29:329–338.
- Hancks DC, Kazazian HH. Roles for retrotransposon insertions in human disease. Mob DNA [ Internet]. 2016;7(1–28). Available from: http://mobilednajournal.biomedcentral.com/articles/10.1186/s13100-016-0065-9
- Goodier JL, Kazazian HH. Retrotransposons revisited: the restraint and rehabilitation of parasites. Cell. 2008;135:23–35.
- Lee Y, El Andaloussi S, Wood MJA. Exosomes and microvesicles: extracellular vesicles for genetic information transfer and gene therapy. Hum Mol Genet. 2012;21:125–134.
- Tkach M, Théry C. Communication by extracellular vesicles: where we are and where we need to go. Cell. 2016;164:1226–1232.
- Coakley G, Maizels RM, Buck AH. Exosomes and other extracellular vesicles: the new communicators in parasite infections. Trends Parasitol. 2015;31:477–489.
- Szempruch AJ, Dennison L, Kieft R, et al. Sending a message: extracellular vesicles of pathogenic protozoan parasites. Nat Rev Microbiol [ Internet]. 2016;14:669–675. Available from: http://www.nature.com/doifinder/10.1038/nrmicro.2016.110.
- Raposo G, Stoorvogel W. Extracellular vesicles: exosomes, microvesicles, and friends. J Cell Biol [ Internet]. 2013;200:373–383. Available from: http://www.jcb.org/lookup/doi/10.1083/jcb.201211138.
- Kowal J, Tkach M, Théry C. Biogenesis and secretion of exosomes. Curr Opin Cell Biol. 2014;29:116–125.
- Kowal J, Arras G, Colombo M, et al. Proteomic comparison defines novel markers to characterize heterogeneous populations of extracellular vesicle subtypes. Proc Natl Acad Sci [ Internet]. 2016;113:E968–E977. Available from: http://www.pnas.org/lookup/doi/10.1073/pnas.1521230113.
- Crescitelli R, Lässer C, Szabó TG, et al. Distinct RNA profiles in subpopulations of extracellular vesicles: apoptotic bodies, microvesicles and exosomes. J Extracell Vesicles [ Internet]. 2013;2:1–10. Available from: http://www.journalofextracellularvesicles.net/index.php/jev/article/view/20677/30150.
- Ratajczak J, Miekus K, Kucia M, et al. Embryonic stem cell-derived microvesicles reprogram hematopoietic progenitors: evidence for horizontal transfer of mRNA and protein delivery. Leukemia [ Internet]. 2006;20:847–856. Available from: http://www.nature.com/articles/2404132.
- Valadi H, Ekström K, Bossios A, et al. Exosome-mediated transfer of mRNAs and microRNAs is a novel mechanism of genetic exchange between cells. Nat Cell Bio [ Internet]. 2007;9:654–659. Available from: http://www.nature.com/articles/ncb1596.
- Zomer A, Maynard C, Verweij FJ, et al. In vivo imaging reveals extracellular vesicle-mediated phenocopying of metastatic behavior. Cell. 2015;161:1046–1057.
- Balaj L, Lessard R, Dai L, et al. Tumour microvesicles contain retrotransposon elements and amplified oncogene sequences. Nat Commun [ Internet]. 2011;2:1–9. Available from: https://www.nature.com/articles/ncomms1180.
- Farkash EA, Kao GD, Horman SR, et al. Gamma radiation increases endonuclease-dependent L1 retrotransposition in a cultured cell assay. Nucleic Acids Res. 2006;34:1196–1204.
- Kanada M, Bachmann MH, Hardy JW, et al. Differential fates of biomolecules delivered to target cells via extracellular vesicles. Proc Natl Acad Sci [ Internet]. 2015;112:E1433–E1442. Available from: http://www.pnas.org/lookup/doi/10.1073/pnas.1418401112.
- Nishida-Aoki N, Tominaga N, Takeshita F, et al. Disruption of circulating extracellular vesicles as a novel therapeutic strategy against cancer metastasis. Mol Ther [ Internet]. 2017;25:181–191.
- Garcia-Perez JL, Morell M, Scheys JO, et al. Epigenetic silencing of engineered L1 retrotransposition events in human embryonic carcinoma cells. Nature [ Internet]. 2010;466:769–773.
- Philippe C, Vargas-Landin DB, Doucet AJ, et al. Activation of individual L1 retrotransposon instances is restricted to cell-type dependent permissive loci. Elife [ Internet]. 2016;5:1–30. Available from: https://elifesciences.org/articles/13926.
- Rangwala SH, Kazazian HH. The L1 retrotransposition assay: A retrospective and toolkit [Internet]. Methods. San Diego (CA): Academic Press. Elsevier Inc.;2009;49:219–226. DOI:10.1016/j.ymeth.2009.04.012. Available from: https://doi.org/10.1016/j.ymeth.2009.04.012.
- Ostertag EM, Prak ET, DeBerardinis RJ, et al. Determination of L1 retrotransposition kinetics in cultured cells. Nucleic Acids Res [ Internet]. 2000;28:1418–1423. Available from: http://www.ncbi.nlm.nih.gov/entrez/query.fcgi?cmd=Retrieve&db=PubMed&dopt=Citation&list_uids=10684937.
- Coufal N, Garcia-Perez JL, Peng G, et al. L1 retrotransposition in human neural progenitor cells. Nature [ Internet]. 2009;460:1127–1158.
- Goodier JL. Restricting retrotransposons: a review. Mob DNA [ Internet]. 2016;7:16. Available from:: http://mobilednajournal.biomedcentral.com/articles/10.1186/s13100-016-0070-z.
- Yang N, Zhang L, Zhang Y, et al. An important role for RUNX3 in human L1 transcription and retrotransposition. Nucleic Acids Res. 2003;31:4929–4940.
- Farkash EA, Prak ETL. DNA damage and L1 retrotransposition. J Biomed Biotechnol. 2006;2006:1–8.
- Goodier JL, Zhang L, Vetter MR, et al. LINE-1 ORF1 protein localizes in stress granules with other RNA-binding proteins, including components of RNA interference RNA-induced silencing complex. Mol Cell Biol. 2007;27:6469–6483.
- Doucet AJ, Hulme AE, Sahinovic E, et al. Characterization of LINE-1 ribonucleoprotein particles. PLoS Genet. 2010;6:1–19.
- Zomer A, Tineke V, Hopmans ES, et al. Exosomes Fit to deliver small RNA. Commun Integr Biol. 2010;3:447–450.
- Bogerd HP, Wiegand HL, Hulme AE, et al. Cellular inhibitors of long interspersed element 1 and Alu retrotransposition. Proc Natl Acad Sci [ Internet]. 2006;103:8780–8785. Available from: http://www.pnas.org/content/103/23/8780.abstract.
- Kinomoto M, Kanno T, Shimura M, et al. All APOBEC3 family proteins differentially inhibit LINE-1 retrotransposition. Nucleic Acids Res. 2007;35:2955–2964.
- Muckenfuss H, Hamdorf M, Held U, et al. APOBEC3 proteins inhibit human LINE-1 retrotransposition. J Biol Chem. 2006;281:22161–22172.
- Stenglein MD, Harris RS. APOBEC3B and APOBEC3F inhibit L1 retrotransposition by a DNA deamination-independent mechanism. J Biol Chem. 2006;281:16837–16841.
- Lovsin N, Peterlin BM. APOBEC3 proteins inhibit LINE-1 retrotransposition in the absence of ORF1p binding. Ann N Y Acad Sci. 2009;1178:268–275.
- Hu S, Li J, Xu F, et al. SAMHD1 inhibits LINE-1 retrotransposition by promoting stress granule formation. PLoS Genet. 2015;11:1–27.
- Wei Z, Batagov AO, Schinelli S, et al. Coding and noncoding landscape of extracellular RNA released by human glioma stem cells. Nat Commun [ Internet]. 2017;8:1145. Available from: http://www.nature.com/articles/s41467-017-01196-x.
- Wei W, Gilbert N, Ooi SL, et al. Human L1 retrotransposition: cis preference versus trans complementation. Mol Cell Biol [ Internet]. 2001;21:1429–1439. Available from: http://www.ncbi.nlm.nih.gov/pubmed/11158327.
- Khazina E, Truffault V, Büttner R, et al. Trimeric structure and flexibility of the L1ORF1 protein in human L1 retrotransposition. Nat Struct Mol Biol [ Internet]. 2011;18:1006–1014. Available from: http://www.nature.com/articles/nsmb.2097.
- Basame S, Wai-lun Li P, Howard G, et al. Spatial assembly and RNA binding stoichiometry of a LINE-1 protein essential for retrotransposition. J Mol Biol [ Internet]. 2006;357:351–357. Available from: http://linkinghub.elsevier.com/retrieve/pii/S0022283605016396.
- Dai L, LaCava J, Taylor MS, et al. Expression and detection of LINE-1 ORF-encoded proteins. Mob Genet Elements [ Internet]. 2014;4:e29319. Available from: http://www.tandfonline.com/doi/abs/10.4161/mge.29319.
- Luke GA, Roulston C, Odon V, et al. Lost in translation. Mob Genet Elements [ Internet]. 2013;3:e27525. Available from: http://www.tandfonline.com/doi/abs/10.4161/mge.27525.
- Moran J, Holmes S, Naas T. High frequency retrotransposition in cultured mammalian cells. Cell [ Internet]. 1996;87:917–927. Available from: http://www.sciencedirect.com/science/article/pii/S0092867400819984.
- Feng Q, Moran JV, Kazazian HH, et al. Human L1 retrotransposon encodes a conserved endonuclease required for retrotransposition. Cell. 1996;87:905–916.
- Gasior SL, Wakeman TP, Xu B, et al. The human LINE-1 retrotransposon creates DNA double-strand breaks. J Mol Biol. 2006;357:1383–1393.
- Belgnaoui SM, Gosden RG, Semmes OJ, et al. Human LINE-1 retrotransposon induces DNA damage and apoptosis in cancer cells. Cancer Cell Int. 2006;6:1–10.
- Shi X, Seluanov A, Gorbunova V. Cell divisions are required for L1 retrotransposition. Mol Cell Biol. 2007;27:1264–1270.
- Xie Y, Mates L, Ivics Z, et al. Cell division promotes efficient retrotransposition in a stable L1 reporter cell line. Mob DNA. 2013;4:1–10.
- Hancks DC, Kazazian HH. Active human retrotransposons: variation and disease. Curr Opin Genet Dev [ Internet]. 2012;22:191–203.
- Kazazian HH. Mobile elements: drivers of genome evolution. Science [ Internet]. 2004;303:1626–1632. Available from: http://www.sciencemag.org/content/303/5664/1626.full.pdf%5Cnhttp://www.ncbi.nlm.nih.gov/pubmed/15016989.
- Miki Y, Nishisho I, Horii A, et al. Disruption of the APC gene by a retrotransposal insertion of L1 sequence in a colon cancer. Cancer Res. 1992;52:643–645.
- Holmes SE, Dombroski BA, Krebs CM, et al. A new retrotransposable human L1 element from the LRE2 locus on chromosome 1q produces a chimaeric insertion. Nat Genet. 1994.
- Meischl C, De Boer M, Åhlin A, et al. A new exon created by intronic insertion of a rearranged LINE-1 element as the cause of chronic granulomatous disease. Eur J Hum Genet. 2000.
- Schwahn U, Lenzner S, Dong J, et al. Positional cloning of the gene for X-linked retinitis pigmentosa 2. Nat Genet. 1998.
- Van Den Hurk JAJM, Van De Pol DJR, Wissinger B, et al. Novel types of mutation in the choroideremia (CHM) gene: A full-length L1 insertion and an intronic mutation activating a cryptic exon. Hum Genet. 2003.
- Sciamanna I, De Luca C, Spadafora C. The reverse transcriptase encoded by LINE-1 retrotransposons in the genesis, progression, and therapy of cancer. Front Chem. 2016;4.
- Sottoriva A, Kang H, Ma Z, et al. A big bang model of human colorectal tumor growth. Nat Genet. 2015;47:209–216.
- Klein CA. Parallel progression of primary tumours and metastases. Nat Rev Cancer. 2009;9:302–312.
- Doucet-O’Hare TT, Sharma R, Rodić N, et al. Somatically acquired LINE-1 insertions in normal esophagus undergo clonal expansion in esophageal squamous cell carcinoma. Hum Mutat. 2016;37:942–954.
- Rodić N, Steranka JP, Makohon-Moore A, et al. Retrotransposon insertions in the clonal evolution of pancreatic ductal adenocarcinoma. Nat Med [ Internet]. 2015;21:1060–1064. Available from: http://www.nature.com/doifinder/10.1038/nm.3919.
- Burns MB, Temiz NA, Harris RS. Evidence for APOBEC3B mutagenesis in multiple human cancers. Nat Genet [ Internet]. 2013;45:977–983. Available from: http://www.nature.com/doifinder/10.1038/ng.2701.
- Roberts SA, Lawrence MS, Klimczak LJ, et al. An APOBEC cytidine deaminase mutagenesis pattern is widespread in human cancers. Nat Genet [ Internet]. 2013;45:970–976. Available from: http://www.pubmedcentral.nih.gov/articlerender.fcgi?artid=3789062&tool=pmcentrez&rendertype=abstract.
- Kuong KJ, Loeb LA. APOBEC3B mutagenesis in cancer. Nat Genet [ Internet]. 2013;45:964–965. Available from: http://www.pubmedcentral.nih.gov/articlerender.fcgi?artid=3965181&tool=pmcentrez&rendertype=abstract.
- Middlebrooks CD, Banday AR, Matsuda K, et al. Association of germline variants in the APOBEC3 region with cancer risk and enrichment with APOBEC-signature mutations in tumors. Nat Genet [ Internet]. 2016;48:1330–1338. Available from: http://www.nature.com/doifinder/10.1038/ng.3670.