
 ?Mathematical formulae have been encoded as MathML and are displayed in this HTML version using MathJax in order to improve their display. Uncheck the box to turn MathJax off. This feature requires Javascript. Click on a formula to zoom.
ABSTRACT
This study sought to measure medium-sized extracellular vesicles (mEVs) in plasma, when patients have low Plasmodium falciparum early in infection. We aimed to define the relationship between plasma mEVs and: (i) parasitaemia, (ii) period from onset of malaria symptoms until seeking medical care (patient delay, PD), (iii) age and (iv) gender. In this cross-sectional study, n = 434 patients were analysed and Nanosight Tracking Analysis (NTA) used to quantify mEVs (vesicles of 150–500 nm diameter, isolated at 15,000 × g, β-tubulin-positive and staining for annexin V, but weak or negative for CD81). Overall plasma mEV levels (1.69 × 10¹⁰ mEVs mL−1) were 2.3-fold higher than for uninfected controls (0.51 × 10¹⁰ mEVs mL−1). Divided into four age groups, we found a bimodal distribution with 2.5- and 2.1-fold higher mEVs in infected children (<11 years old [yo]) (median:2.11 × 10¹⁰ mEVs mL−1) and the elderly (>45 yo) (median:1.92 × 10¹⁰ mEVs mL−1), respectively, compared to uninfected controls; parasite density varied similarly with age groups. There was a positive association between mEVs and parasite density (r = 0.587, p < 0.0001) and mEVs were strongly associated with PD (r = 0.919, p < 0.0001), but gender had no effect on plasma mEV levels (p = 0.667). Parasite density was also exponentially related to patient delay. Gender (p = 0.667) had no effect on plasma mEV levels. During periods of low parasitaemia (PD = 72h), mEVs were 0.93-fold greater than in uninfected controls. As 75% (49/65) of patients had low parasitaemia levels (20–500 parasites µL−1), close to the detection limits of microscopy of Giemsa-stained thick blood films (5–150 parasites µL−1), mEV quantification by NTA could potentially have early diagnostic value, and raises the potential of Pf markers in mEVs as early diagnostic targets.
Introduction
The latest WHO World Malaria Report 2018 showed, for 2017, that there were 435,000 deaths from malaria [Citation1], the most vulnerable group, under 5 years of age, accounting for 61% (266,000) of deaths worldwide. Attempts to eradicate malaria through concerted programmes of antimalarial drug treatment as well as vector control have lowered the incidence in Africa by 17% and mortality by 26%, since 2000 [Citation2,Citation3]. The Plasmodium parasite however has adapted to these programmes placing malaria amongst the deadliest diseases [Citation4] with the vast majority of cases and deaths still particular to Africa [Citation2]. In Ghana, of the 5 species infecting humans, only three species occur: P. falciparum, P. ovale and P. malariae [Citation5], P. falciparum being the most common (90–98% of infections), followed by P. malariae (2–9% of infections) and then P. ovale (1%). Although there are simple interventions that can be adopted to minimize the impact of the disease, such as proper use of insecticide impregnated nets, prophylaxis and early reporting of infection, many of these measures have not delivered the expected impact [Citation6]. In many communities, particularly rural ones, the disease may be exacerbated as there is usually a delay in reporting malaria infection for medical attention after infection [Citation7]. This may happen for many reasons, amongst which is poor public health awareness, lack of finance and an over reliance on self-medication [Citation8]. Such delays in receiving proper medical assessment and care, allow the malaria parasites to rapidly proliferate. This may stimulate the release of Extracellular Vesicles (EVs) from parasitized erythrocytes as well as other activated cells [Citation9,Citation10]. These EVs include medium-sized EVs (mEVs) (also known as microvesicles [MVs]), defined as having been isolated at 10–20,000 × g [Citation11,Citation12], of 150–500 nm diameter, and expressing typical medium-sized EV markers (such as β-tubulin) but negative or with low expression of small-sized EV markers (CD81) [Citation12,Citation13].
mEVs, expressing a macromolecular profile reminiscent of the parent cell [Citation14], are shed from the plasma membrane either as a result of normal cell physiology [Citation15] or in increased numbers due to cellular stress or damage [Citation16], including endoplasmic reticulum stress and resulting inflammation [Citation17] and during early apoptosis [Citation18]. Erythrocyte mEVs are released constitutively at basal levels [Citation19] but oxidative stress, ATP depletion, and calcium ionophore (A23187) may all stimulate release [Citation20]. Increased levels of mEVs are also an indicator of infectious disease [Citation21]; mEVs isolated from patients infected with malaria parasites carry an enriched mixture of host proteins (including complement proteins) and expressed malaria proteins [Citation10,Citation22] and their interactions with monocytes and macrophages usually create a pro-inflammatory response [Citation23,Citation24]. In view of the roles EVs play in facilitating infection [Citation25–Citation27] and in particular in the pathogenesis of cerebral malaria [Citation28], but also in all stages of cancer progression [Citation29], there has been a general need to modulate their release. To that end we and others have recently described a range of pharmacological agents able to inhibit mEV release from cells [Citation30–Citation34], including bacteria [Citation35,Citation36].
In mouse infection models using ABCA1 knockouts, plasma mEV levels rose significantly more in ABCA1+/+ mice during infection compared to ABCA1−/−, and these ABCA1 KO mice were protected from cerebral malaria (CM) [Citation37]. The sequestration of parasitized cells in blood vessels possibly resulting in CM pointed to an additional role of mEVs in parasite cytoadherence [Citation38]; similarly Giardia intestinalis mEVs help mediate attachment of the trophozoites to intestinal epithelial cells [Citation39]. In falciparum malaria, infected erythrocytes (iErys) release mEVs that have an increased expression of phosphatidylserine [Citation40] and play a role in the cytoadhesion of iErys [Citation41].
Understanding host-parasite interactions, through the role of mEV-mediated intercellular communication, as reviewed elsewhere [Citation25,Citation42] will offer opportunities to manage childhood malaria. Recently, exosome-like vesicles released from malaria-infected erythrocytes were shown to mediate intercellular communication [Citation10,Citation43], and in other work on host mEVs in infection, it was shown that T. cruzi metacyclic trypomastigotes induced mEV release from blood cells in mice, early in infection [Citation44]. These host mEVs provided the parasite with protection against activated host complement attack, resulting in increased parasite survival in an infection model of T. cruzi in mice. The release of host-derived mEVs stimulated by intracellular parasites, which may on the one hand function as a decoy, may thus also be used opportunistically by such pathogens to enhance infection [Citation45].
Accurate and early diagnosis of malaria remains an essential strategy for bringing about early treatment, to reduce the risk of severe disease, and so prevent further transmission [Citation7]. Whilst the main diagnostic test for malaria remains the identification of parasites in blood films by microscopy, there are alternatives. These include the rapid diagnostic test that detects antigen (but lacks sensitivity), serology using ELISA or IFA to detect previous infection and molecular tests, which are the most accurate, but also expensive. There is therefore still a need to develop technologies with improved throughput and cost effectiveness, for use in the field [Citation46]. As the possibility of using EVs in the diagnosis of various diseases gains traction [Citation47], the prospect of using plasma EVs as a potential target for diagnosis of infectious disease is in particular gaining interest [Citation21].
Studies on mEV quantification in plasma have hitherto been of limited size and not used the latest technologies. Whilst increased mEV levels have been shown recently in malaria [Citation9,Citation48,Citation49] two of these studies were small: n = 36 [Citation9]; n = 37 [Citation49], and a third specifically enumerated circulating endothelial mEVs (“microparticles”) [Citation48]. To make our large cross-sectional study more comparable with these earlier studies we also measured plasma mEV levels, but used nanosight tracking analysis (NTA) (as opposed to flow cytometry) for increased accuracy.
In this study carried out over the course of one year in Ghana, we investigated parasitaemia and corresponding plasma mEV levels that occur when malaria infection is not reported early enough. Blood samples of patients were analysed, based on the period from the onset of symptoms related to malaria (temperature of ≥38°C, vomiting, headaches, muscle pain or diarrhoea) until seeking medical healthcare, the so-called Patient Delay (PD) [Citation50–Citation52]. We set out to quantify mEVs in patients infected with P. falciparum and to ascertain whether there was any possible influence of parasitaemia levels and/or PD as well as age or gender of patients.
Materials and methods
Ethics
The protocols for obtaining plasma mEV samples from patients infected with malaria, and uninfected donor controls, were approved by the Ethics Committee of the School of Biomedical and Allied Health Sciences, Noguchi Memorial Institute for Medical Research, University of Ghana (NIACUC-2017-02-1Y).
Subjects
The inclusion criteria for uncomplicated malaria which governed the selection of volunteers for this study (n = 434, median age 27.3 years; M/F ratio 1.27) included a temperature ≥38°C, P. falciparum-positive Giemsa-stained blood film and positive results for P. falciparum (using the Rapid Diagnostic Test [RDT] described below) as well as negative tests for other Plasmodium spp. as shown by nested PCR and microscopy of peripheral blood slides. Gender and age-matched (±3 years) uninfected controls, recruited from the healthy community (median age 28.8 years; M/F ratio = 1.005) were also included, giving a falciparum malaria-infected to uninfected ratio of 1:1.83. Exclusion criteria for this study included HIV, bacterial co-infection, diabetes, pregnancy, smoking, autoimmune disease, Alzheimer’s and whether anti-malarials (quinine or artemesinin combination therapy) had been taken in the previous 6 months. As levels of erythrocyte mEVs are raised in certain haemoglobinopathies including sickle cell anaemia (SCA) [Citation53], β-thalassaemia [Citation54] and glucose-6-phosphate dehydrogenase (G6PD) deficiency [Citation55], these patients were also excluded from the study. Patients, particularly children and the elderly showing symptoms or early warnings of severe malaria [Citation56], or other life-threatening infections were referred to a health clinic, and also excluded.
The 434 patients, from the Western region of Ghana, aged between 6 months and 70 years were incorporated into the study after providing written consent in accordance with ethical committee guidelines from the University of Ghana, College of Health Sciences, for work on human subjects (see above). For all cases presenting with mild symptoms of infection (uncomplicated malaria), as we were unable to report the exact duration of fever or of clinical symptoms, we reported the “patient delay,” PD [Citation50–Citation52] or “delay in seeking healthcare,” defined as the period (≥24 h) between onset of symptoms (temperature ≥38°C, vomiting, headaches, muscle pain or diarrhoea) until seeking medical healthcare. Patients were treated with antimalarials (a standard course of artemisinin based derivative combination therapy) and other support therapies. Venous blood (5 mL) was taken from the antecubital vein of each patient or donor using a 21-gauge needle and collected in a 4.5 mL vacutainer (BD Biosciences) with acid-citrate-dextrose (with gentle inversion to mix with anticoagulant), having discarded the first 1 mL. Samples were further processed within 30 min of phlebotomy. To obtain platelet poor plasma the tubes were spun twice at 2,500 × g for 15 min. Haemoglobin levels and haematocrit were calculated using a haematology analyser.
Light microscopy and parasitaemia count
The patients’ blood (5 µL) from a venous blood specimen was used to make both a thick and a thin blood smear. To stain the malaria parasites, the thick films were stained in 10% Giemsa stain and the thin films with a Field’s stain. After drying at room temperature, the slides were examined under a microscope using a 100× objective lens. Malaria parasites were identified by their physical features and by the appearance of the infected erythrocytes.
The number of circulating parasites was ascertained as follows: Having identified the area of the thick smear with an even distribution of 10–20 WBC per field, examination was continued of high power fields, determining the number of P. falciparum parasites (asexual blood stage forms) per 200 or 500 WBCs (for lower parasite densities). Parasite density was calculated as follows:
Malaria rapid diagnostic tests (RDTs)
Malaria RDTs were used to test the presence of P. falciparum and to thus confirm the results of the microscopy test. All RDTs were equilibrated to room temperature prior to use. If any colour change was noted in the desiccant, the RDT was discarded. RDTs were labelled with patient ID, dilution, and the date when the test was performed, which was carried out according to the manufacturer’s instructions.
mEV isolation and flow cytometry (FCM)
Citrate plasma from blood was collected as described above. In view of the importance of adhering to standard isolation and characterization protocols [Citation57], such procedures were carried out according to the standards recommended by the International Society for Extracellular Vesicles (ISEV) [Citation58,Citation59]. To isolate mEVs as described before [Citation22,Citation32,Citation60] with minor modifications, 2-fold diluted plasma was gently sonicated using a sonicating water-bath (Townson and Mercer Ltd, Croydon) for 5 × 1 min, in order to gently disperse any aggregated exosomes prior to centrifugation at 15,000 × g for 40 min to pellet mEVs, which were then washed in the same volume of sterilized and filtered (0.22 µm pore size) phosphate buffered saline (sPBS). For practical reasons, this washing step was used to reduce levels of lipoproteins, protein aggregates and other plasma material [Citation61] rather than size-exclusion chromatography [Citation62] or density gradient centrifugation [Citation63]. The supernatant was discarded and the pellet containing the mEVs re-suspended in 200 µL of sPBS. Where necessary, mEVs were frozen at −80°C for shipment on dry ice. The mEV samples (diluted 1:40 in sPBS) were then quantified using Nanosight Tracking Analysis (see section on Nanosight Tracking Analysis). To isolate sEVs, the supernant from the 15,000 × g above, was centrifuged at 100,000 × g, for 90 min, washed in EV-free sPBS (100,000 × g/90 min) and resuspended in EV-free sPBS.
Flow cytometry was carried out as described before [Citation55,Citation64]. Essentially, the mEVs were resuspended in annexin V (AnV) Binding Buffer (AbCam) and stained with AnV-FITC (R&D Systems, UK) for detection of PS on a BD FACSAriaTM flow cytometer utilizing the 1-log more sensitive FSC-PMT (forward scatter photomultiplier tube). FlowJo v10.0.7 (Treestar) was used to analyse the data. As a baseline control, mEVs were isolated from plasma samples of age- and sex-matched uninfected donors.
EV size and concentration determination by nanosight tracking analysis (NTA; nanosightTM)
NTA was carried out as described previously [Citation32,Citation65] to reveal the size distribution and concentration of isolated mEVs using a NanoSight NS300 (equipped with a sCMOS camera and 405 nm diode laser; Malvern scientific). Data were acquired and processed by one operator throughout the study, using NTA software version 3.00, based on the minimal information for studies of EVs (MISEV) [Citation58,Citation59]. With the ambient temperature taken from the temperature probe and applied to the software before each reading, settings for the minimum track length and blur and particle size were also applied. The NTA was calibrated each day to ensure consistency between daily readings using a 100 nm diameter polystyrene bead standard (Malvern Scientific). Samples were diluted to maintain 20–40 particles per field of view and 6 × 30 s videos recorded (at camera level 11), the background signal (from background contamination) being subtracted before further processing; for analysis, at least 1,000 completed tracks were required per measurement (each sample being read in triplicate). Absolute number concentrations of mEVs were obtained using the following equation:
. Analyses were always carried out at the same settings (detection limit 3). The quantification of mEVs is described throughout in absolute number concentrations of mEVs expressed as the median and modal sizes ± 95% confidence interval (CI), as well as size ranges of mEVs. NTA analysis was also used to provide the mean with 95% CI. Fold-change in terms of EV numbers has been defined throughout as the ratio of the difference between the final and initial values and the initial value. Fold-change was converted to % change by multiplying by 100.
Transmission electron microscopy (TEM)
For TEM, mEVs were stained with 2% aqueous uranyl acetate, placed on 400-mesh copper Pioloform grids and pre-treated with aqueous Alcian blue 8GX (1%) for 10 min. Using a digital camera, images were recorded on a JEOL JEM 1200 EX II transmission electron microscope.
Western blotting analysis
mEV lysates, normalized for protein content using the BCA protein assay (Thermo Fisher) were prepared and subjected to SDS-PAGE [Citation66]. Reversible zinc staining (Pierce™ Zinc Stain Kit) was carried out prior to transfer. After recording the staining as a loading control, the gel was destained according to the manufacturer’s protocols, prior to Western blotting, which was carried out as described before [Citation66]. Samples were probed for expression of mEV/sEV markers (using β-tubulin/CD81 (both mouse monoclonal antibodies from Abcam at 1:1,000)). Throughout, the secondary antibody was goat anti-mouse HRP conjugate (Bio-Rad; 1:5,000).
Statistical analysis
Statistical analysis was carried out using GraphPad Prism 6.04 and 8.1.0 (GraphPad Software Inc., La Jolla, CA). Differences in medians of mEV levels was analysed using a Wilcoxon signed rank test. P values (all two-sided) of <0.05 were considered statistically significant. Correlations between plasma mEVs and age, parasitaemia and PD were assessed by measuring Pearson’s correlation coefficient (r). To model plasma mEV level dependency with age, procedures to fit models that are linear and quadratic (second-order polynomial, which describes a parabola) were employed; hyperbolic functions were fitted to data for mEV plasma level variation with parasitaemia. The statistical significance of the effect of gender on mEV levels was tested using the Mann–Whitney U-test.
Results
Plasma mEVs are significantly raised in Plasmodium falciparum infected patients
The clinical data and a summary of the main haematological profile of the patients with falciparum malaria (median age 27.3 years), in this study that met all the inclusion criteria as well as that for the uninfected controls, are presented in . Over the course of the study, samples that fell within the exclusion criteria were not included. Data collected over 1 year, of patients infected with Plasmodium falciparum was grouped into those of low parasitaemia (20–50 and 51–500 parasites µL−1), intermediate parasitaemia (501–8,000 parasites µL−1) and high parasitaemia (8,001–40,000 parasites µL−1). Analysis revealed that 62% of the 434 patients who suffered a ≥ 4d “patient delay” (PD) (period from the onset of symptoms to seeking medical care, also known as period of acute illness [Citation50–Citation52]) had increased levels of parasitaemia (501–40,000) ( and supplementary Figure S1).
Table 1. Demographic and haematological characteristics of Plasmodium falciparum patients (n = 434).
Table 2. Patient delay, PD (time between first symptoms and seeking medical attention [or period of acute illness]) and level of parasitaemia measured.
mEVs derived from plasma of infected patients in the range 80–480 nm, based on NTA analysis () and electron microscopy, compared favourably with other size estimates from electron microscopy () of 100–400 nm diameter, albeit specifically for erythrocyte mEVs in malaria infection [Citation10]. Because of the overlapping size distribution of sEVs and mEVs, the expression levels of markers typical of both vesicle sub-types was assessed. Western blot analysis showed expression of expected markers for mEVs (β-tubulin, a cytoplasmic marker) but absent in sEVs isolated from infected pools (12–44 yo); the sEV tetraspanin marker, CD81 (a plasma membrane associated protein), was found in sEVs and showed only weak expression in mEVs (). Flow cytometric analysis of infected patients and uninfected donors, is shown by representative forward/side scatter plots in , respectively, and in the plots below, mEVs were found to stain for Annexin V (indicating exposition of phosphatidylserine). This was as expected, certainly for mEVs released from infected erythrocytes [Citation40].
Figure 1. Plasma mEVs in P. falciparum infected patients.
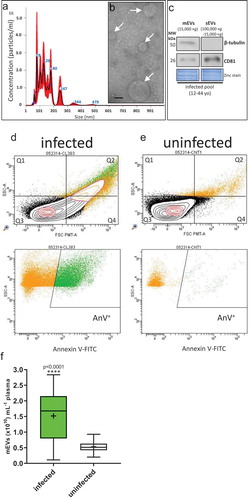
Overall, we found a significant 2.3-fold (230%) increase for mEV counts of P. falciparum-infected patients (median 1.69 × 10¹⁰ mEVs mL−1 [95%CI: 1.52–1.83 × 10¹⁰ mEVs mL−1]) compared with uninfected donors (median 0.514 × 10¹⁰ mEVs mL−1 [95%CI: 0.461–0.563 × 10¹⁰ mEVs mL−1]) (age- and sex-matched controls (p < 0.0001) (). Although there is the possibility in patients with high parasitaemia that merozoites (1.5 µm × 1.0 µm [Citation67]) and haemozoin (1 µm long crystals [Citation68]) could be co-purified with mEVs by centrifugation, the presence of such material does not affect the accuracy of NTA analysis [Citation69]. Our estimation of a circulating basal level of mEVs in uninfected donors (0.514 × 10¹⁰ mEVs mL−1 [95%CI: 0.461–0.563 × 10¹⁰ mEVs mL−1]) lies within the range previously described in the blood of uninfected individuals, typically 0.17 × 10¹⁰–2.4 × 10¹⁰ mEVs mL−1 [Citation33,Citation70] and 0.3 × 10¹⁰ mEVs mL−1 [Citation71]. Although increased numbers of circulating mEVs have been identified in individuals presenting with infectious disease [Citation72–Citation74], this has not been accurately quantified previously for malaria infection.
Elevated levels of plasma mEVs in young and old patients with low level falciparum malaria infection
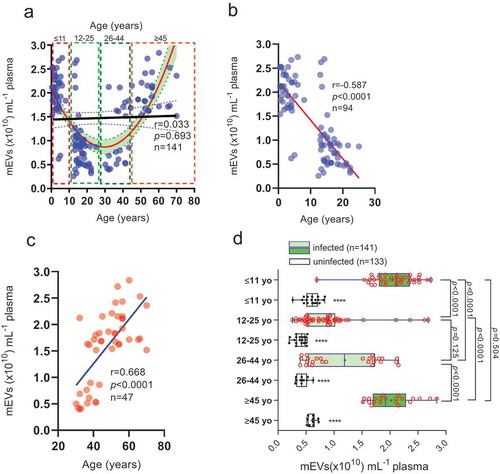
We found no direct relationship (r = 0.033, p = 0.693) between plasma mEV levels and age (0.5–70 yo) (). However, the curve that best fit the data across the whole cohort was a parabola (a > 0, opening upwards; R2 = 0.43) suggesting some age-related element to mEV release, with plasma mEV levels decreasing between 0.5–25 yo patients and increasing in the 26–70 yo range. Upon closer examination we found a negative correlation in the age range 0.5–25 yo (, Pearson’s r = −0.587; p < 0.0001) and a positive one in the 26–70 yo age range (, Pearson’s r = 0.668; p < 0.0001) The cohort, which was restricted to those with parasitaemia levels of 51–500 parasites µL−1 (n = 141) was then divided into four age groups (), ≤11 yo (n = 36), 12–25 yo (n = 42), 26–44 yo (n = 43) and ≥45 yo (n = 20); neither gender nor haemoglobin levels showed significant difference between the age groups. We observed a “bimodal” age distribution with respect to plasma mEV levels (). Plasma mEV levels in children ≤11 yo were 1.43-fold (143%) and 0.78-fold (78%) greater than for 12–25 yo and 26–44 yo, respectively, (both p < 0.0001) and mEV levels in adults ≥45 yo were 1.21-fold (121%) and 0.63-fold (63%) greater than for 12–25 yo and 26–44 yo, respectively, (both p < 0.0001). In infected children under 11 yo (median plasma mEVs: 2.11 × 10¹⁰ mEVs µL−1) and infected adults over 45 years of age (median plasma mEVs: 1.92 × 10¹⁰ mEVs µL−1), mEV levels were 2.5-fold (250%) and 2.1-fold (210%) greater, than their respective uninfected controls (). However, in infected 12–25 yo (median 0.869 × 10¹⁰ plasma mEVs mL−1) and 26–44 yo (median 1.189 × 10¹⁰ plasma mEVs mL−1), mEV levels were only 1.1-fold (110%) and 1.8-fold (180%) greater than respective uninfected controls. These infected versus uninfected fold changes in plasma mEVs, are summarized in Figure S2, essentially confirming plasma mEV levels to be significantly raised in infected compared to uninfected young children and the elderly. In view of 86% of victims of malaria arising globally in children under the age of 5 [Citation75], and 61% of suspected malaria cases in Ghana being in the under-fives [Citation75], our finding, from a large sample size, is significant. Interestingly, we also found a similar though less distinct trend in the uninfected controls (white box and whiskers plots, with filled data points, in ), mEV levels in ≥45 yo being 0.5-fold (50%) greater than both 26–44 yo (p < 0.0001) and 12–25 yo (p < 0.0001) groups. Similarly, mEV levels in ≤11 yo were 0.45-fold (45%) greater than both 26–44 yo (p < 0.0001) and 12–25 yo (p < 0.0001) groups. There was no significant difference between mEV levels of infected 12–25 yo and 26–44 yo (p = 0.125) or infected ≤11 yo and ≥45 yo (p = 0.504).
Figure 2. Plasma mEV levels are significantly higher, at low parasitaemia levels, in infected young Ghanain children and the elderly.
Parasite density which relates to plasma mEV levels, is highest in the young and elderly
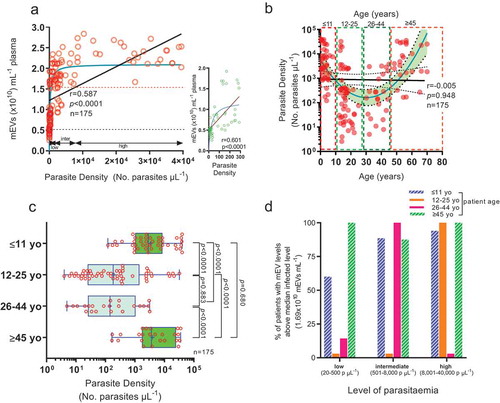
With relation to parasitaemia, we found plasma mEV levels to have a hyperbolic relationship (R2 = 0.65) (), and whilst correlation analysis suggested that increased levels of parasitaemia relate with increased mEV levels (Pearson’s rank correlation, r = 0.587, p < 0.0001), the linear equation did not fit as well as the rectangular hyperbola. This rise of plasma mEV levels was also marked (r = 0.6) across a very limited increase in parasitaemia at “low” parasite densities (5–300 parasites μL−1) (, inset). In view of the association of parasitaemia and plasma mEV levels and the “bimodal” age distribution of plasma mEV levels showing peaks in the very young (≤11 yo) and elderly (≥45 yo) (), we looked for any similar trend between parasitaemia and age. The relationship between log-transformed parasite density and age allowed the fitting of a parabola, , (a > 0, opening upwards; R2 = 0.35), on a semi-log scale, but with no linear relationship between parasitaemia and age across the whole cohort (0.5–70 yo); r = −0.005, p = 0.95. The parabolic relationship with peaks in parasitaemia in the young and elderly, more clearly demonstrated in and Figure S3, is likely due to these groups having lower levels of immunity or defective immunity to malaria, which would allow multiplication of the parasite (reflected in higher concomitant mEV levels). Looking at the raised levels of plasma mEVs already at low parasitaemia levels (20–500 parasites µL−1) it was not surprising that the percentage of infected patients with mEVs above the median value (1.69 × 10¹⁰ mEVs mL−1), represented by the dotted red line in , was highest, especially at these low parasite levels, amongst children and the elderly (). As part of future work, it would be important to monitor possible correlation between factors not considered, that may affect plasma mEV levels, such as inflammatory markers. The stage of parasite development (ring, trophozoite, schizont stage) which might also affect mEV release however would only affect mEVs released from erythrocytes [Citation9].
Figure 3. Hyperbolic relation between mEVs released and parasitaemia with significantly increased parasitaemia levels in the young and elderly.
mEV levels correlate with patient delay and are raised early in infection
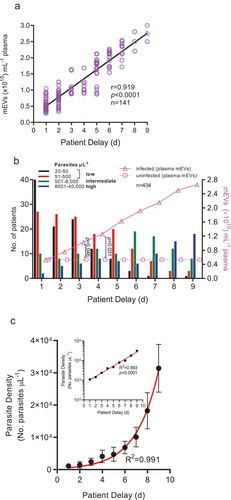
Since PD (in effect the period of acute illness) likely indicates levels of parasitaemia (Figure S1), (which is strongly related with plasma mEV levels ()) therefore PD was unsurprisingly found, in , to be related with elevated plasma mEV levels (r = 0.919, p < 0.0001, R2 = 0.847). Analysis of PD and corresponding infected versus uninfected mEV levels () suggests that patients with low parasitaemia early in infection already have higher plasma mEV levels than healthy controls. This raises the possibility of P. falciparum-specific markers in mEVs being considered as future diagnostic targets. At PD values of 3d, although 49/65 (75%) of patients have low levels of parasitaemia (≤500 parasites µL−1), mEV levels are already 0.93-fold (93%) greater than that of uninfected controls (p = 0.046), whilst at PD = 4d, with 30/50 (60%) of patients with low parasitaemia, mEV levels are 1.38-fold (138%) greater than that of controls (p = 0.031). In view of the hyperbolic relationship between parasitaemia and plasma mEV levels, this is not unexpected, with initial small rises in parasite density producing comparatively large increases in mEV levels. With positive relationships between mEV levels and parasitaemia () and mEV levels and patient delay it was not surprising that there would be some positive trend between parasitaemia and patient delay. Indeed, there was an exponential growth in parasite density with patient delay (). As shown inset in the semi-log plot, this was linearized on a logarithmic axis, thus confirming the exponential increase.
Figure 4. Plasma mEV levels in infected patients are related to patient delay and significantly raised early in infection.
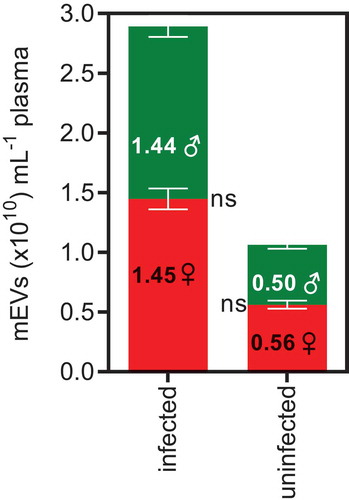
Gender had no influence on mEV levels () in either infected or uninfected individuals (p = 0.667). Of note, our previous study of plasma mEV levels in healthy donors [Citation64] (n = 57) also showed no effect of gender (and only a slight, non-significant decrease with age). This may be important to note as there are significant biochemical and hormonal differences between males and females that as far as we have so far observed, do not impact on mEV release.
Figure 5. Median plasma mEV levels in infected patients and uninfected donors show no differences between males and females.
Discussion
Though previous studies have looked at correlations between the severity of disease and plasma mEV levels, the novelty of this cross-sectional field study is the large number, n = 434, of patients analysed, allowing for more secure conclusions, and also that plasma mEVs were quantified by Nanosight Tracking Analysis. One other study performed in Malawi also showed increased levels of mEVs in children with falciparum malaria aged 0.5–12 yo, although only endothelial mEVs were quantified [Citation48]. In another study carried out by the same group, platelet mEVs were most raised in cerebral malaria patients, but other cell-specific mEVs at raised levels included those from endothelial cells, leukocytes and erythrocytes [Citation76]. Our field study was not restricted to mEVs from any particular cell type, because a variety of different cells including erythrocytes, leukocytes and platelets are likely to generate mEVs following infection. This increased release of mEVs could be through the action of TNF-α [Citation77], for example, which was shown to be especially raised in cerebral malaria [Citation78]. The mEVs were confirmed by detection of mEV markers, electron microscopy and NTA analysis. Exposed PS was also observed; in vivo, exposed PS was found in mEVs from iErys [Citation40] and was thought to possibly be due to brief exposure to febrile temperatures [Citation41].
Our finding of significantly raised plasma mEV levels in young children and the elderly suffering from malaria, at low parasitaemia levels, is important as it points to EVs acting as promising biomarkers for falciparum malaria in these age groups. We also found plasma mEV levels to be significantly raised in patients at a PD of 3d, when the majority of patients still have very low parasitaemia levels. Enumeration of plasma mEVs from malaria-positive blood, by NTA analysis, in early infection, could be developed as an early diagnostic indicator. However, as increased numbers are unlikely to be specific to malaria infection, this could be coupled to the detection of parasite antigens in EVs, by fluorescence NTA, for example. To reduce the numerous steps required for purification by differential centrifugation, novel microfluidic systems which are being developed [Citation79], may be used. Besides detecting parasite antigens in mEVs, EVs from infected erythrocytes carry Plasmodium RNAs [Citation80] and P. falciparum-specific lncRNAs [Citation81,Citation82], non-coding RNAs being released in EVs from infected erythrocytes within 12 h [Citation83], and therefore qRT-PCR could be used to amplify Plasmodium-specific lncRNA in EVs. This would provide a molecular diagnostic for sub-microscopic (0.1–10 parasites μL−1) levels of infection; a similar strategy for detecting Schistosoma EV-derived miRNA was developed recently [Citation84]. This could become an invaluable tool where there is a delay in seeking treatment, especially in travellers returning to countries where malaria is not endemic [Citation7,Citation50,Citation85].
It should also be noted that in this study, any influence of background immunity and thus inflammatory mediators which could also have affected plasma mEV levels, was reduced as much as possible by the infectious and autoimmune diseases included in the exclusion criteria. Nevertheless, this study is now to be followed by a more detailed longitudinal cohort study, assessing an increased range of parameters, beyond mEV levels, including inflammatory cytokines such as TNF-α, at the outset of infection, including in low level malaria and through illness progression.
Supplemental Material
Download MS Word (70.1 KB)Acknowledgments
We are grateful to financial support in terms of a R&D grant from the University of Ghana as well as technical support from the School of Biomedical and Allied Health Sciences. JI was part-funded by IAPP project 612224 (EVEStemInjury), from the REA FP7, Project No. LSC09R R3474.
Supplementary Material
Supplemental data for this article can be accessed here.
Related Research Data
References
- W.H.O., World Malaria Report 2018 (World Health Organization, Geneva, Switzerland, 2018), 2018.
- Mbacham WF, Ayong L, Guewo-Fokeng M, et al. Current situation of malaria in Africa. Methods Mol Biol. 2019;2013:29–13.
- Menkin-Smith L, Winders WT. Malaria (Plasmodium Vivax), StatPearls. Treasure Island (FL): StatPearls PublishingStatPearls Publishing LLC.; 2019.
- Nilsson SK, Childs LM, Buckee C, et al. Targeting human transmission biology for malaria elimination. PLoS Pathog. 2015;11:e1004871.
- Owusu EDA, Brown CA, Grobusch MP, et al. Prevalence of Plasmodium falciparum and non-P. falciparum infections in a highland district in Ghana, and the influence of HIV and sickle cell disease. Malar J. 2017;16:167.
- Schwartz E. Prophylaxis of malaria. Mediterr J Hematol Infect Dis. 2012;4:e2012045.
- Landier J, Parker DM, Thu AM, et al. The role of early detection and treatment in malaria elimination. Malar J. 2016;15:363.
- Ocan M, Bwanga F, Bbosa GS, et al. Patterns and predictors of self-medication in northern Uganda. PloS One. 2014;9:e92323.
- Nantakomol D, Dondorp AM, Krudsood S, et al. Circulating red cell-derived microparticles in human malaria. J Infect Dis. 2011;203:700–706.
- Mantel PY, Hoang AN, Goldowitz I, et al. Malaria-infected erythrocyte-derived microvesicles mediate cellular communication within the parasite population and with the host immune system. Cell Host Microbe. 2013;13:521–534.
- Cvjetkovic A, Lotvall J, Lasser C. The influence of rotor type and centrifugation time on the yield and purity of extracellular vesicles. J Extracell Vesicles. 2014;3:23111.
- Kowal J, Arras G, Colombo M, et al. Proteomic comparison defines novel markers to characterize heterogeneous populations of extracellular vesicle subtypes. Proc Natl Acad Sci U S A. 2016;113:E968–977.
- Tkach M, Kowal J, Thery C. Why the need and how to approach the functional diversity of extracellular vesicles, philosophical transactions of the royal society of London. Series B, Biol Sci. 2018;373:20160479.
- Inal JM, Ansa-Addo EA, Stratton D, et al. Microvesicles in health and disease. Arch Immunol Ther Exp (Warsz). 2012;60:107–121.
- Inal JM, Kosgodage U, Azam S, et al. Blood/plasma secretome and microvesicles. Biochim Biophys Acta. 2013;1834:2317–2325.
- Stratton D, Moore C, Antwi-Baffour S, et al. Microvesicles released constitutively from prostate cancer cells differ biochemically and functionally to stimulated microvesicles released through sublytic C5b-9. Biochem Biophys Res Commun. 2015;460:589–595.
- Collett GP, Redman CW, Sargent IL, et al. Endoplasmic reticulum stress stimulates the release of extracellular vesicles carrying danger-associated molecular pattern (DAMP) molecules. Oncotarget. 2018;9:6707–6717.
- Stratton D, Lange S, Kholia S, et al. Label-free real-time acoustic sensing of microvesicle release from prostate cancer (PC3) cells using a quartz crystal microbalance. Biochem Biophys Res Commun. 2014;453:619–624.
- Jank H, Salzer U. Vesicles generated during storage of red blood cells enhance the generation of radical oxygen species in activated neutrophils. Sci World J. 2011;11:173–185.
- Nguyen DB, Ly TB, Wesseling MC, et al. Characterization of microvesicles released from human red blood cells. Cell Physiol Biochem. 2016;38:1085–1099.
- Schorey JS, Harding CV. Extracellular vesicles and infectious diseases: new complexity to an old story. J Clin Invest. 2016;126:1181–1189.
- Antwi-Baffour S, Adjei JK, Agyemang-Yeboah F, et al. Proteomic analysis of microparticles isolated from malaria positive blood samples. Proteome Sci. 2016;15:5.
- Marti M, Johnson PJ. Emerging roles for extracellular vesicles in parasitic infections. Curr Opin Microbiol. 2016;32:66–70.
- Marcilla A, Martin-Jaular L, Trelis M, et al. Extracellular vesicles in parasitic diseases. J Extracell Vesicles. 2014;3:25040.
- Gavinho B, Rossi IV, Evans-Osses I, et al. A new landscape of host-protozoa interactions involving the extracellular vesicles world. Parasitology. 2018;145:1521–1530.
- Rodrigues M, Fan J, Lyon C, et al. Role of extracellular vesicles in viral and bacterial infections: pathogenesis. Diagnostics, Therapeutics, Theranostics. 2018;8:2709–2721.
- Schwab A, Meyering SS, Lepene B, et al. Extracellular vesicles from infected cells: potential for direct pathogenesis. Front Microbiol. 2015;6:1132.
- Debs S, Cohen A, Hosseini-Beheshti E, et al. Interplay of extracellular vesicles and other players in cerebral malaria pathogenesis, Biochimica et biophysica acta. General Subjects. 2019;1863:325–331.
- Sato S, Weaver AM. Extracellular vesicles: important collaborators in cancer progression. Essays Biochem. 2018;62:149–163.
- Kosgodage US, Trindade RP, Thompson PR, et al. Chloramidine/bisindolylmaleimide-i-mediated inhibition of exosome and microvesicle release and enhanced efficacy of cancer chemotherapy. Int J Mol Sci. 2017;18:1007.
- Kosgodage US, Uysal-Onganer P, MacLatchy A, et al. Cannabidiol affects extracellular vesicle release, miR21 and miR126, and reduces prohibitin protein in glioblastoma multiforme cells. Transl Oncol. 2018;12:513–522.
- Kholia S, Jorfi S, Thompson PR, et al. A novel role for peptidylarginine deiminases in microvesicle release reveals therapeutic potential of PAD inhibition in sensitizing prostate cancer cells to chemotherapy. J Extracell Vesicles. 2015;4:26192.
- Menck K, Sonmezer C, Worst TS, et al. Neutral sphingomyelinases control extracellular vesicles budding from the plasma membrane. J Extracell Vesicles. 2017;6:1378056.
- Jorfi S, Ansa-Addo EA, Kholia S, et al. Inhibition of microvesiculation sensitizes prostate cancer cells to chemotherapy and reduces docetaxel dose required to limit tumor growth in vivo. Sci Rep. 2015;5:13006.
- Kosgodage US, Matewele P, Mastroianni G, et al. Peptidylarginine deiminase inhibitors reduce bacterial membrane vesicle release and sensitize bacteria to antibiotic treatment. Front Cell Infect Microbiol. 2019;9:227.
- Kosgodage US, Matewele P, Awamaria B, et al. Cannabidiol is a novel modulator of bacterial membrane vesicles. Front Cell Infect Microbiol. 2019;9:324.
- Combes V, Coltel N, Alibert M, et al. ABCA1 gene deletion protects against cerebral malaria: potential pathogenic role of microparticles in neuropathology. Am J Pathol. 2005;166:295–302.
- Sampaio NG, Cheng L, Eriksson EM. The role of extracellular vesicles in malaria biology and pathogenesis. Malar J. 2017;16:245.
- Evans-Osses I, Mojoli A, Monguio-Tortajada M, et al. Microvesicles released from Giardia intestinalis disturb host-pathogen response in vitro. Eur J Cell Biol. 2017;96:131–142.
- Gulati S, Ekland EH, Ruggles KV, et al. Profiling the essential nature of lipid metabolism in asexual blood and gametocyte stages of plasmodium falciparum. Cell Host Microbe. 2015;18:371–381.
- Zhang R, Chandramohanadas R, Lim CT, et al. Febrile temperature elevates the expression of phosphatidylserine on plasmodium falciparum (FCR3CSA) infected red blood cell surface leading to increased cytoadhesion. Sci Rep. 2018;8:15022.
- Sierro F, Grau GER. The ins and outs of cerebral malaria pathogenesis: immunopathology, extracellular vesicles, immunometabolism, and trained immunity, Front Immunol. 2019;10:830.
- Regev-Rudzki N, Wilson DW, Carvalho TG, et al. Cell-cell communication between malaria-infected red blood cells via exosome-like vesicles. Cell. 2013;153:1120–1133.
- Cestari I, Ansa-Addo E, Deolindo P, et al. Trypanosoma cruzi immune evasion mediated by host cell-derived microvesicles. J Iimmunol. (Baltimore, Md.: 1950). 2012;188:1942–1952.
- Inal JM, Ansa-Addo EA, Lange S. Interplay of host-pathogen microvesicles and their role in infectious disease. Biochem Soc Trans. 2013;41:258–262.
- Krampa FD, Aniweh Y, Awandare GA, et al. Recent progress in the development of diagnostic tests for malaria. Diagnostics (Basel). 2017;7:54.
- Shah R, Patel T, Freedman JE. Circulating extracellular vesicles in human disease. N Engl J Med. 2018;379:958–966.
- Combes V, Taylor TE, Juhan-Vague I, et al. Circulating endothelial microparticles in malawian children with severe falciparum malaria complicated with coma. Jama. 2004;291:2542–2544.
- Campos FM, Franklin BS, Teixeira-Carvalho A, et al. Augmented plasma microparticles during acute Plasmodium vivax infection. Malar J. 2010;9:327.
- Bastaki H, Carter J, Marston L, et al. Time delays in the diagnosis and treatment of malaria in non-endemic countries: A systematic review. Travel Med Infect Dis. 2018;21:21–27.
- Zhang T, Xu X, Jiang J, et al. Risk factors of severe imported malaria in Anhui province, China. Acta Trop. 2019;197:104934.
- Swaan C, van den Broek A, Kretzschmar M, et al. Timeliness of notification systems for infectious diseases: a systematic literature review. PloS One. 2018;13:e0198845.
- Westerman M, Pizzey A, Hirschman J, et al. Microvesicles in haemoglobinopathies offer insights into mechanisms of hypercoagulability, haemolysis and the effects of therapy. Br J Haematol. 2008;142:126–135.
- Habib A, Kunzelmann C, Shamseddeen W, et al. Elevated levels of circulating procoagulant microparticles in patients with beta-thalassemia intermedia. Haematologica. 2008;93:941–942.
- Antwi-Baffour S, Boafo A, Kyeremeh R, et al. Plasma Membrane-derived Vesicles (PMVs) in G6PD deficient patients. SOJ Imunol. 2013;1:4.
- Bartoloni A, Zammarchi L. Clinical aspects of uncomplicated and severe malaria. Mediterr J Hematol Infect Dis. 2012;4:e2012026.
- Hind E, Heugh S, Ansa-Addo EA, et al. Red cell PMVs, plasma membrane-derived vesicles calling out for standards. Biochem Biophys Res Commun. 2010;399:465–469.
- Lotvall J, Hill AF, Hochberg F, et al. Minimal experimental requirements for definition of extracellular vesicles and their functions: a position statement from the international society for extracellular vesicles. J Extracell Vesicles. 2014;3:26913.
- Thery C, Witwer KW, Aikawa E, et al. Minimal information for studies of extracellular vesicles 2018 (MISEV2018): a position statement of the international society for extracellular vesicles and update of the MISEV2014 guidelines. J Extracell Vesicles. 2018;7:1535750.
- Stratton D, Moore C, Zheng L, et al. Prostate cancer cells stimulated by calcium-mediated activation of protein kinase C undergo a refractory period before re-releasing calcium-bearing microvesicles. Biochem Biophys Res Commun. 2015;460:511–517.
- Nielsen T, Kristensen AF, Pedersen S, et al. Investigation of procoagulant activity in extracellular vesicles isolated by differential ultracentrifugation. J Extracell Vesicles. 2018;7:1454777.
- Boing AN, van der Pol E, Grootemaat AE, et al. Single-step isolation of extracellular vesicles by size-exclusion chromatography. J Extracell Vesicles. 2014;3:10.3402.
- Onodi Z, Pelyhe C, Terezia Nagy C, et al. Isolation of high-purity extracellular vesicles by the combination of iodixanol density gradient ultracentrifugation and bind-elute chromatography from blood plasma. Front Physiol. 2018;9:1479.
- Grant R, Ansa-Addo E, Stratton D, et al. A filtration-based protocol to isolate human plasma membrane-derived vesicles and exosomes from blood plasma. J Immunol Methods. 2011;371:143–151.
- Sisa C, Kholia S, Naylor J, et al. Mesenchymal stromal cell derived extracellular vesicles reduce hypoxia-ischaemia induced perinatal brain injury. Front Physiol. 2019;10:282.
- Kosgodage US, Uysal-Onganer P, MacLatchy A, et al. Peptidylarginine deiminases post-translationally deiminate prohibitin and modulate extracellular vesicle release and MicroRNAs in glioblastoma multiforme. Int J Mol Sci. 2018;20:103.
- Crosnier C, Iqbal Z, Knuepfer E, et al. Binding of Plasmodium falciparum merozoite surface proteins DBLMSP and DBLMSP2 to human immunoglobulin M is conserved among broadly diverged sequence variants. J Biol Chem. 2016;291:14285–14299.
- Chugh M, Sundararaman V, Kumar S, et al. Protein complex directs hemoglobin-to-hemozoin formation in Plasmodium falciparum. Proc Natl Acad Sci U S A. 2013;110:5392–5397.
- Filipe V, Hawe A, Jiskoot W. Critical evaluation of Nanoparticle Tracking Analysis (NTA) by NanoSight for the measurement of nanoparticles and protein aggregates. Pharm Res. 2010;27:796–810.
- Menck K, Bleckmann A, Schulz M, et al. Isolation and characterization of microvesicles from peripheral blood. J Vis Exp. 2017;119:e55057.
- van der Pol E, Coumans FA, Grootemaat AE, et al. Particle size distribution of exosomes and microvesicles determined by transmission electron microscopy, flow cytometry, nanoparticle tracking analysis, and resistive pulse sensing. J Thromb Haemost. 2014;12:1182–1192.
- Berckmans RJ, Nieuwland R, Boing AN, et al. Cell-derived microparticles circulate in healthy humans and support low grade thrombin generation. Thromb Haemost. 2001;85:639–646.
- Boulanger CM, Scoazec A, Ebrahimian T, et al. Circulating microparticles from patients with myocardial infarction cause endothelial dysfunction. Circulation. 2001;104:2649–2652.
- Ansa-Addo EA, Lange S, Stratton D, et al. Human plasma membrane-derived vesicles halt proliferation and induce differentiation of THP-1 acute monocytic leukemia cells. J Immunol. (Baltimore, Md.: 1950). 2010;185:5236–5246.
- Nyarko SH, Cobblah A. Sociodemographic determinants of malaria among under-five children in Ghana. Malar Res Treat. 2014;2014:304361.
- Pankoui Mfonkeu JB, Gouado I, Fotso Kuate H, et al. Elevated cell-specific microparticles are a biological marker for cerebral dysfunctions in human severe malaria. PloS One. 2010;5:e13415.
- Aringer M, Feierl E, Steiner G, et al. Increased bioactive TNF in human systemic lupus erythematosus: associations with cell death. Lupus. 2002;11:102–108.
- Depinay N, Franetich JF, Gruner AC, et al. Inhibitory effect of TNF-alpha on malaria pre-erythrocytic stage development: influence of host hepatocyte/parasite combinations. PloS One. 2011;6:e17464.
- Wu M, Ouyang Y, Wang Z, et al. Isolation of exosomes from whole blood by integrating acoustics and microfluidics. Proc Natl Acad Sci U S A. 2017;114:10584–10589.
- Babatunde KA, Mbagwu S, Hernandez-Castaneda MA, et al. Malaria infected red blood cells release small regulatory RNAs through extracellular vesicles. Sci Rep. 2018;8:884.
- Liao Q, Shen J, Liu J, et al. Genome-wide identification and functional annotation of Plasmodium falciparum long noncoding RNAs from RNA-seq data. Parasitol Res. 2014;113:1269–1281.
- Broadbent KM, Broadbent JC, Ribacke U, et al. Strand-specific RNA sequencing in Plasmodium falciparum malaria identifies developmentally regulated long non-coding RNA and circular RNA. BMC Genomics. 2015;16:454.
- Sisquella X, Ofir-Birin Y, Pimentel MA, et al. Malaria parasite DNA-harbouring vesicles activate cytosolic immune sensors. Nat Commun. 2017;8:1985.
- Meningher T, Lerman G, Regev-Rudzki N, et al. Schistosomal MicroRNAs isolated from extracellular vesicles in sera of infected patients: A new tool for diagnosis and follow-up of human schistosomiasis. J Infect Dis. 2017;215:378–386.
- Sonkong K, Chaiklieng S, Neave P, et al. Factors affecting delay in seeking treatment among malaria patients along Thailand-Myanmar border in Tak Province, Thailand. Malar J. 2015;14:3.