
ABSTRACT
The role of epigenetics in endothelial cell senescence is a cutting-edge topic in ageing research. However, little is known of the relative contribution to pro-senescence signal propagation provided by microRNAs shuttled by extracellular vesicles (EVs) released from senescent cells. Analysis of microRNA and DNA methylation profiles in non-senescent (control) and senescent (SEN) human umbilical vein endothelial cells (HUVECs), and microRNA profiling of their cognate small EVs (sEVs) and large EVs demonstrated that SEN cells released a significantly greater sEV number than control cells. sEVs were enriched in miR-21-5p and miR-217, which target DNMT1 and SIRT1. Treatment of control cells with SEN sEVs induced a miR-21/miR-217-related impairment of DNMT1-SIRT1 expression, the reduction of proliferation markers, the acquisition of a senescent phenotype and a partial demethylation of the locus encoding for miR-21. MicroRNA profiling of sEVs from plasma of healthy subjects aged 40–100 years showed an inverse U-shaped age-related trend for miR-21-5p, consistent with senescence-associated biomarker profiles. Our findings suggest that miR-21-5p/miR-217 carried by SEN sEVs spread pro-senescence signals, affecting DNA methylation and cell replication.
Introduction
Cellular senescence is considered as a hallmark of ageing and a major risk factor for the development of the most common age-related diseases (ARDs) [Citation1]. Senescent cells (SCs) are characterised by a significantly reduced replicative potential and by the acquisition of a pro-inflammatory senescence-associated secretory phenotype (SASP) [Citation2], which involves the paracrine induction of a senescent state in younger cells through a “bystander effect” [Citation3]. Since this effect fuels inflammaging – the systemic, low-grade, chronic inflammation that accompanies human ageing [Citation4] – it appears to be a critical step in SC accumulation during organismal ageing [Citation5]. The clinical relevance of inflammaging in ARD development and progression has become clearly established [Citation6]. SC clearance and attenuation of the bystander effect have been proposed as innovative therapeutic approaches to address, ameliorate or prevent a range of human disorders [Citation7–Citation10]. In this framework, unravelling the contribution of the epigenetic mechanisms involved in the senescence process would be a major step forward [Citation11]. Considerable effort is being devoted to discriminating the effects of several epigenetic mechanisms, including DNA methylation and long and small non-coding RNA activity, on the modulation of the transcriptional programme leading to cellular senescence [Citation12,Citation13]. Senescence-associated (SA) genome-wide hypomethylation has been described in SCs, whereas the expression and activity of DNA methyltransferase 1 (DNMT1) decline with ageing [Citation14]. DNMT1 is involved in maintaining the methylation pattern and works with Sirtuin 1 (SIRT1), an enzyme exerting mono-ADP ribosyltransferase or deacetylase activity, in ensuring genome integrity and in exerting pro-longevity effects [Citation15,Citation16]. As a result, DNMT and SIRT activators/inhibitors are being investigated as therapeutic agents against ARDs [Citation17].
Senescence modulation by microRNAs (miRNAs) is a major senescence-related epigenetic mechanism. This has been suggested, among other findings, by the identification of discrete miRNA signatures associated with senescence in different cell types [Citation18] and by the fact that living cells can actively release extracellular vesicles (EVs), which contain different species and amounts of non-coding RNAs. EVs comprise large particles (lEVs; also known as micro-vesicles) and small particles (sEVs or exosomes) and differ both in their intra-cellular origin and in the cargo they transport [Citation19]. lEVs and sEVs seem to reflect the molecular characteristics of their cells of origin and to modulate the phenotype of recipient cells both in a paracrine and in a systemic manner [Citation20,Citation21]. Despite the major contribution to organismal ageing demonstrated for EVs and their miRNA cargo [Citation22,Citation23], too little is known of the effect of ageing on human EV content, on the miRNA repertoire shuttled by SCs and their cognate EVs, and on circulating EVs. Evidence from a variety of cellular models suggests that the senescence phenotype is characterised by increased EV secretion [Citation24–Citation26], although circulating EV concentrations seem to decline with age, possibly as a consequence of increased internalisation by immune cells [Citation27]. Notably, the pro-inflammatory effects of EVs released from SCs seem to be related to their DNA/RNA cargo, which suggests that EVs belong to the SC secretome [Citation25,Citation26,Citation28]. Recently, the effects of EVs have been explored in relation to vascular ageing [Citation28]. EVs from the plasma of elderly subjects and from senescent endothelial cells (ECs) promote vascular calcification [Citation29], reduce the bone formation rate [Citation30] and reprogram monocytes towards a pro-inflammatory phenotype [Citation31].
Altogether, our knowledge of the in vivo effects of cellular senescence is quite limited. Moreover, the heterogeneous senescence phenotypes characterising living animals entail that there are currently no wholly reliable universal markers to identify senescent ECs in vivo [Citation32].
This study was devised to unravel the relative contribution of EVs released from senescent ECs in spreading pro-senescence signals to proliferating cells via their miRNA cargo. Based on the evidence that the in vitro replicative senescence of ECs substantially mimics the progressive age-related impairment of endothelial function described in vivo [Citation33], we set out to identify the miRNAs that are differentially expressed in senescent and non-senescent human umbilical vein endothelial cells (HUVECs) and their cognate EVs (lEVs and sEVs). We then correlated the miRNA levels with the methylation state of their genetic loci and assessed their interactions with the enzymes involved in the maintenance of the methylation pattern during ageing. Finally, we compared the SA-miRNAs isolated from EVs released from senescent HUVECs with the miRNAs showing a differential expression in circulating EVs obtained from subjects of different ages.
Materials and methods
Cell lines and cell culture
An in vitro model of replicative cell senescence was established using long-term cultured HUVECs and human aortic endothelial cells (HAECs). Cryopreserved HUVECs and HAECs obtained from pool of donors were purchased from Clonetics (Lonza, Switzerland) and cultured in endothelial basal medium (EBM-2, CC-3156, Lonza) supplemented with SingleQuot Bullet Kit (CC-4176, Lonza) containing 0.1% human recombinant epidermal growth factor (rh-EGF), 0.04% hydrocortisone, 0.1% vascular endothelial growth factor (VEGF), 0.4% human recombinant fibroblast growth factor (rh-FGF-B), 0.1% insulin-like growth factor-1 with the substitution of arginine for glutamic acid at position 3 (R3-IGF-1), 0.1% ascorbic acid, 0.1% heparin, 0.1% gentamicin and amphotericin-B (GA-1000) and 2% foetal bovine serum (FBS). Cells were seeded at a density of 5000/cm2, sub-cultured when they reached 70–80% confluence, and maintained in a humidified atmosphere of 5% CO2 at 37°C. All cells tested negative for mycoplasma infection. Before replating, harvested cells were counted using a haemocytometer. Population doublings (PDs) were calculated by the formula: (log10F – log10I)/log102, where F is the number of cells at the end of the passage and I is the number of seeded cells. Cumulative population doubling (cPD) was calculated as the sum of PD changes. Cells were cultured until the arrest of replication and classified based on SA β-Gal activity into control (CON, SA β-Gal < 5%) and senescent (SEN, SA β-Gal > 60%) cells. For the drug-induced senescence model, HUVECs and HAECs were treated with doxorubicin hydrochloride (Sigma Aldrich, Italy) at 50 nM for 24 h and were harvested following a 72-h recovery period with fresh medium.
Biomarkers of the HUVEC and HAEC senescent phenotype
SA β-galactosidase staining
SA β-galactosidase (β-gal) activity was assessed using Senescence Detection Kit (cat. no. K320, BioVision Inc., USA) as described previously [Citation34].
Telomere length
Telomere length was analysed by quantitative PCR using Cawthon’s method [Citation35]. Genomic DNA was isolated from young and senescent HUVECs using Norgen’s RNA/DNA Purification Kit (cat. no. 48,700, Norgen Biotek Corporation, Canada).
p16, IL-1β, IL-6, IL-8, DNMT1 and SIRT1 mRNA expression level
For mRNA gene expression, 1 μg of purified RNA was reverse-transcribed with OneScript® cDNA Synthesis Kit (Applied Biological Materials Inc., Canada) according to the manufacturer’s instructions. qPCR reactions were conducted in a Rotor Gene Q 5plex HRM apparatus (Qiagen, Germany) in a 10 μl total reaction volume using TB Green Premix Ex Taq II (Clontech Laboratories, USA) according to the manufacturer’s instructions. Each reaction was run in triplicate and always included a no-template control. The mRNA expression of the genes of interest was calculated using GAPDH as the reference gene.
mRNA expression levels were analysed by the 2−ΔCt method. The value of the relative expression of the genes of interest is given as mean ± standard deviation (SD) of three independent experiments.
The primers sequences (written 5ʹ-3ʹ) were: p16, Fw: CATAGATGCCGCGGAAGGT, Rv: CTAAGTTTCCCGAGGTTTCTCAGA; IL-1β, Fw: CCAGCTACGAATCTCCGACC, Rv: TGGGGTGGAAAGGTTTGGA; IL-6, Fw: CCAGCTACGAATCTCCGACC, Rv: CATGGCCACAACAATGACG; IL-8, Fw: TCTGCAGCTCTGTGTGTGAAGG, Rv: TGGGGTGGAAAGGTTTGGA; β-actin, Fw: TGCTATCCCTGTACGCCTCT, Rv: GTGGTGGTGAAGCTGTAGCC; DNMT1, Fw: AGAACGCCTTTAAGCGCCG; Rv: CCGTCCACTGCCACCAAAT; SIRT1, Fw: AGGCCACGGATAGGTCCATA; Rv: GTGGAGGTATTGTTTCCGGC. Primer concentration was 200 nM.
p16, DNMT1 and SIRT1 protein quantification
In HUVECs, total proteins were purified using RIPA buffer (150 mM NaCl, 10 mM Tris, pH 7.2, 0.1% SDS, 1.0% Triton X-100, 5 mM EDTA, pH 8.0) containing a protease inhibitor cocktail (Roche Applied Science, USA). Protein concentration was determined using the Bradford method (Sigma-Aldrich, Italy). Total protein extracts (30 μg) were separated by SDS-PAGE and transferred to nitrocellulose membranes (Whatman, Germany). Membranes were blocked in phosphate-buffered saline (PBS) with 0.1% Tween 20 (PBS-T) containing 5% fat-free dry milk for 1 h and then incubated overnight at 4°C with primary antibodies targeting p16(Ink4a) (1:200; sc-377,412, Santa Cruz Biotechnology, USA), pH2AX (1:1000; #9718, Cell Signaling, USA), DNMT1 (1:1000; ab19905; Abcam, UK) and SIRT1 (1:1000; ab12193, Abcam), using β-actin (1:10,000; Santa Cruz Biotechnology) or α-tubulin (1:1000; #2144, Cell Signaling) as normalizers. All primary antibodies were probed with a secondary horseradish peroxidase (HRP)-conjugated antibody (Vector, USA). A chemiluminescence assay (ECL, Amersham, USA) was used for detection; the autoradiographic films thus obtained were quantified using ImageJ2 software [Citation36]. Independent samples t-test was used to analyse the differences between samples. p values < 0.05 were considered significant.
Genome-wide DNA methylation analysis
Genomic DNA was extracted in triplicate from CON and SEN HUVECs using Qiagen’s QiAmp mini kit following the manufacturer’s recommendations.
Accordingly, 1 μg DNA was bisulphite-converted using EZ DNA Methylation (Zymo Research, USA) and analysed by the Infinium HumanMethylationEPIC BeadChip (Illumina Inc., USA) according to the manufacturer’s instructions. The DNA methylation levels from the EPIC kit [Citation37] were quantified by applying the workflow described for EPIC array analysis in the Minfi v1.28.3 vignette [Citation38]. The IlluminaHumanMethylationEPICanno.ilm10b2.hg19_0.6.0.tar.gz manifest was employed to annotate the EPIC probes.
Quality control of raw and normalised data was performed with the ShinyMethyl v1.18 package, available in Bioconductor 3.8 [Citation39]. Data normalisation included noob background correction [Citation40] followed by functional normalisation implemented in the Minfi function “preprocess Funnorm” [Citation41]. Probes matching single nucleotide polymorphism (SNP) loci were not deployed for downstream analysis and were removed by running the Minfi function “dropLociWithSnps”.
DNA methylation polymorphisms (DMPs) were assigned to a genomic category following the annotation available in the IlluminaHumanMethylationEPIC manifest under the column “UCSC_RefGene_Group”. Probes not assigned to any category were classified as “others”. DMPs were split into hyper- and hypo-methylated sites and plotted using an in-house-developed R script.
The methylation state of differentially expressed miRNAs (see below “Small RNAseq analysis [NGS] of cells and EVs”) was inferred by evaluating the probes within −2 kb of the miRNA annotation start and +2 kb of their end in the hg19 genome assembly. DMPs associated with each miRNA were deployed to build a methylation state heatmap and linked to the miRNA expression state using an in-house-developed R script.
The methylation landscape of the DNMT1 and SIRT1 genes was characterised by estimating the normalised beta values of all probes occurring within −2 kb of the TSS of the gene and +2 kb of the gene end coordinate. Probes were classified by the “UCSC_RefGene_Group”. Probes matching each genomic window were then plotted in boxplot format using an in-house-developed R script.
Electron microscopy analysis
HUVECs were plated on Aclar film (Ted Pella Inc., USA), sectioned tangential to the substrate and examined by TEM. HUVECs were fixed for 1 h at room temperature in 2.5 glutaraldehyde solution in 0.1 M cacodylate buffer (pH 7.4), post-fixed in 1% osmium tetroxide in the same buffer for 30 min at room temperature, dehydrated in an acetone series and embedded in epoxy resin (cat. no. 43,359, Sigma-Aldrich, Italy). Ultrathin (40 nm) sections were stained with lead citrate and uranyl acetate and examined in a Philips CM12 transmission electron microscope (Philips, Netherlands) at 100 kV. Scanning electron microscopy analysis was performed on HUVECs plated on Aclar film fixed and dehydrated as described above, critical point-dried (Balzers union cpd 020), gold-coated and imaged using a Philips XL20 microscope at 15 kV. The release of multi-vesicular bodies (MVBs) was evaluated by counting their number/µm2 of cytoplasmic area in 24 CON and 22 SEN cells.
For TEM analysis of lEVs and sEVs, EVs were adsorbed to formvar carbon-coated 200 mesh grids (Agar Scientific Ltd., UK) for 2 min, gently washed with filtered PBS and immediately fixed on the grids with 2.5% glutaraldehyde for 1 min. The grids were incubated with 2% (w/v) sodium phosphotungstate for 1 min and observed in a Philips CM10 transmission electron microscope.
EV purification and characterisation (Nanosight tracking analysis and western blotting)
When CON and SEN HUVECs reached 70% confluence in T75 flasks, they were thoroughly washed with PBS and incubated in EGM-2 containing exosome-depleted FBS (cat. no. A2720801, Thermo Fisher Scientific, USA). Conditioned medium from 8ʹ000ʹ000 ± 1ʹ000ʹ000 cells was collected after 18 h and EVs (lEVs and sEVs) were purified by ultracentrifugation [Citation42].
EVs released from SEN and CON cells were characterised according to the Minimal Information for Studies of Extracellular Vesicles guidelines, which were developed by the International Society for Extracellular Vesicles (ISEV) in 2018 [Citation43]. Specifically, we (i) adopted the EV nomenclature suggested by the ISEV position papers; (ii) performed basic characterisation of the EV-releasing cells before the collection of conditioned medium (culturing condition details such as passage number, seeding density, confluence at harvest have been reported); (iii) employed a variety of techniques such as size-exclusion chromatography (SEC), serial ultracentrifugation or a combination of ultracentrifugation and density gradient separation to isolate EVs; (iv) characterised and quantified isolated EVs using nanoparticle tracking assay, transmission electron microscopy and western blot analysis using well-established markers (CD63, TSG101, calnexin).
EVs were purified by centrifugation at 1ʹ000g for 15 min and then at 2ʹ000g for 15 min to eliminate cell debris. Supernatants were further centrifuged at 18ʹ000g for 30 min to obtain the lEV pellet. The resulting supernatant was pelleted by ultracentrifugation at 110ʹ000g for 70 min. The sEV pellet was washed in 3 ml PBS, centrifuged again and resuspended in PBS.
EV amount and size was measured by NanoSight tracking analysis (NTA). sEVs and lEVs were loaded into the sample chamber of an LM10 unit (NanoSight, Malvern Instruments Ltd, UK). Three 30 or 60 s videos were recorded for each sample and analysed with NanoSight NTA 3.1 software. Data were expressed as mean ± SD of the three recordings. Samples containing a large number of particles were diluted before the analysis and the relative sEV and lEV concentration was calculated according to the dilution factor. Control beads (100 and 400 nm) were supplied by Malvern Instruments. EV lysates were prepared in RIPA buffer containing a protease inhibitor cocktail (Roche Applied Science) and quantified using the Bradford method. Next, the lysates were subjected to SDS-PAGE and transferred to nitrocellulose membranes (Whatman). Membranes were then incubated with the primary antibodies overnight at 4°C. The following primary antibodies were used: calnexin (clone C4731, Sigma-Aldrich; 1:2000 dilution), TSG101 (ab125011, Abcam; 1:1000 dilution) and CD63 (ab59479, Abcam; 1:1000 dilution). After incubation with the specific HRP-conjugated antibody (Vector; 1:10,000 dilution), the chemiluminescent signal was detected using Clarity and/or Clarity Max (Bio-Rad, Italy). The autoradiographic films thus obtained were quantified using ImageJ2 software.
In order to exclude that protein-miRNA complexes could co-precipitate with EVs during the isolation procedure, we used a combination of density gradient separation and treatment of isolated vesicles with proteinase K 20 μg/ml to confirm that miR-21-5p is truly loaded into EVs. MiR-21-5p levels were not significantly different between the two conditions (miR-21-5p relative expression; control = 0.383 ± 0.050; proteinase K = 0.259 ± 0.063; n = 3; p = 0.185), confirming the intra-vesicular presence of the miRNAs.
Data regarding the EV-related aspects of the experiments conducted on HUVECs have been deposited to the EV-TRACK knowledge base (http://evtrack.org) [Citation44] under accession number EV190105.
RNA extraction from HUVECs and EVs
Small RNAs (< 200 nucleotides) were extracted from HUVECs and sEV and lEV pellets using, respectively Norgen’s total RNA Purification Kit and Total Exosome RNA & Protein Isolation Kit (Thermo Fisher Scientific) according to the manufacturer’s protocol. Purified RNA was stored at −80°C until use.
Small RNA sequencing analysis (NGS) of HUVECs and EVs
CON and SEN cells, their EVs (lEVs and sEVs) and 12 samples of sEVs purified from plasma of four young, four elderly and four centenarian subjects were subjected to small RNA sequencing. RNA for the analysis was obtained from 6 ml of media from the culture of 2.000.000 CON cells and 1.600.000 SEN cells, in triplicate. TruSeq Small RNA Library PrepKit v2 (Illumina; RS-200-0012/24/36/48) was used for library preparation according to the manufacturer’s indications. Briefly, 35 ng purified RNA was linked to RNA 3ʹ and 5ʹ adapters, converted to cDNA, and amplified using Illumina primers containing unique indexes for each sample. Each library was quantified using Agilent Bioanalyzer and High Sensitivity DNA Kit (cat. no. 5067-4626, Agilent Technologies, USA) and equal amounts of libraries were pooled together. Size selection allowed keeping 130–160 bp fragments. After ethanol precipitation, the library pool was quantified with Agilent High Sensitivity DNA Kit, diluted to 1.8 pM and sequenced using NextSeq® 500/550 High Output Kit v2 (75 cycles) (Illumina; FC-404-2005) on the Illumina NextSeq500 platform.
Raw base-call data generated by the Illumina NextSeq 500 system were demultiplexed using Illumina BaseSpace Sequence Hub (https://basespace.illumina.com/home/index) and converted to FASTQ format. After a quality check with FastQC (https://www.bioinformatics.babraham.ac.uk/projects/fastqc/), the adapter sequences were trimmed using Cutadapt (http://cutadapt.readthedocs.io/en/stable/index.html), which also removed sequences < 10 nucleotides. Reads were mapped using the STAR algorithm (https://www.ncbi.nlm.nih.gov/pubmed/23104886). The reference genome consisted of human miRNA sequences from the miRbase 21 database [Citation45]. Raw counts from mapped reads were obtained using the htseq-count script from the HTSeq tools (http://www-huber.embl.de/HTSeq/doc/overview.html).
Raw counts were further normalised using DESeq2 bioconductor package (http://bioconductor.org/packages/release/bioc/html/DESeq2.html). NGS raw data are available through European Nucleotide Archive (http://www.ebi.ac.uk/) under accession number PRJEB33703.
MiRNAs expressed in SEN cells and their EVs were identified to obtain a normalised expression above the 40th percentile in at least one sample of the group.
Statistical analysis of NGS data
NGS data were analysed using Genespring GX software v14.8 (Agilent Technologies). The miRNAs showing a differential expression were identified by comparing SEN and CON cells using a fold change ≥ 1.5 filter and FDR 5% at moderated t-test with Benjamini-Hochberg correction. A fold change ≥ 1.3 with FDR 20% or 30% was used in lEV and sEV analysis, respectively. Cluster analysis was performed using GeneSpring GX software with Manhattan correlation as a similarity measure.
Quantitative PCR of mature miRNAs
MiRNA expression was measured by qPCR using the TaqMan miRNA assay (Catalogue #4427012 Thermo Fisher Scientific) as previously described [Citation46].
Methylome analysis of loci coding for SA miRNAs
The sequences and genomic coordinates (GRCh38) of predicted hairpin precursor miRNAs were retrieved from miRbase 21 (Supplementary Table 7). The CpG nucleotide clusters (CpG islands) associated with miRNA genes within a distance of 2 kb were identified by visual inspection of the miRNA gene neighbourhood using the University of California Santa Cruz (UCSC) Genome Browser. Putative proximal promoter regions within 2 kb of the TSS were obtained from the database http://bicresources.jcbose.ac.in/zhumur/pirnaquest/.
Computational prediction of SA miRNA targets
To gain further insights into the relationship between SA miRNAs and the DNA methylation pattern of SEN cells, we explored the ability of SA miRNAs to target DNMT1 and/or SIRT1 using the StarBase v3.0 public platform (http://starbase.sysu.edu.cn) [Citation47]. TargetScan, starBase and miRTarBase were used to predict potential miRNA-DNMT1/SIRT1 interactions. DIANA-mirPath v3 and Ingenuity Pathway Analysis (IPA) were used to identify the pathways targeted by SA miRNAs.
Uptake of sevs released from SEN HUVECs
An amount of 2 × 10¹¹ sEVs has been collected from 6ʹ000ʹ000 of SEN HUVECs. sEVs released from SEN HUVECs were fluorescently labelled using PKH67 membrane dye (Sigma-Aldrich). Labelled sEVs were washed in 10 ml PBS, collected by ultracentrifugation and resuspended in PBS. Next, 109 sEVs were incubated with 5 × 10⁴ recipient CON HUVECs for 4, 12, 18 and 24 h. An incubation time of 18 h was established to be optimal for sEV uptake by CON cells. Then, 109 sEVs released from SEN cells were incubated with 5 × 10⁴ recipient CON HUVECs.
CON HUVECs were also treated for 18 h with sEVs transfected with miR-217 and miR-21-5p inhibitors (respectively, MH12774 and MH10206, Thermo Fisher Scientific). The transfection process was promoted by Exo-Fect kit (System Bio, USA) according to the manufacturer’s recommendations. Briefly, sEVs were prepared for transfection by combining Exo-Fect solution, miRNA inhibitors, PBS and purified sEVs. The transfection solution was incubated at 37°C for 10 min and then put on ice. To stop the reaction, the EXoQuick-TC reagent supplied in the kit was added. After centrifuging for 3 min at 140,000 rpm, the supernatant was removed. The transfected sEVs pellet was suspended in 300 μl PBS and 150 μl of transfected sEVs were added to each well. The same method was used to load non-human cel-mir-39 into sEVs to assess the possibility of delivering miRNAs and their inhibitors through sEVs.
Assessment of the effects induced by SEN sEVs on CON cells
Immunofluorescence and western blot analysis of SIRT1 and DNMT1
CON HUVECs were seeded in BD Falcon chamber slides (cat. no. 354104; Falcon, USA) and treated with SEN sEVs and SEN sEVs transfected with miR-217 and miR-21-5p inhibitors as described above. Cells were washed twice with PBS and then fixed in 4% paraformaldehyde in PBS for 15 min at room temperature. After three washes in PBS they were incubated with 0.3% Triton X-100 in 2.5% bovine serum albumin (BSA) for 1 h at room temperature and then with KI67 antibody (dilution 1:150; Dako, Denmark), in 2.5% BSA overnight at 4°C. Cells were washed in PBS and incubated with secondary anti-rabbit Alexa Fluor 488 antibody (cat. no. 111-545-003, Jackson Laboratories, USA; dilution 1:200), at room temperature in 2% BSA for 1 h. After a wash in PBS, cells were stained with nuclear HOECHST 33,342 (cat. no. H-3570; Molecular Probes, USA) at 1:10,000 dilution in PBS for 5 min, coverslipped with Vectashield mounting medium (H-1200, Vector Laboratories) and viewed in a fluorescence microscope. Omission of the primary antibody resulted in lack of labelling, confirming the specificity of the antibody. The presence of senescence-associated heterochromatin foci (SAHF) was assessed by measuring the coefficient of variation (CV) of the HOECHST staining intensity in each nucleus. At least 200 nuclei have been assessed for each condition and each replicate using the using the CellProfiler image analysis software, version 3.1.9 [Citation48].
The Ki67 proliferative index was expressed as a percentage based on the number of Ki67-positive cells.
Expression levels of PCNA and cyclins A, B1, D1
OneScript® cDNA Synthesis Kit was used to reverse-transcribe 1 μg of purified RNA according to the manufacturer’s instructions. qPCR reactions were conducted on the Rotor Gene Q 5plex HRM apparatus in a 10 μl total reaction volume using TB Green Premix Ex Taq II (Clontech Laboratories) according to the manufacturer’s recommendations. Each reaction was run in triplicate and included no-template controls. The mRNA expression of the genes of interest was calculated using GAPDH as the reference gene.
Relative mRNA levels were calculated with the 2−ΔCt method. Relative expression values were reported as mean ± SD of three independent experiments.
Primer sequences (written 5ʹ-3ʹ) were: PCNA, Fw: CGGATACCTTGGCGCTAGTA, Rv: CACAGCTGTACTCCTGTTCTGG; Cyclin D1, Fw: CCCTCGGTGTCCTACTTCAA, Rv: AGGAAGCGGTCCAGGTAGTT; Cyclin A, Fw: TTGAAGAAATATACCCCCCAG, Rv: AATGATTCAGGCCAGCTTTG; Cyclin B1, Fw: TTGGTGTCACTGCCATGTTT, Rv: TAAGCAAAAAGCTCCTGCTG.
Annexin V assay
Apoptosis was evaluated by annexin V staining followed by flow cytometry. Briefly, CON cells and CON cells treated with 109 SEN sEVs were plated in a 12-well plate at a density of 2 × 10⁵ cells/well. Apoptosis was evaluated by staining cells with Annexin V and 7-AAD followed by fluorescence flow cytometry as described in Giuliani et al. [Citation46]. The results were expressed as percentage of apoptotic cells out of total live cells.
Methylation status of MIR21 locus
Quantitative analysis of DNA methylation of the MIR21 TSS200 region was performed using the EpiTYPER assay (Agena). Briefly, genomic DNA was bisulphite converted and the region chr17:57,918,197-57,918,709 (GRCh37/hg19 assembly) was amplified using the following primers: Fwd: aggaagagagTTTATATAAGTGAAAGGATATTGGAGAGA; Rev: cagtaatacgactcactatagggagaaggctAAATACCAAAATATCAAACAACCCA. PCR products were then processed according to standard EpiTYPER protocol. Each sample was analysed in triplicate.
Plasma samples and EV isolation
Plasma samples were obtained from 12 healthy subjects enrolled for the study. Subjects were considered healthy if they did not present type 1 or 2 diabetes, liver diseases, renal failure, history of cancer, neurodegenerative disorders, infectious or autoimmune diseases. Samples were collected at IRCCS INRCA (Ancona) and at Sant’Orsola University Hospital (Bologna). The procedure was approved by the respective ethics boards (Prot. no. 2006061707, amended on 08/11/2011). Written informed consent was collected from all participants. EVs were purified from 500 μl of plasma by qEVoriginal column (IZON, USA) according to the manufacturer’s indications.
Statistical analysis
Principal component analysis (PCA) with varimax orthogonal rotation and Kaiser normalisation was performed to investigate possible common trends in the miRNAs contained in circulating EVs. Only miRNAs that were detected in at least one subject were included in the analysis. Scree plots and the Kaiser-Meyer-Olkin (KMO) test were applied to evaluate the suitability of the correlation matrix. Anti-image-correlation was assumed as adequate for KMO > 0.5. The number of factors to be retained was determined by examining the scree plots. Each retained factor was assigned a score, determined as the linear combination of each miRNA weighted by its respective PCA loading. Factor scores were tested for normality using the Shapiro-Wilk test and compared by one-way ANOVA followed by Tukey’s multiple comparison test for pairwise comparisons. p values < 0.05 were deemed significant.
Results
Characterisation of the senescence status of HUVECs
HUVEC senescence was characterised by analysing a number of well-established senescence biomarkers in non-senescent (control, CON) and senescent (SEN) HUVECs.
Compared with CON cells, SEN cells were characterised by growth arrest, which was documented by reduced cumulative population doublings (cPDs) ()), progressive telomere shortening ()), increased SA β-gal activity ()), up-regulation of the cell cycle regulator p16(INK4a) both at the transcriptional and the protein level (,)); up-regulation of phospho-histone H2AX (pH2AX), a biomarker of persistent DNA damage [Citation49] ()) and significantly increased mRNA transcription of the pro-inflammatory SASP components interleukin (IL)-1β, IL-6 and IL-8 (–)). A similar model of replicative senescence was replicated also in HAECs. Moreover, we established a model of drug-induced senescence by treating HUVECs and HAECs with 50 nM doxorubicin for 24 h. The characterisation of these additional models is reported in Supplementary Figure 1.
Figure 1. Characterisation of replicative senescence in human umbilical vein endothelial cells (HUVECs). (a) Cumulative population doubling (cPD) curves. (b) Telomere/single copy gene ratio (T/S) in DNA from HUVECs at different passages. (c) Representative positivity and quantification of the SA β-Gal staining in control (CON, < 10%) and senescent (SEN, > 60%) cells. (d) mRNA relative expression. (d’) Western blot and densitometric analysis of p16(Ink4a) in CON and SEN cells. Protein expression values are reported as p16(Ink4)/β-actin ratio. (e) Western blot and densitometric analysis phospho-histone H2AX (pH2AX) in CON and SEN cells. Protein expression values are reported as pH2AX/β-actin ratio. (f) mRNA relative expression of interleukin (IL)-1β, (g) IL-6, (h) IL-8. (i) Boxplots of DNA methylation values of InfiniumEPIC probes in CON and SEN triplicates. The probes were divided in four groups according to their genomic location and t-test was applied to each group in order to compare mean beta values between CON and SEN. (l) mRNA relative expression. (l’) Western blot and densitometric analysis of DNMT1 in CON and SEN cells. Protein expression values are reported as DNMT1/α-tubulin ratio. (m) Methylation status of CpGs among a genomic region covering the DNMT1 gene ± 2kb. The region is split in multiple windows based on Illumina Infinium annotation assigned to each CpG as reported in the Methods section. Methylation status of each window is represented with a boxplot. Each dot corresponds to the mean B value of an annotated CpG across the three replicates. Blue: SEN cells; Orange: CON cells. **, q-val < 0.01. Scale of the Methylation status corresponds to the B value. (n) mRNA relative expression. (n’) Western blot and densitometric analysis of SIRT1 in CON and SEN cells. Protein expression values are reported as SIRT1/α-tubulin ratio. (o) Methylation status of CpGs among a genomic region covering the SIRT1 gene ± 2kb. The region is split in multiple windows based on Illumina Infinium annotation assigned to each CpG as reported in the Methods section. Methylation status of each window is represented with a boxplot. Each dot corresponds to an annotated CpG. Methylation status expressed in B value. Blue: SEN cells; Orange: CON cells. **, q-val < 0.01. For qPCR and western blot analysis data from three independent experiments are represented as mean ± SD. **, p < 0.01 from paired t-tests.
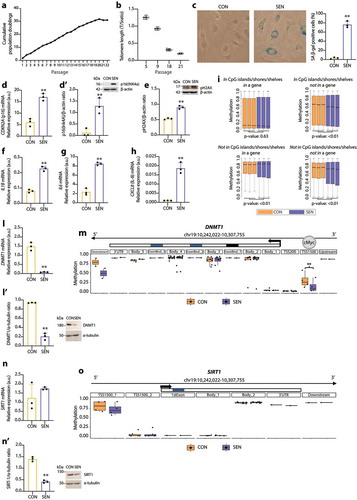
Human cell senescence is also marked by progressive, widespread genomic hypomethylation and focal hypermethylation at specific CpG sites [Citation50]. Further characterisation and comparison of the epigenetic profile of SEN and CON cells demonstrated a differential methylation state at 335ʹ495 CpG sites; in particular, SEN cells showed significant hypomethylation in CpG island/shore/shelf regions located in intergenic regions and significant hypermethylation of non-CpG sites inside genes ()).
Since DNMT1 and SIRT1 co-operate in maintaining the methylation pattern [Citation15], we analysed their mRNA and protein levels and the methylation state of their loci in SEN and CON cells. We found that DNMT1 mRNA and protein levels were down-regulated in SEN cells (,)), even though methylation analysis disclosed significant loss of methylation at the DNMT1 transcription start site (TSS)-1500 promoter region, which according to the ENCODE ChIP-Seq data binds the transcription factor c-MYC ()). SIRT1 mRNA levels were similar in CON and SEN cells ()); in contrast, the SIRT1 protein level was significantly reduced in SEN compared with CON cells ()), despite the similar methylation state of SEN and CON cells ()). These data suggest that during HUVEC replicative senescence DNMT1 and SIRT1 protein levels are modulated by post-transcriptional regulatory mechanisms.
Analysis of the senescence biomarkers confirmed that HUVECs aged in culture exhibit a senescent phenotype characterised by most of the established hallmarks of ageing [Citation51]. This model can, therefore, be considered as an archetypal “in vitro model” of cellular senescence.
Senescent HUVECs release more sEVs than control cells
We characterised the structure and content of EVs released from SEN and CON cells according to Minimal Information for Studies of Extracellular Vesicles guidelines, which were proposed by the International Society for Extracellular Vesicles (ISEV) in 2018 [Citation43]. Scanning electron micrograph analysis of EVs released from SEN and CON cells demonstrated a significantly greater number of vesicular bodies emerging from the cell surface of SEN cells (,)). To purify these small (sEVs) and large (lEVs) EV fractions, sEVs and lEVs were collected after ultracentrifugation and further characterised by Nanoparticle Tracking Analysis (NTA), transmission electron microscopy (TEM) and western blot analysis of some relevant biomarkers. Representative distribution plots of sEVs and lEVs released from CON (,)) and SEN cells (,)) indicated that sEVs and lEVs had a different size distribution. Representative TEM images of sEVs and lEVs purified from CON and SEN ()) confirm their different size. Analysis of calnexin, TSG101 and CD63 membrane protein expression by western blotting demonstrated the efficient separation of supernatant-derived EV sub-populations: sEVs were positive for the exosomal markers CD63 and TSG101, whereas lEVs were positive for the endoplasmic reticulum marker calnexin ()). Comparison of their number demonstrated that SEN and CON cells released more sEVs than lEVs. Moreover, NTA assay revealed that SEN cells released a threefold, significantly greater amount of sEVs (t-test for unpaired samples, p < 0.01) but a similar number of lEVs ()) compared with CON cells. Notably, the size of sEVs and lEVs released from either cell type was not significantly different ()). The increased release of sEVs from SEN cells was confirmed also in HUVECs undergoing drug-induced senescence following treatment with doxorubicin, and in HAECs undergoing both replicative and drug-induced senescence (Supplementary Figure 1d and 1d’).
Figure 2. Characterisation of sEVs and lEVs released from CON and SEN cells. (a,a’) SEM analysis of extracellular vesicles emerging from the CON cell plasmalemma. (b,b’) SEM analysis of extracellular vesicles emerging from the SEN cell plasmalemma. Scale bars of 20 and 5 µm are applied for low and high magnification, respectively. (c) Average size distribution curve of sEVs released from (c) CON and (c’) SEN cells. (d) Average size distribution curve of lEVs released from (d) CON and (d’) SEN cells. EVs size was determined by NTA Nanoparticle Tracking Assay (NTA). Three 60 s videos were recorded for each sample, and NTA analysis settings kept constant between samples. The average concentration of vesicles was plotted against their size, with the black lines and the colour areas representing the fitting curve and the error bar, respectively. (e) Representative TEM analysis of sEVs and lEVs released into the culture media by CON and SEN cells with a scale bar of 100 nm. (e’) Representative western blot analysis of calnexin, TSG101 and CD63 in isolated lEVs and sEVs. (f) Comparison of the number of sEVs and lEVs released per cell in CON and SEN cells as determined by NTA. (g) Comparison of the size of sEVs and lEVs released from CON and SEN cells as determined by NTA. Data from three independent experiments are represented as mean ± SD. **, p < 0.01 from paired t-tests. (h) Representative TEM photomicrograph of multi-vesicular bodies (MVBs) of SEN cells with a scale bar of 1 µm. (i) Comparison of the number of MVBs per µm2 measured in n = 24 TEM images of CON and SEN cells. Data are represented as mean ± SD. **, p < 0.01 from unpaired t-test.
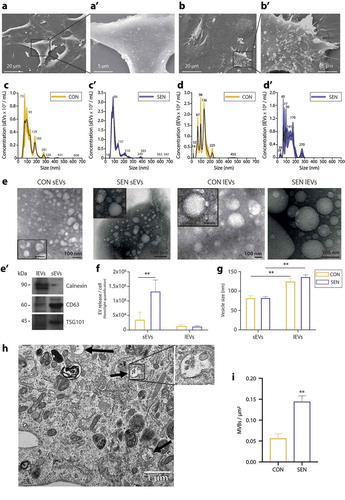
To further substantiate these data, multi-vesicular bodies (MVBs), a specialised subset of endosomes that contain sEVs, were identified and quantified in TEM images of SEN and CON HUVECs ()). A significantly greater number of MVBs at different stages of maturation was detected in SEN compared to CON cells (t-test for unpaired samples, p < 0.01) ()).
MiRNome analysis of CON and SEN HUVECs and their cognate EVs
The expression of the whole miRNome was analysed in triplicate in SEN and CON cells and cognate lEVs and sEVs from different pools of donors. The list of all miRNAs thus detected is reported in Supplementary Table 1. The miRNAs showing a significant differential expression in sEVs and lEVs released from SEN cells and in SEN compared with CON cells are listed in –), respectively. The miRNAs showing a differential expression in sEVs, lEVs and their parental SEN cells, the relevant fold changes, Benjamini-Hochberg adjusted p values and the normalised expression in SEN and CON are reported in Supplementary Tables 2–4. The miRNAs showing a differential expression were used to cluster miRNAs and samples. The resulting heatmaps – of the miRNAs showing significant de-regulation in sEVs released from SEN cells, of the miRNAs showing significant de-regulation in lEVs released from SEN cells, and of the miRNAs showing significant de-regulation in SEN cells – are reported in Supplementary Figure 2a, 2b and 2c, respectively. Supplementary Tables 5 and 6 report miRNAs showing differential expression between SEN cells and their cognate sEVs and lEVs, respectively. As previously reported [Citation52], the levels of miRNAs loaded onto EVs are significantly lower compared to their parent cells.
Figure 3. MiRNAs showing differential expression in SEN cells and cognate sEVs and lEVs. Bar charts reporting the (log2) fold changes of the miRNAs showing a differential expression (a) in sEVs released from SEN cells, (b) in lEVs released from SEN cells and (c) in SEN cells. The miRNA de-regulation trend is indicated by bar colour; red, over-expression; green, under-expression in SEN sEVs/SEN lEVs/SEN cells compared with CON sEVs/CON lEVs/CON cells, respectively. Only miR-21-5p (highlighted in red) showed significant SA de-regulation in SEN cells and cognate sEVs and lEVs. Data from small RNAseq of n = 3 independent replicates for each condition. MiRNAs showing a differential expression were identified by comparing SEN and CON cells using a fold change ≥ 1.5 filter and FDR 5% at moderated t-test with Benjamini-Hochberg correction. A fold change ≥ 1.3 with FDR 20% or 30% was used in lEV and sEV analysis, respectively. (d) Summary of the results of small RNAseq analysis on CON and SEN cells and cognate sEVs and lEVs. Briefly, 556 miRNAs were detected in at least one compartment (cells, sEVs and lEVs). Of the 355 miRNAs carried by EVs, only 42 (12%) were selectively packaged in sEVs; 86 (24%) were carried by both lEVs and sEVs and 227 (64%) were found only in lEVs. None of the miRNAs shared a common SA modulation trend in lEVs and sEVs. Only miR-21-5p was significantly de-regulated in both sEVs and lEVs released from SEN cells; however, it was over-expressed in sEVs and under-expressed in lEVs from the same SEN cell pool. (e) qPCR validation analysis of miR-21-5p and miR-217 in different pools of SEN cells and their cognate sEVs. Data from n = 3 independent experiments are represented as mean ± SD. **, p < 0.01 from unpaired t-test.
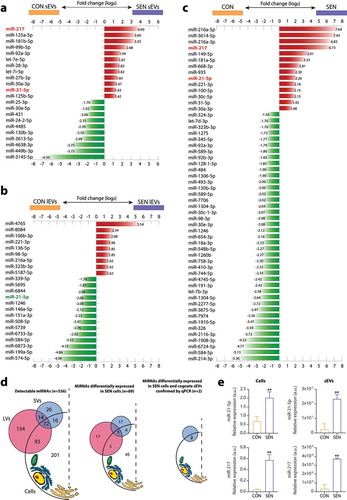
Overall, 22 miRNAs were differentially expressed in sEVs released from SEN cells; of these, 12 (55%) were up-regulated and 10 (45%) were down-regulated ()). Of the 55 miRNAs that were significantly modulated in SEN compared with CON cells 14 were up-regulated (25%) and 41 (75%) were down-regulated ()). Only five miRNAs – miR-21-5p, miR-217, miR-30a-3p, miR-130b-3p and miR-92a-3p – were differentially expressed in sEVs and parental SEN cells ( and )). Their analysis in a different batch of cells from a different pool of donors confirmed these findings. qPCR analysis confirmed the NGS data for miR-21-5p and miR-217 in cells and their sEVs ()), whereas no differential expression was detected for miR-30a-3p, -92a-3p and -130b-3p (data not shown). The up-regulation of miR-21-5p and miR-217 in SEN cells and their cognate sEVs was confirmed also in HAECs undergoing replicative senescence, as well as in the model of drug-induced senescence established in both HUVECs and HAECs (Supplementary ,,,)).
Table 1. MiRNAs commonly de-regulated in SEN cells and their EVs.
The results of miRNome analysis of SEN cells and cognate sEVs and lEVs are summarised in ).
miRNAs capable of targeting DNMT1 and SIRT1 and showing a differential expression in SEN cells and cognate EVs
To unravel the complex interaction between miRNA expression and methylation state in cells with the senescent phenotype we tried to establish which miRNAs capable of targeting DNMT1 and SIRT1 were significantly de-regulated in SEN cells and cognate EVs. Of the 12 miRNAs that were up-regulated in SEN sEVs, 4 – including miR-21-5p and miR-217 ()) – were capable of targeting DNMT1 and/or SIRT1, whereas none of the nine miRNAs up-regulated in SEN lEVs were able to target DNMT1 and/or SIRT1 ()). Five of the 14 miRNAs showing up-regulation in SEN cells were able to target DNMT1 and/or SIRT1; of them, only miR-21-5p and miR-217 were also up-regulated in SEN sEVs ()).
Figure 4. MiRNAs showing differential expression in SEN cells and their cognate sEVs and lEVs targeting DNMT1 and/or SIRT1. (a) MiRNAs showing over and under-expression in SEN sEVs compared with CON sEVs, (b) in SEN lEVs compared with CON lEVs, (c) and in SEN compared with CON cells targeting DNMT1 and/or SIRT1. Straight lines represent miRNA-mRNA interaction based on bioinformatic prediction from three different algorithms. Dotted lines represent miRNAs reducing DNMT1 activity by binding to its catalytic site, according to the report from Zhang et al. [Citation54].
![Figure 4. MiRNAs showing differential expression in SEN cells and their cognate sEVs and lEVs targeting DNMT1 and/or SIRT1. (a) MiRNAs showing over and under-expression in SEN sEVs compared with CON sEVs, (b) in SEN lEVs compared with CON lEVs, (c) and in SEN compared with CON cells targeting DNMT1 and/or SIRT1. Straight lines represent miRNA-mRNA interaction based on bioinformatic prediction from three different algorithms. Dotted lines represent miRNAs reducing DNMT1 activity by binding to its catalytic site, according to the report from Zhang et al. [Citation54].](/cms/asset/6922e251-70b0-4c7e-824d-7b4a181db795/zjev_a_1725285_f0004_oc.jpg)
Surprisingly, SEN lEVs carried no up-regulated SA miRNAs targeting DNMT1 and/or SIRT1.
Altogether, these data suggest that miR-21-5p and miR-217 are the only miRNAs shuttled by SEN sEVs that are also expressed in SEN cells and are capable of targeting DNMT1 and SIRT1. This observation, coupled with the finding that SEN cells released three times more sEVs than CON cells, prompted further investigation on the effects of SEN sEVs on CON cells.
Methylation state of the loci coding for miRNAs showing differential expression in SEN and CON cells
To clarify whether miRNA expression in SEN cells was epigenetically regulated, we analysed the methylation state of the genetic loci encoding the miRNAs showing differential expression in SEN and CON cells. The genomic locations and sequences of the miRNAs showing significant down- or up-regulation in SEN cells are reported in Supplementary Table 5.
The methylation state was obtained by conducting a global methylation analysis, assessing CpG site methylation within 2000 bp upstream and downstream of each miRNA transcription start site (TSS).
The methylation changes observed at the loci encoding the 55 miRNAs showing significant de-regulation in SEN cells are reported in ). Principal component analysis (PCA) revealed significantly different methylation profiles of the miRNA genes that were differentially expressed in SEN compared with CON cells ()); however, only about 50% showed SA methylation consistent with SA expression changes ()). Of the miRNAs that exhibited differential methylation in SEN and CON cells, only miR-21-5p showed concordant DNA demethylation and RNA over-expression both in SEN cells and SEN sEVs ()). The methylation state of miR-217 was not evaluated, because no CpG in the neighbourhood of its locus was covered by genome-wide methylome analysis.
Figure 5. Methylation state of the loci encoding miRNAs showing a differential expression in SEN compared with CON cells. (a) Box plots showing the log2 B value fold change in SEN vs CON cells at CpG loci located within the coding regions of selected miRNA. Yellow: over-methylated CpG sites (median value); Blue: under-methylated CpG sites (median value). (b) PCA of DNA methylation values in CON and SEN triplicates, considering only the InfiniumEPIC probes mapping within 2000 bp upstream and downstream the miRNAs differentially expressed in SEN vs CON. The percentage of variance explained by the first and the second principal components is reported in brackets. (c) Figure summarising expression levels and methylation state of miRNAs showing a differential expression in SEN cells. MiRNAs showing expression concordant with the methylation state are enclosed in black lines. MiRNAs commonly de-regulated in SEN cells and their cognate sEVs and lEVs are highlighted in bold. Significantly methylated or unmethylated miRNAs are marked with (*).
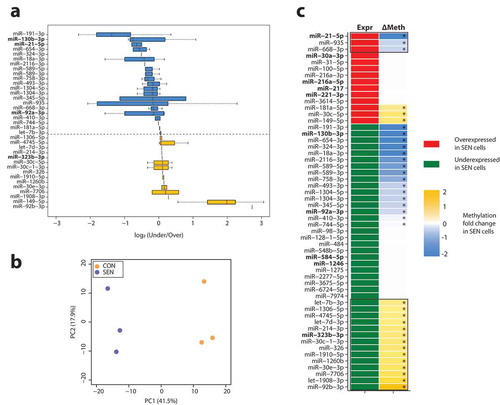
Overall, in half of the loci encoding the miRNAs showing differential expression in SEN cells, the gene methylation and expression data were not consistent, suggesting that additional post-transcriptional regulation mechanisms are involved in the modulation of SA miRNAs. These data support the hypothesis of a complex interaction among different epigenetic mechanisms in inducing and maintaining a senescent phenotype.
SEN sEVs significantly reduce CON cell DNMT1 and SIRT1 levels and proliferation markers
Previous work has shown that miR-21-5p directly targets SIRT1 and indirectly down-regulates DNMT1 by targeting the RASGRP1 gene, an upstream component of the Ras-MAPK pathway that regulates DNMT1 expression [Citation53]. MiR-21-5p has also been demonstrated to inhibit DNMT1 activity by binding to its catalytic site [Citation54]. As regards miR-217, it directly targets DNMT1 in fibroblasts [Citation55] and SIRT1 in endothelial cells [Citation56].
Based on these findings, we assessed the functional potential of sEVs released from SEN cells to modulate DNMT1 and/or SIRT1 in CON cells. To do this, CON cells were treated with sEVs released from SEN cells. Their uptake was demonstrated by tracking sEVs with a fluorescent, membrane-permeable dye ()). The possibility of delivering small RNAs through sEVs was further tested by loading non-human cel-miR-39 onto sEVs released from SEN cells. The latter treatment resulted in qPCR-detectable levels of cel-miR-39 in CON cells, confirming the delivery of a considerable amount of cargo in this setting ()). Treatment of CON cells with sEVs from SEN cells resulted in a significantly increased expression of miR-21-5p and miR-217 ()). To evaluate whether this observation was related to the intracellular delivery of the copies of miR-21-5p and miR-217 loaded onto SEN sEVs or to the induction of the transcription of the two miRNAs in the recipient cells, we assessed the levels of pri-miR-21 using SEN cells as a positive control. Treatment of CON cells with SEN sEVs was not able to induce the up-regulation of pri-miR-21 ()).
Figure 6. Modulation of DNMT1/SIRT1 and of replicative rate biomarkers induced in CON cells by treatment with sEVs released from SEN cells. (a) Immunofluorescence staining showing effective uptake in CON of sEVs released from SEN cells. sEVs were labelled with PKH67 green fluorescent dye. Scale bars of 10 µm are applied. (b) qPCR analysis of cel-miR-39 in CON cells treated with sEVs loaded with cel-miR-39. (c) qPCR analysis of miR-21-5p and miR-217 in CON cells treated with sEVs from SEN and with sEVs from CON. (d) qPCR analysis of pri-miR-21 in CON cells treated with sEVs from SEN and with sEVs from CON, and in SEN cells. (e) Western blots showing modulation of DNMT1 and SIRT1 protein levels in CON cells treated with sEVs released from SEN without and with miR-217 and miR-21 inhibitors. CON sEVs and cel-miR-39 were used as negative controls to exclude non-specific effects due to the treatment with sEVs and miRNAs, respectively. (f) Densitometric analysis of SIRT1 and DNMT1 protein level modulation in CON cells treated with sEVs released from SEN without and with miR-217 and miR-21 inhibitors. The effects of sEVs on SIRT1 and DNMT1 appear to be miR-21-5p- and miR-217-dependent. Protein expression values are reported as SIRT1/α-tubulin and SIRT1/α-tubulin ratios. (g) Immunofluorescence Ki67 staining of CON cells CON cells treated with sEVs released from SEN without and with miR-217 and miR-21 inhibitors. Scale bars of 100 µm are applied. (h) Quantification of Ki67-positive cells. (i) PCNA, (m) cyclin D1, cyclin A, cyclin B1 mRNA relative expression in CON cells treated with sEVs released from SEN cells without and with miR-217 and miR-21 inhibitors. (l) Evaluation of senescence-associated heterochromatin foci (SAHF) based on the calculation of the CV of the HOECHST staining in at least 200 nuclei of CON cells treated with sEVs without and with miR-217 and miR-21 inhibitors. Treatment of CON cells with sEVs released from SEN cells induced significant reduction of proliferation markers and the formation of SAHF. These effects were significantly reduced by treatment with sEVs released from SEN cells loaded with miR-21-5p inhibitor, suggesting that the effects of SEN sEVs on CON cell replication are, at least partly, miR-21-5p-dependent. (n) Assessment of apoptosis rate in CON cells treated with sEVs released from SEN cells. Annexin V+/AAD7- and annexin V+/7AAD+ cells were respectively considered to be early- and late-apoptotic cells. (o) p16, IL-6, IL-8, IL-1β mRNA relative expression in CON cells treated with sEVs released from SEN cells. (p) Methylation status of the MIR21 locus in SEN cells and in CON cells treated with sEVs released from SEN cells. The microarray probe cg02515217 is significantly under-methylated in SEN cells and in CON cells treated with SEN sEVs compared to CON cells. *, CON vs CON + SEN sEVs; #, CON vs SEN. Data from n = 3 independent experiments are represented as mean ± SD. */#, p < 0.05; **, p < 0.01; ***, p < 0.001 from one-way ANOVA followed by Tukey’s multiple comparison test for pairwise comparisons.
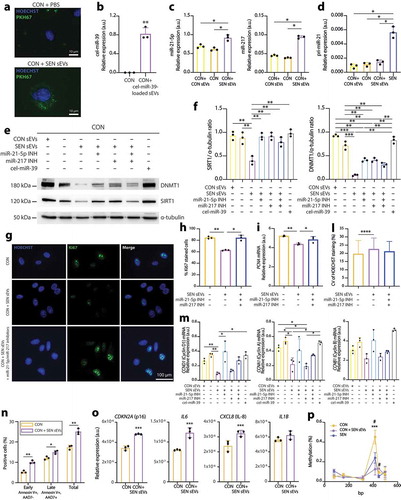
Treatment of CON cells with SEN sEVs also significantly reduced the expression of DNMT1 and SIRT1 (,)). This effect was not reproducible by treating CON cells with CON sEVs and was significantly rescued when SEN sEVs were loaded with miR-21-5p and miR-217 inhibitors, alone or combined (,)). This suggests that both miRNAs are involved in DNMT1 and SIRT1 modulation.
A reduction in CON cell replication ability, demonstrated by reduced Ki67 staining, was observed during the 18-h treatment with SEN sEVs (,)) and was associated with reduced PCNA ()), cyclin D1 and cyclin A ()) expression. Importantly, the effects of SEN sEV uptake in CON cells appeared to be miR-21-5p-dependent. A trend towards the reduction of cyclin B mRNA was observed in treated CON cells, even if it did not reach statistical significance ()). Notably, CON cells treated with SEN sEVs showed an increased formation of SAHF, as confirmed by the increased CV of the HOECHST staining intensity. This effect was not rescued by the addition of miR-21-5p/miR-217 inhibitors ()).
We then performed Annexin V and 7-AAD staining and flow cytometry to quantify the rate of apoptosis in CON cells after treatment with SEN sEVs. As shown in ), the percentage of cells undergoing early (Annexin V+/7-AAD-) and late (Annexin V+/7-AAD+) apoptosis was significantly increased in CON cells treated with SEN sEVs compared with CON cells, demonstrating that SEN sEVs are able to induce apoptosis in CON cells after 18-h treatment.
Next, we evaluated whether treatment with SEN sEVs was capable of inducing a senescent phenotype in CON cells. A significant increase in the expression of p16, IL-6 and IL-8 mRNAs was observed, whereas no significant up-regulation of IL-1β mRNA was reported ()).
As a final experiment, we assessed the methylation level of MIR21 locus in CON and SEN cells, and in CON cells treated with SEN sEVs using the quantitative EpiTYPER assay. Treatment of CON cells with SEN sEVs was able to induce a significant demethylation of the fourth CpG site of the amplicon (corresponding to the microarray probe cg02515217, located in the TSS200 region), resulting in methylation levels comparable to those observed in SEN cells ()).
Overall, SEN sEVs proved capable of modulating apoptosis and a number of key senescence features, i.e. cellular proliferation, SASP acquisition and DNMT1/SIRT1 expression. The effects on proliferation appear to be at least partly miR-21-5p-dependent, whereas those on DNMT1-SIRT1 expression appear to be dependent on miR-21-5p as well as miR-217. The down-regulation of DNMT1 in CON cells treated with SEN sEVs induced a partial demethylation of the MIR21 locus which, however, was not associated to an increased transcription of miR-21-5p in treated cells.
miRNA profiling in circulating EVs from healthy adults of different ages
The finding that SEN cells can spread pro-senescence signals via miRNAs carried by their sEVs suggested a further experiment, where EVs purified from plasma of 12 healthy adult donors of different ages were subjected to NGS analysis. Donors were grouped into three gender-matched age groups, young (n = 4), elderly (n = 4) and centenarians (n = 4), whose mean age was 50 ± 8 years, 74 ± 9 years and 102 ± 1 year, respectively. The demographic and clinical characteristics of the 12 donors are reported in Supplementary Table 8. There were no age-related differences in the number of sEVs purified from plasma among the groups (p = 0.873, data not shown). Of the 1186 miRNAs detected by the analysis, 360 were expressed in EVs from at least two subjects in at least one group. These were included in the subsequent analysis. Age-related trends were identified by applying PCA with varimax rotation converging after 11 iterations and yielding 11 components with an eigenvalue > 1.0. Three components explaining more than 45% of the total variance were retained. The PCA plot ()) indicates that PC1 and PC2 enable clear separation of the miRNA expression profiles of the three groups of subjects, explaining respectively 18.8% and 15.1% of the total variance. The component loading for each miRNA is reported in Supplementary Table 9. Analysis of the factor scores reflecting the weighted level of the miRNAs expressed in the three groups identified an inverted U-shape distribution for factor 1, a slightly declining trend for factor 2 and a rising trend for factor 3 ()). MiR-21-5p showed a strong loading on factor 1 (loading score = 0.655) ()), whereas miR-217 was not detected in circulating EVs. We further validated miR-21-5p levels in plasma EVs from the same subjects by qPCR and confirmed that miR-21-5p levels follow the same age-related inverted U-shaped trend observed for factor 1 ()).
Figure 7. Profiling of miRNAs identified in circulating EVs purified from plasma of healthy adult subjects of different ages. (a) PCA factor analysis with varimax rotation of 360 miRNAs detectable in at least two samples of at least one group of healthy donors. Rotation converged after 11 iterations and yielded 11 components with an eigenvalue > 1.0. Three components explaining more than 45% of the total variance were retained. PC1 and PC2, explaining respectively 18.8% and 15.1% of the total variance, are represented. Circles represent 95% confidence intervals. (b) Line plots showing the estimated marginal means for factors 1, 2 and 3 regression scores across the three age groups (<65 years, ≥65 years and centenarians). (c) qPCR validation of miR-21-5p levels in EVs from healthy donors. Data from four subjects in each age group are displayed as mean ± SD. *, p < 0.05; **, p < 0.01; ***, p < 0.001 from one-way ANOVA followed by Tukey’s multiple comparison test for pairwise comparisons. (d) Ingenuity Pathway Analysis (IPA) on miRNAs loading on factor 1 with a score > 0.60 or < −0.60. Association of this dataset with the “diseases and disorders” IPA database revealed a significant enrichment of the subcategory “inflammation of organ”.
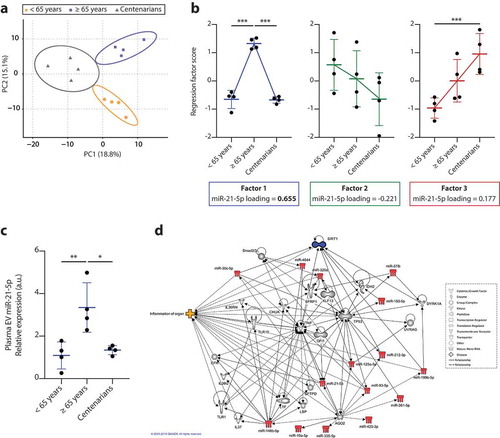
These data showed that in elderly people circulating EVs are characterised by increased miR-21-5p levels compared with either younger adults and healthy centenarians, suggesting that the EV miR-21-5p content can be a marker of cellular senescence and inflammaging. This finding lends support to our group’s earlier report of an inverse U-shaped age-related trend of miR-21-5p purified from total plasma [Citation57].
According to IPA, SIRT1 and miR-21-5p are spokes in a network that includes miRNA loading on factor 1 with a score > 0.60 or < −0.60. TNF and TP53 can be considered as hubs. The association of the miRNAs loaded on factor 1 with the IPA database “diseases and disorders” revealed a significant enrichment of the sub-category “inflammation of organ”, confirming the hypothesis that an inverse U-shaped trend reflects high circulating levels of the biomarkers of inflammaging in elderly individuals ()).
Putative SA loop involving miR-21-5p and miR-217
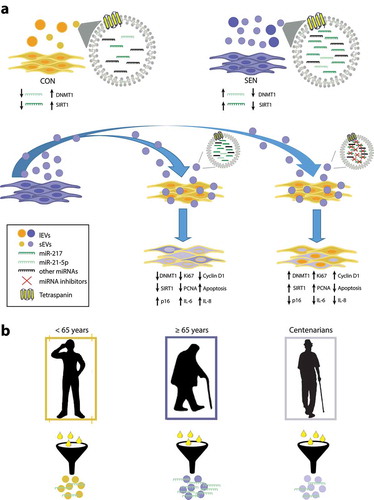
The main results of the study are reported in , which depicts a putative SA loop encompassing miR-21-5p and miR-217. In particular, the miR-21 locus is demethylated in SEN cells, resulting in miR-21-5p over-expression in these cells, which are marked by low levels of DNMT1 and SIRT1. sEVs released from SEN cells are enriched in miR-21-5p and miR-217 and can contribute to reduce DNMT1 and SIRT1 expression in younger recipient cells, promoting demethylation of the locus encoding miR-21 and increasing its transcription. This vicious circle could be critical in the maintenance of the epigenetic “senescence program” that propagates senescence signals from SEN to CON cells through sEVs. The inverse U-shaped age-related trend of miR-21-5p carried by circulating sEVs suggests a potential role for it as a circulating biomarker associated with senescence and inflammaging.
Figure 8. Overview of the SA effects of miR-21-5p and miR-217 carried by SEN sEVs into CON cells. (a) Graphic representation of the SA loop involving miR-21-5p. The miR-21 locus is de-methylated in SEN cells; the resulting miR-21-5p over-expression can contribute to reduce DNMT1/SIRT1 expression in SEN cells. sEVs released from SEN cells are enriched in miR-21-5p; their delivery to CON cells modulates DNMT1/SIRT1 and impairs their replication rate. This vicious cycle may be critical in maintaining the epigenetic “senescence program” through the spread of pro-senescence signals to younger cells through an increased sEV release. (b) MiR-21-5p in sEVs purified from plasma of healthy young, elderly and centenarian individuals showed an inverse U-shaped age-related trend, suggesting that miR-21-5p loaded on sEVs could be a systemic biomarker of senescence and inflammaging.
Discussion
Emerging evidence strongly supports the hypothesis that EVs mediate the effects of senescent cells on their micro-environment and that they do so at least partly through their miRNA cargo [Citation23,Citation58–Citation61]. We set out to establish the relative contribution of the miRNAs carried by EVs released from senescent ECs in spreading pro-senescence signals to younger cells. The first relevant finding was that senescent cells release a significantly greater number of sEVs than control cells, a finding that was corroborated by the detection in senescent cells of a significantly increased number of MVBs, the endocytic organelles that generate sEVs. These data agree with recent studies of a mouse model of oncogene-induced senescence and human lung fibrotic lesions enriched in senescent cells [Citation62], bone marrow stromal cells [Citation63], human prostate cancer cells [Citation24] and chondrocytes [Citation64].
Another major question was whether EVs contained the same miRNA repertoire as the cells that had released them. Global miRNA profiling of SEN and CON cells and their cognate EVs (sEVs and lEVs) showed that cells and their EVs shared about 33% of the miRNAs. Surprisingly, lEVs and sEVs shared only 24%, supporting the hypothesis that different EVs shuttle different cargo [Citation65,Citation66]. Since SEN cells released significantly more sEVs than CON cells, we focused on the miRNAs showing concordant modulation in sEVs and their parental SEN cells. This, we reasoned, would also help reduce the risk of potential contamination from the EVs contained in the FBS serum supplement used in the culture medium [Citation67].
Analysis of SEN sEVs showed that they were enriched in miR-21-5p and miR-217, both of which were over-expressed in SEN cells and were capable of targeting DNMT1 and SIRT1, two key enzymes in methylation pattern maintenance. Our data are in line with previous reports associating miR-21-5p and miR-217 with cellular senescence. MiR-21-5p over-expression has been seen to reduce EC replicative lifespan, whereas its stable knockdown by sponges has been reported to extend it [Citation68,Citation69]. MiR-21-5p over-expression has also been related to the development of cardiac fibrosis [Citation70], T-cell subset alteration [Citation71] and imbalances in platelet function [Citation72], all functions that are affected by ageing. An intriguing mechanism has also been described, where DNMT1 inhibition was induced by miR-21-5p binding the DNMT1 catalytic site rather than its mRNA [Citation54]. As regards miR-217 over-expression, it has been related to a premature senescence-like phenotype both in EC models (through impaired angiogenesis via SIRT1 inhibition [Citation56]) and in fibroblasts (through direct suppression of DNMT1-mediated methylation of p16 and pRb [Citation55]).
Notably, we were able to replicate the same observations in another EC lineage undergoing replicative senescence, and in a model of drug-induced senescence. The expression levels of cellular and sEV miR-21-5p and miR-217 in drug-induced senescence were comparable to those obtained in the replicative senescence models. The variations of the miRNA pool according to the different mechanisms of senescence are under-investigated. In this context, our results support the hypothesis that senescence-associated miRNAs participate in the control of a core set of senescence genes regardless of the pro-senescence stimulus [Citation73].
When we explored the biological effects of SEN sEVs on younger cells, treatment of CON cells with SEN sEVs induced a significant reduction in DNMT1 and SIRT1 expression, which was associated with a reduction in cell replicative rate, with the acquisition of a senescent phenotype, and with a partial demethylation of the locus encoding for miR-21. The demethylation of the MIR21 locus was not coupled with the enhanced transcription of the miR-21-5p precursor pri-miR-21 in recipient cells. This suggests that (i) the increased levels of miR-21-5p and miR-217 in CON cells treated with SEN sEVs are related to the intracellular delivery of the sEV cargo, and (ii) a prolonged exposure to SEN sEVs could be required to establish the vicious cycle leading to miR-21-5p transcription in cells treated with CON sEVs. The most striking finding in this context was that miR-21-5p and miR-217 loaded on sEVs played a key role in DNMT1-SIRT1 modulation, with miR-21-5p being the major factor inducing replicative rate reduction in recipient cells. The under-expression of DNMT1 and SIRT1 detected in SEN HUVECs is not induced by changes in the methylation state of their loci, but by fine regulation by miR-21-5p and miR-217. These findings shed new light on the mechanisms promoting the spread of senescence via the bystander effect. Notably, miR-21-5p shuttling through sEVs has been associated with different biological functions depending on donors and recipient cell types [Citation74,Citation75]. While miR-21-5p has been extensively designated as an oncomiR [Citation76], its role on the proliferative rate of non-cancer and replicative senescent cells is still debated. Our findings are in agreement with previous reports showing an anti-proliferative role of miR-21 on endothelial cells [Citation68,Citation77]. We can hypothesise that these effects could be related to the different transcriptional landscape between normal and cancer cells. In the latter, the inhibitory effects of miR-21 on many cell cycle regulators are potentially overwhelmed by gain-of-function somatic mutations.
As a final experiment, we set out to find in vivo evidence to compare with our in vitro data. Analysis of the miRNome profile of EVs purified from plasma of healthy subjects of different ages demonstrated for the first time that miR-21-5p shuttled by circulating EVs shows an inverse U-shaped trend, and that the trend becomes apparent only when centenarians are included in the analysis. We previously described an inverse U-shaped age-related trend for miR-21-5p during normal ageing and significantly increased miR-21-5p plasma levels in patients with ARDs such as cardiovascular disease and type 2 diabetes [Citation57,Citation61,Citation78].
Notably, non-monotonic age-related trends have first been described for genetic determinants of human longevity; these studies suggested that the effects of mortality trends for different genotypes observed in cross-sectional studies could depend on interactions between genetic and epigenetic factors [Citation79]. Experimental data about such interactions have begun to emerge only in recent years [Citation80].
Our findings strongly support the hypothesis that circulating miR-21-5p may be an archetypal “inflamma-miR” related to cellular senescence and inflammaging, and that its non-monotonic age-related trend may be the result of the complex adaptive/selective remodelling that occurs during ageing. Crucially, therapies targeting miR-21 are already progressing to the clinical trial phase [Citation81,Citation82].
Interestingly, DNMT1 levels in circulating cells from healthy subjects of different ages exhibit a U-shaped pattern that mirrors the expression of miR-21-5p carried by circulating EVs [Citation83].
Altogether, we provide proof of principle that senescent endothelial cells can spread their miRNA signature, thus contributing to the development of a pro-ageing environment, and that these miRNAs can be selectively packaged in and delivered through sEVs. Critically, the results obtained in vivo for miR-21-5p lend strong support to the in vitro observations and to the notion that cellular senescence is, at least partly, fractal of the ageing process; they also indicate that circulating factors derived from senescent cells can be used as biomarkers to depict and track ageing trajectories [Citation84]. Even though senescence has been described as a terminal process, mounting evidence supports the view that the adverse effects of the senescence program can be attenuated or delayed [Citation85] and that sEVs could play a critical anti-senescence role [Citation86–Citation88].
In conclusion, our findings pave the way for further research, in particular to work out how circulating pro-senescence signals carried by vesicles can become druggable targets that can help modulate the ageing process and delay ARD development. The discovery of several drugs targeting DNMT1 and SIRT1 and the possibility to modulate miRNA expression are making this ambitious goal easier to reach.
Supplemental Material
Download Zip (15.1 MB)Acknowledgments
We wish to thank all the donors and their families. We gratefully acknowledge infrastructure support from the IRCCS INRCA Institute and Università Politecnica delle Marche. We are grateful to Word Designs for text editing (www.silviamodena.com).
Disclosure statement
The authors report no conflicts of interest.
Supplementary material
Supplemental data for this article can be accessed here.
Additional information
Funding
References
- Childs BG, Durik M, Baker DJ, et al. Cellular senescence in aging and age-related disease: from mechanisms to therapy. Nat Med. 2015;21(12):1424–23.
- Acosta JC, Banito A, Wuestefeld T, et al. A complex secretory program orchestrated by the inflammasome controls paracrine senescence. Nat Cell Biol. 2013;15(8):978–990.
- McHugh D, Gil J. Senescence and aging: causes, consequences, and therapeutic avenues. J Cell Biol. 2018;217(1):65–77.
- Franceschi C, Bonafe M, Valensin S, et al. Inflamm-aging. An evolutionary perspective on immunosenescence. Ann N Y Acad Sci. 2000;908:244–254.
- da Silva PFL, Ogrodnik M, Kucheryavenko O, et al. The bystander effect contributes to the accumulation of senescent cells in vivo. Aging Cell. 2019;18(1):e12848.
- Fulop T, Witkowski JM, Olivieri F, et al. The integration of inflammaging in age-related diseases. Semin Immunol. 2018;40:17–35.
- Baker DJ, Childs BG, Durik M, et al. Naturally occurring p16(Ink4a)-positive cells shorten healthy lifespan. Nature. 2016;530(7589):184–189.
- Bussian TJ, Aziz A, Meyer CF, et al. Clearance of senescent glial cells prevents tau-dependent pathology and cognitive decline. Nature. 2018;562(7728):578–582.
- Childs BG, Gluscevic M, Baker DJ, et al. Senescent cells: an emerging target for diseases of ageing. Nat Rev Drug Discov. 2017;16(10):718–735.
- Prata L, Ovsyannikova IG, Tchkonia T, Kirkland JL. Senescent cell clearance by the immune system: emerging therapeutic opportunities. Semin Immunol. 2018;40:101275.
- Watroba M, Dudek I, Skoda M, et al. Sirtuins, epigenetics and longevity. Ageing Res Rev. 2017;40:11–19.
- Munk R, Panda AC, Grammatikakis I, et al. Senescence-associated microRNAs. Int Rev Cell Mol Biol. 2017;334:177–205.
- Hekmatimoghaddam S, Dehghani Firoozabadi A, Zare-Khormizi MR, et al. Sirt1 and Parp1 as epigenome safeguards and microRNAs as SASP-associated signals, in cellular senescence and aging. Ageing Res Rev. 2017;40:120–141.
- Wagner W, Weidner CI, Lin Q. Do age-associated DNA methylation changes increase the risk of malignant transformation? Bioessays. 2015;37(1):20–24.
- Lee SH, Lee JH, Lee HY, et al. Sirtuin signaling in cellular senescence and aging. BMB Rep. 2019;52(1):24–34.
- Wakeling LA, Ions LJ, Escolme SM, et al. SIRT1 affects DNA methylation of polycomb group protein target genes, a hotspot of the epigenetic shift observed in ageing. Hum Genomics. 2015;9:14.
- Zwergel C, Romanelli A, Stazi G, et al. Application of small epigenetic modulators in pediatric medulloblastoma. Front Pediatr. 2018;6:370.
- Williams J, Smith F, Kumar S, et al. Are microRNAs true sensors of ageing and cellular senescence? Ageing Res Rev. 2017;35:350–363.
- Chanda D, Otoupalova E, Hough KP, et al. Fibronectin on the surface of extracellular vesicles mediates fibroblast invasion. Am J Respir Cell Mol Biol. 2019;60(3):279–288.
- de Jong OG, Verhaar MC, Chen Y, et al. Cellular stress conditions are reflected in the protein and RNA content of endothelial cell-derived exosomes. J Extracell Vesicles. 2012;1(1):18396.
- Alexander M, Hu R, Runtsch MC, et al. Exosome-delivered microRNAs modulate the inflammatory response to endotoxin. Nat Commun. 2015;6:7321.
- Zhang Y, Kim MS, Jia B, et al. Hypothalamic stem cells control ageing speed partly through exosomal miRNAs. Nature. 2017;548(7665):52–57.
- Terlecki-Zaniewicz L, Pils V, Bobbili MR, et al. Extracellular vesicles in human skin: cross-talk from senescent fibroblasts to keratinocytes by miRNAs. J Invest Dermatol. 2019;139:2425–2436.e5.
- Lehmann BD, Paine MS, Brooks AM, et al. Senescence-associated exosome release from human prostate cancer cells. Cancer Res. 2008;68(19):7864–7871.
- Takahashi A, Okada R, Nagao K, et al. Exosomes maintain cellular homeostasis by excreting harmful DNA from cells. Nat Commun. 2017;8:15287.
- Takasugi M, Okada R, Takahashi A, et al. Small extracellular vesicles secreted from senescent cells promote cancer cell proliferation through EphA2. Nat Commun. 2017;8:15729.
- Eitan E, Green J, Bodogai M, et al. Age-related changes in plasma extracellular vesicle characteristics and internalization by leukocytes. Sci Rep. 2017;7(1):1342.
- Takasugi M. Emerging roles of extracellular vesicles in cellular senescence and aging. Aging Cell. 2018;17:2.
- Alique M, Ruiz-Torres MP, Bodega G, et al. Microvesicles from the plasma of elderly subjects and from senescent endothelial cells promote vascular calcification. Aging (Albany NY). 2017;9(3):778–789.
- Weilner S, Schraml E, Wieser M, et al. Secreted microvesicular miR-31 inhibits osteogenic differentiation of mesenchymal stem cells. Aging Cell. 2016;15(4):744–754.
- Hosseinkhani B, Kuypers S, van den Akker NMS, et al. Extracellular vesicles work as a functional inflammatory mediator between vascular endothelial cells and immune cells. Front Immunol. 2018;9:1789.
- Liu JY, Souroullas GP, Diekman BO, et al. Cells exhibiting strong p16 (INK4a) promoter activation in vivo display features of senescence. Proc Natl Acad Sci U S A. 2019;116(7):2603–2611.
- Regina C, Panatta E, Candi E, et al. Vascular ageing and endothelial cell senescence: molecular mechanisms of physiology and diseases. Mech Ageing Dev. 2016;159:14–21.
- Olivieri F, Lazzarini R, Recchioni R, et al. MiR-146a as marker of senescence-associated pro-inflammatory status in cells involved in vascular remodelling. Age (Dordr). 2013;35(4):1157–1172.
- Cawthon RM. Telomere measurement by quantitative PCR. Nucleic Acids Res. 2002;30(10):e47.
- Rueden CT, Schindelin J, Hiner MC, et al. ImageJ2: imageJ for the next generation of scientific image data. BMC Bioinformatics. 2017;18(1):529.
- Riboli E, Hunt KJ, Slimani N, et al. European prospective Investigation into cancer and nutrition (EPIC): study populations and data collection. Public Health Nutr. 2002;5(6B):1113–1124.
- Aryee MJ, Jaffe AE, Corrada-Bravo H, et al. Minfi: a flexible and comprehensive Bioconductor package for the analysis of Infinium DNA methylation microarrays. Bioinformatics. 2014;30(10):1363–1369.
- Huber W, Carey VJ, Gentleman R, et al. Orchestrating high-throughput genomic analysis with bioconductor. Nat Methods. 2015;12(2):115–121.
- Triche TJ Jr., Weisenberger DJ, Van Den Berg D, et al. Low-level processing of illumina infinium DNA methylation bead arrays. Nucleic Acids Res. 2013;41(7):e90.
- Fortin JP, Labbe A, Lemire M, et al. Functional normalization of 450k methylation array data improves replication in large cancer studies. Genome Biol. 2014;15(12):503.
- Guescini M, Maggio S, Ceccaroli P, et al. Extracellular vesicles released by oxidatively injured or intact C2C12 myotubes promote distinct responses converging toward myogenesis. Int J Mol Sci. 2017;18:11.
- Thery C, Witwer KW, Aikawa E, et al. Minimal information for studies of extracellular vesicles 2018 (MISEV2018): a position statement of the International Society for Extracellular Vesicles and update of the MISEV2014 guidelines. J Extracell Vesicles. 2018;7(1):1535750.
- Consortium E-T, Van Deun J, Mestdagh P, et al. EV-TRACK: transparent reporting and centralizing knowledge in extracellular vesicle research. Nat Methods. 2017;14(3):228–232.
- Kozomara A, Birgaoanu M, Griffiths-Jones S. miRBase: from microRNA sequences to function. Nucleic Acids Res. 2019;47(D1):D155–D162.
- Giuliani A, Cirilli I, Prattichizzo F, et al. The mitomiR/Bcl-2 axis affects mitochondrial function and autophagic vacuole formation in senescent endothelial cells. Aging (Albany NY). 2018;10(10):2855–2873.
- Li JH, S L, Zhou H, et al. starBase v2.0: decoding miRNA-ceRNA, miRNA-ncRNA and protein-RNA interaction networks from large-scale CLIP-Seq data. Nucleic Acids Res. 2014;42(Database issue):D92–97.
- McQuin C, Goodman A, Chernyshev V, et al. CellProfiler 3.0: next-generation image processing for biology. PLoS Biol. 2018;16(7):e2005970.
- Sharma A, Singh K, Almasan A. Histone H2AX phosphorylation: a marker for DNA damage. Methods Mol Biol. 2012;920:613–626.
- Cruickshanks HA, McBryan T, Nelson DM, et al. Senescent cells harbour features of the cancer epigenome. Nat Cell Biol. 2013;15(12):1495–1506.
- Lopez-Otin C, Blasco MA, Partridge L, et al. The hallmarks of aging. Cell. 2013;153(6):1194–1217.
- Turchinovich A, Drapkina O, Tonevitsky A. Transcriptome of extracellular vesicles: state-of-the-art. Front Immunol. 2019;10:202.
- Pan W, Zhu S, Yuan M, et al. MicroRNA-21 and microRNA-148a contribute to DNA hypomethylation in lupus CD4+ T cells by directly and indirectly targeting DNA methyltransferase 1. J Immunol. 2010;184(12):6773–6781.
- Zhang G, Esteve PO, Chin HG, et al. Small RNA-mediated DNA (cytosine-5) methyltransferase 1 inhibition leads to aberrant DNA methylation. Nucleic Acids Res. 2015;43(12):6112–6124.
- Wang B, Du R, Xiao X, et al. Microrna-217 modulates human skin fibroblast senescence by directly targeting DNA methyltransferase 1. Oncotarget. 2017;8(20):33475–33486.
- Menghini R, Casagrande V, Cardellini M, et al. MicroRNA 217 modulates endothelial cell senescence via silent information regulator 1. Circulation. 2009;120(15):1524–1532.
- Olivieri F, Spazzafumo L, Santini G, et al. Age-related differences in the expression of circulating microRNAs: miR-21 as a new circulating marker of inflammaging. Mech Ageing Dev. 2012;133(11–12):675–685.
- Urbanelli L, Buratta S, Sagini K, et al. Extracellular vesicles as new players in cellular senescence. Int J Mol Sci. 2016;17:9.
- Xu D, Tahara H. The role of exosomes and microRNAs in senescence and aging. Adv Drug Deliv Rev. 2013;65(3):368–375.
- Kim KM, Abdelmohsen K, Mustapic M, et al. RNA in extracellular vesicles. Wiley Interdiscip Rev RNA. 2017;8:4.
- Dluzen DF, Noren Hooten N, Evans MK. Extracellular RNA in aging. Wiley Interdiscip Rev RNA. 2017;8:2.
- Borghesan M, Fafian-Labora J, Eleftheriadou O, et al. Small extracellular vesicles are key regulators of non-cell autonomous intercellular communication in senescence via the interferon protein IFITM3. Cell Rep. 2019;27(13):3956–3971 e3956.
- Umezu T, Imanishi S, Azuma K, et al. Replenishing exosomes from older bone marrow stromal cells with miR-340 inhibits myeloma-related angiogenesis. Blood Adv. 2017;1(13):812–823.
- Jeon OH, Wilson DR, Clement CC, et al. Senescence cell-associated extracellular vesicles serve as osteoarthritis disease and therapeutic markers. JCI Insight. 2019;4:7.
- Villarroya-Beltri C, Gutierrez-Vazquez C, Sanchez-Cabo F, et al. Sumoylated hnRNPA2B1 controls the sorting of miRNAs into exosomes through binding to specific motifs. Nat Commun. 2013;4:2980.
- Murillo OD, Thistlethwaite W, Rozowsky J. exRNA atlas analysis reveals distinct extracellular RNA cargo types and their carriers present across human biofluids. Cell. 2019;177(2):463–477 e415.
- Lehrich BM, Liang Y, Khosravi P, et al. Fetal bovine serum-derived extracellular vesicles persist within vesicle-depleted culture media. Int J Mol Sci. 2018;19:11.
- Dellago H, Preschitz-Kammerhofer B, Terlecki-Zaniewicz L, et al. High levels of oncomiR-21 contribute to the senescence-induced growth arrest in normal human cells and its knock-down increases the replicative lifespan. Aging Cell. 2013;12(3):446–458.
- Zhu S, Deng S, Ma Q, et al. MicroRNA-10A* and microRNA-21 modulate endothelial progenitor cell senescence via suppressing high-mobility group A2. Circ Res. 2013;112(1):152–164.
- Thum T, Gross C, Fiedler J, et al. MicroRNA-21 contributes to myocardial disease by stimulating MAP kinase signalling in fibroblasts. Nature. 2008;456(7224):980–984.
- Kim C, Hu B, Jadhav RR, et al. Activation of miR-21-regulated pathways in immune aging selects against signatures characteristic of memory T cells. Cell Rep. 2018;25(8):2148–2162 e2145.
- Barwari T, Eminaga S, Mayr U, et al. Inhibition of profibrotic microRNA-21 affects platelets and their releasate. JCI Insight. 2018;3:21.
- Lafferty-Whyte K, Cairney CJ, Jamieson NB, et al. Pathway analysis of senescence-associated miRNA targets reveals common processes to different senescence induction mechanisms. Biochim Biophys Acta. 2009;1792(4):341–352.
- Hu Y, Rao SS, Wang ZX, et al. Exosomes from human umbilical cord blood accelerate cutaneous wound healing through miR-21-3p-mediated promotion of angiogenesis and fibroblast function. Theranostics. 2018;8(1):169–184.
- Mayourian J, Ceholski DK, Gorski PA, et al. Exosomal microRNA-21-5p mediates mesenchymal stem cell paracrine effects on human cardiac tissue contractility. Circ Res. 2018;122(7):933–944.
- Ge Y, Zhang L, Nikolova M, et al. Strand-specific in vivo screen of cancer-associated miRNAs unveils a role for miR-21(*) in SCC progression. Nat Cell Biol. 2016;18(1):111–121.
- Sabatel C, Malvaux L, Bovy N, et al. MicroRNA-21 exhibits antiangiogenic function by targeting RhoB expression in endothelial cells. PLoS One. 2011;6(2):e16979.
- Prattichizzo F, Micolucci L, Cricca M, et al. Exosome-based immunomodulation during aging: A nano-perspective on inflamm-aging. Mech Ageing Dev. 2017;168:44–53.
- Yashin AI, De Benedictis G, Vaupel JW, et al. Genes, demography, and life span: the contribution of demographic data in genetic studies on aging and longevity. Am J Hum Genet. 1999;65(4):1178–1193.
- Benayoun BA, Pollina EA, Brunet A. Epigenetic regulation of ageing: linking environmental inputs to genomic stability. Nat Rev Mol Cell Biol. 2015;16(10):593–610.
- Gomez IG, MacKenna DA, Johnson BG, et al. Anti-microRNA-21 oligonucleotides prevent Alport nephropathy progression by stimulating metabolic pathways. J Clin Invest. 2015;125(1):141–156.
- Wang D, Deuse T, Stubbendorff M, et al. Local microRNA modulation using a novel anti-miR-21-eluting stent effectively prevents experimental in-stent restenosis. Arterioscler Thromb Vasc Biol. 2015;35(9):1945–1953.
- Ciccarone F, Malavolta M, Calabrese R, et al. Age-dependent expression of DNMT1 and DNMT3B in PBMCs from a large European population enrolled in the MARK-AGE study. Aging Cell. 2016;15(4):755–765.
- Olivieri F, Capri M, Bonafe M, et al. Circulating miRNAs and miRNA shuttles as biomarkers: perspective trajectories of healthy and unhealthy aging. Mech Ageing Dev. 2017;165(Pt B):162–170.
- Shao Y, Lv C, Wu C, et al. Mir-217 promotes inflammation and fibrosis in high glucose cultured rat glomerular mesangial cells via Sirt1/HIF-1alpha signaling pathway. Diabetes Metab Res Rev. 2016;32(6):534–543.
- Yoshida M, Satoh A, Lin JB, et al. Extracellular vesicle-contained eNAMPT delays aging and extends lifespan in mice. Cell Metab. 2019;30(2):329–342 e325.
- Hu W, Ru Z, Zhou Y, et al. Lung cancer-derived extracellular vesicles induced myotube atrophy and adipocyte lipolysis via the extracellular IL-6-mediated STAT3 pathway. Biochim Biophys Acta Mol Cell Biol Lipids. 2019;1864(8):1091–1102.
- Prattichizzo F, Giuliani A, Sabbatinelli J, et al. Extracellular vesicles circulating in young organisms promote healthy longevity. J Extracell Vesicles. 2019;8(1):1656044.