
ABSTRACT
Alzheimer’s disease is a progressive neurodegenerative disorder, with the strongest disease-associated changes observed at clinical or end-stage disease. Transcriptomic deregulation of miRNA expression can spread via “horizontal” RNA transfer through extracellular vesicles (EVs) to act in conjunction with proteins, leading to changes in mRNA, which can provide early signals to indicate forthcoming neuropathological changes in the brain. Here, we analysed the small RNA content, in particular, miRNA, contained in brain-derived EVs isolated from the frontal cortex of Alzheimer’s subjects (n = 8) and neurological control subjects (n = 9). Brain-derived EVs were found to contain an upregulation of disease-associated miRNA. RNA species from brain-derived EVs were correlated with miRNA profiles obtained from matching total brain homogenate. These results provide a blueprint into the biological pathways potentially effected during disease that may be assisted by brain-derived EV RNA horizontal transfer.We also correlated the miRNA changes in the brain with those detected in peripheral EVs collected from serum of Alzheimer’s disease patients (n = 23, and healthy controls, n = 23) and revealed a panel of miRNA that could be used as a liquid brain biopsy. Overall, our study provides the first interrogation of the small RNA contents in brain-derived EVs and how they could be used to understand the early pathological changes in Alzheimer’s disease which will benefit the development of an early diagnostic blood test.
Introduction
Staging of Alzheimer’s disease (AD) related pathology and lesions, in particular amyloid-β (Aβ) plaques and neurofibrillary tangles, occurs in a predictable sequence across interconnected regions of the brain, known as Braak staging. These neuropathological changes occur at early stages before the onset of dementia which is difficult to diagnose, thus highlighting a need to identify biomarkers that can inform early changes in the brain. Neurofibrillary tangles appear at Braak stage I and II within the transentorhinal region and entorhinal region during the pre-clinical stage of AD, stage III and IV in the temporo-occipital cortex and temporal cortex on the appearance of symptoms followed by stage V and VI in the occipital cortex and neocortex [Citation1]. Generally, transcriptional deregulation can be detected earlier than the presence of pathological hallmarks and may be considered as the first indication of phenotypic changes in the brain [Citation2–Citation4]. miRNA is highly present in the brain compared to other tissues [Citation5] and early studies identified brain-enriched miRNA [Citation6] including those associated with AD detected as early as Braak stage III [Citation7,Citation8]. To further enhance sensitivity and detection at pre-clinical stage, miRNA can be isolated from enriched preparations of extracellular vesicles (EVs) from the brain to study the molecular events in the development of AD. Furthermore, the deregulation of miRNA expression can also spread via “horizontal” RNA transfer through EVs to act in conjunction with proteins leading to changes in mRNA and consequently destruction of biological functions within neuron and glia cells of the brain.
In physiological and neurodegenerative disturbances, EVs are known to modulate the cross talk between neurons and non-neuronal cell types such as microglia, astrocytes and dendrocytes. The most intensely studied subtype of EVs are exosomes or “small EVs“ which are approximately 50–200 nm in size, enveloped by a lipid bi-layer and formed by the inward invagination of the late endosomal membrane to form the multi-vesicular body (MVB) containing intraluminal vesicles (ILVs). Upon fusion of the MVB, the ILVs are released into the extracellular environment as exosomes and loaded with specific proteomic and genomic cargo packaged from the parental cell. The presence of proteins and the potential transfer of proteins via EVs to recipient cells has been hypothesized to be involved in spreading pathological factors in in vitro models including Aβ [Citation9,Citation10], Tau [Citation11,Citation12] and prions [Citation13,Citation14]. Until now, the literature has not studied the interplay of RNA species within exosomes present in the brain and how these profiles may change during AD pathology.
For this present study, we isolated brain-derived exosomes (BDEs) from post-mortem tissues obtained from neurological controls (NC) and AD subjects. The BDEs were characterised to be small EVs of endosomal origin, fulfilling the minimal requirements set out by the International Society for Extracellular Vesicles (ISEV) [Citation15,Citation16]. Enriched BDE miRNA profiles were compared to a heterogeneous population of EVs (F3 EVs) that was also collected during the procedure. Both vesicle samples were compared to the starting brain homogenates (BH) to determine whether their miRNA contents are representative of the BH, with the goal to understand the biological pathways effected due to changes in miRNA expression perturbation in the AD brain. Linking early miRNA deregulation to early pathological events such as impaired synaptic function, inflammatory pathways, endosomal/autophagy impairments may assist in identifying factors affecting the early stages of AD pathogenesis before further Aß accumulation.
Understanding the pre-clinical stage of AD will likely benefit the development of an early diagnostic blood test. While there have been several blood-based tests for AD reported, a limitation of biomarker studies in peripheral blood has been the inability to correlate biomarkers to AD-related brain pathology. It is hypothesized that exosomes from the brain can migrate across the blood brain barrier (BBB) into the blood [Citation17] where their brain biomarkers are readily detected and reflective of brain health. Equivalent to a “liquid brain biopsy”, brain-derived miRNAs may be more relevant and could provide better specificity to diagnose neurodegenerative diseases. Here, we utilized the previously published dataset from serum EVs and compared the miRNA profiles with the newly generated BDE and F3 EV miRNA profiles. We identified several AD-associated miRNAs present in both BDEs and serum EVs that are abundantly expressed which would be ideal blood biomarkers for AD as they would be easily detectable by qRT-PCR methods in a diagnostic lab.
Methods
Preparation of brain homogenates and small EV enrichment from human tissue
Frozen frontal cortex post-mortem tissues of age-matched individuals from NC (n = 9) and AD (n = 8) subjects (1.48 g–1.77 g, ) were obtained from the Victorian Brain Bank. All procedures were approved by The University of Melbourne human ethics committee and in accordance with the National Health and Medical Research Council guidelines. All procedures performed in studies involving human participants were in accordance with the ethical standards of the institutional and/or national research committee and with the 1964 Helsinki declaration and its later amendments or comparable ethical standards. Informed consent was obtained from all individual participants included in the study. Subjects were diagnosed as AD or control groups based on overall amyloid and tau pathology. Exosomes were enriched using the protocol previously published [Citation18]. Briefly, tissues were weighed, sliced into pieces and partially thawed on ice. A small representative sample of the total brain was put aside in RNA Later for processing into total BH. The remaining tissue was treated with 75 U/mL of collagenase type 3 in Hibernate-E (at a ratio of 800 μl per 100 mg of brain). Tissue was gently dissociated from the brain extracellular matrix by incubating in a shaking water bath at 37°C for 20 min with a gentle inversion and gentle resuspension mid-way during incubation. The tissue was returned to ice immediately after incubation and Protease and Phosphatase Inhibitor Cocktail (PI/PS) (to a final concentration 1×) added. The dissociated tissue was centrifuged at 300 × g for 5 min at 4°C. The tissue samples and 300 × g pellet were collected in phosphate buffered saline (PBS) (with PI/PS), homogenised by needle and syringe whereby the tissue was sequentially passed through 18-, 21-, 23- and 26-gauge needles. The samples were spun at 10,000 × g for 5 min 4°C and then the supernatant, now known as BH+C (brain homogenate treated with collagenase), stored at −80°C for later use. The supernatant from the 300 × g spin was transferred to a fresh tube, centrifuged at 2000 × g for 10 min at 4°C, followed by further centrifugation of the supernatant at 10,000 × g for 30 min at 4°C. The supernatant was overlaid on a triple sucrose cushion (0.6 M F2, 1.3 M F3, 2.5 M). The gradient was spun for 3 h at 180,000 × g (average) at 4°C (SW41 Beckman, ultra-clear tubes with 13.2 mL capacity). Fraction 2 (F2) and fraction 3 (F3), corresponding to 0.6 M and 1.3 M respectively were collected and the refractive index measured to confirm the gradient and collection of fractions was successful. Each fraction was diluted with ice cold PBS and spun at 100,000 × g (average) at 4°C (70.1Ti Beckman) for 1 h to pellet the vesicles. Following spin completion, the supernatant was discarded and pellet collected in ice cold PBS (with PI/PS). Samples were stored at −80°C until required. The EVs isolated from each subject underwent both transmission electron microscopy (TEM) and Western blotting to confirm successful EV enrichment and to ensure limited contamination with cellular debris prior to RNA analysis. Total BHs were lysed in ice cold PBS containing PI/PS using needle and syringe with increasing gauge size.
Table 1. Clinical demographics of post-mortem tissues.
Electron microscopy
An aliquot of each fraction in PBS was fixed with 1% glutaraldehyde for 30 min or overnight at 4°C, and 6 μl was absorbed onto glow-discharged 300-mesh heavy duty carbon-coated formvar Cu grids (ProSciTech, Kirwan, QLD, Australia) for 5 min, and excess was blotted on filter paper (Whatman, Maidstone, UK). Grids were washed twice with MilliQ water and negative stained with 2.5% uranyl acetate. Images were taken on a Tecnai G2 F30 (FEI, Eindhoven, The Netherlands) TEM operating at 300 kV. Wide-field images encompassing multiple vesicles were captured to provide an overview of the fraction in addition to close-up images. The electron microscopy was performed at the Bio21 Advanced Microscopy Facility, The Bio21 Molecular Science and Biotechnology Institute, The University of Melbourne.
Western blot
Equivalent amounts of brain or vesicle protein (determined by BCA assay Pierce) were electrophoresed on 4–12% Bis-Tris gels (NuPage; ThermoFisher) or 4–20% Criterion© TGX stainfree precast gels (Biorad) and then transferred onto nitrocellulose membrane (Biorad). Membranes were probed with primary antibody diluted in PBS-T overnight at 4°C and then with HRP secondary antibody (Amersham) for 1 h. Immunoreactivity was detected using enhanced chemiluminescence (ECL) solutions (Biorad) which was visualized using a Biorad ChemiDoc™ MP imaging system. To allow for visualization of total protein and ensure equal loading in the absence of an exosomal house-keeping protein, gels (Biorad) were activated by UV light to allow trihalo compounds within the gel to react with tryptophan residues of proteins in a UV-induced reaction to produce fluorescence which was visualized using a Biorad ChemiDoc™ MP imaging or membranes were stained with ponceau S (1% (w/v) ponceau S in 5% acetic acid). Primary antibodies used in this study were syntenin (Abcam EPR8012 ab133267) and calnexin (Abcam ab22595).
Participants and serum EV isolation
Serum samples from healthy controls (HC, n = 23) and those diagnosed with AD (n = 23) were obtained from the Australian Imaging, Biomarkers and Lifestyle (AIBL) Study of Ageing. The same samples were used during the discovery study to identify miRNA biomarkers associated with AD previously [Citation19]. Diagnosis was based on the establish criteria from the National Institute of Neurological and Communicative Diseases and Stroke–Alzheimer’s Disease and Related Disorders Association (NINCDA-ADRDA) [Citation20], which has been described in detail elsewhere [Citation21]. The demographics of the participants were published previously [Citation19]. Blood samples were collected from all patients (fasting) from whole blood venepuncture into Sarstedt s-monovette serum-gel 7.5 mL tubes 01.1602.001 (Sarstedt, Germany). Samples were processed within 2 h of collection and serum was snap frozen in liquid nitrogen. Informed consent was obtained from all AIBL participants and ethics were approved by the institutional ethics committees of Austin Health, St. Vincent’s Health, Hollywood Private Hospital and Edith Cowan University. Serum exosomal RNA was isolated using the Plasma/serum exosomal RNA isolation kit (Norgen Biotek, Canada) from 1 mL serum per participant whereby the manufacturers protocol was followed. Although this kit claims to isolate 'exosomes' we have been unable to characterise the vesicles produced as the protocol does not allow elution of the captured EVs before RNA isolation. Therefore, we have named the vesicles isolated from this kit as 'serum EVs'. The total serum EV RNA yield, composition and quality was analyzed by the Agilent 2100 Bioanalyzer using the Small RNA kit (Agilent). Serum EV RNA was converted into cDNA libraries using the Ion Total RNA-Seq Kit V2 (Life Technologies, Australia) and prepared for sequencing on the Ion Torrent Platform (Life Technologies) as described previously [Citation19].
Small RNA sequencing
Vesicle fractions isolated from brain tissues was treated with 10 µg/mL of RNase A (Qiagen) for 20 min at 37οC followed by RNA extraction using the Qiagen miRNeasy with the use of TRIzol-LS (ThermoFisher) for organic phase separation. The amount and quality of isolated small RNA was analysed by an Agilent 2100 Bioanalyzer using the Small RNA assay (Agilent Technologies) whilst the RNA 6000 assay measured total RNA in whole brain samples. Small RNA libraries were constructed using 100 ng of RNA extracted from BH and vesicle fractions using the Ion Total RNA-Seq Kit V2 (Life Technologies, Australia) and ligated to adapters containing a unique index barcode (Ion Xpress™ RNA-Seq Barcode 1–16 Kit, Life Technologies, Australia) according to the manufacturers’ protocol and as previously published [Citation18]. The yield and size distribution of the small RNA libraries were assessed using the Agilent 2100 Bioanalyzer™ instrument with the High sensitivity DNA chip (Agilent Technologies). Equally pooled libraries were prepared for deep sequencing using the Ion Chef system (Life Technologies) and sequenced on the Ion Torrent S5™ using Ion™ 540 chips (Life Technologies) and 200 bp chemistry (Life Technologies). Pre-processing of reads, removal of adapters and barcodes were performed using Torrent Suite (v.5.0.2). Sequences were analysed for quality control (FASTQC), aligned to the Human genome (HG19) using the Torrent Suite and files transferred to Partek Genomic Suite and Flow (Partek Incorporated, Singapore) for mapping against miRBase V.21 to identify miRNA species. Reads were normalized to reads per million (RPM). miRNAs identified with at least 10 reads were used for further analysis on Partek Genomic suite which included statistical analysis and hierarchical clustering. Gene Ontology (GO) analysis was performed using miRPathDB 2.0 [Citation22] to determine biological processes using experimental evidence. Small RNA sequencing on serum exosomal samples were constructed as previously published [Citation19].
Results
Characterisation of EVs isolated from post-mortem AD brains
We previously developed a method to enrich for small EVs from human frontal cortex that have the hallmarks of exosomes. This method maintains the integrity of the vesicles and their cargo, and comprehensive proteomic and genomic characterisation was used to confirm the legitimacy of the resulting EVs [Citation18]. In the current study, EVs were isolated from NC (n = 9) and AD (n = 8) () post-mortem frontal cortex using our previously published protocol [Citation18] and samples went through the same quality control measures as detailed in our previous study. Degraded tissue is not amenable to EV isolation, with factors such as post-mortem delay and storage negatively impacting tissue quality, resulting in contamination of EV pellets with cellular debris. We reported that immunoblotting provided the most robust quality-control measure, with proteins such as calnexin providing a useful indicator of EV preparation purity. Consequently, all tissue EVs isolated as part of the current study were subject to Western blotting and TEM (representative images in Supplementary Figure 1A and B) to screen for EV markers and contaminants before subjecting them to small RNA sequencing. Only preparations demonstrating enrichment of syntenin and absence of calnexin, in addition to the morphological hallmarks of exosomes, as previously published [Citation18], found in F2 of the sucrose gradient were classified as BDEs (Supplementary Figure 1B). Of the brain tissues obtained, seven NC and sevenAD F2 preparations qualified as BDEs and were profiled for small RNA. Vesicles observed in F3 (F3 EVs) by TEM displayed significantly smaller diameters between 30 and 50 nm (Supplementary Figure 1A) and were not positive for syntenin (Supplementary Figure 1B). The exact nature of these EVs is inconclusive however, due to their physical characteristics are likely to be a heterogeneous population of smaller EVs that include lipoprotein particles, most likely contaminated with other non-vesicular components. This needs further investigation using other fractionation methods together with lipidomics [Citation23,Citation24].
A major hurdle in the field is finding protein markers specific towards lipoprotein particles as these can resemble exosomes by their physical features. Recently, ISEV released an updated version of the minimal guidelines for studies of EVs and recommended EV researchers referred EV subtypes by their physical characteristics such as by size (“small EVs, medium EVs or large EVs”) within defined size ranges [Citation16]. The ISEV guidelines continue to evolve in this relatively new field, and conformity has not been reached with the characterization of EVs from brain tissues.
To assist the field in distinguishing the EV subtypes collected from F2 and F3 of a triple sucrose gradient, we also compared the RNA profile of BDEs to F3 EVs. Nonetheless, miRNAs have been reported to also be found in smaller EVs such as lipoprotein particles however, it is unknown whether the shift in EV diameter and density between F2 and F3 may contain different small RNA profiles or whether one fraction is more representative of BH. Vesicles were subjected to RNase A treatment to remove non-vesicle associated RNA and then subject to RNA isolation. RNA quantification by the Agilent Bioanalyzer showed the presence of small RNA in both F2 and F3 and yields were found to be similar across all samples (Supplementary Figure 1C and D).
The number of F3 EVs analysed for small RNA was eight NC and eight AD whereby one NC did not successfully amplify during small RNA library construction due to low RNA yield. Small RNA profiles from both vesicle fractions (BDEs and F3 EVs) were compared to the RNA extracted from BH to observe whether there was an enrichment of certain small RNA species in vesicles compared to BH. The number of BH libraries that were successfully constructed were nine NC and seven AD. Due to the nature of these precious post-mortem tissues, the success of library construction and sequencing could only be determined after the characterization of vesicles, analysing the extracted post-mortem RNA to ensure minimal degradation (Supplementary Figure 1E and F). Samples that fulfilled these quality control measurements at each stage were included in the Bioinformatic analysis from herein.
BDEs and F3 EVs exhibit distinct small RNA profiles compared to total brain
Complete small profiles extracted from BDEs (NC, n = 7 and AD, n = 7), F3 EVs (NC, n = 8 and AD, n = 8) and BH (NC, n = 9 and AD, n = 7) () isolated from AD and NC post-mortem tissues were produced from performing small RNA sequencing and mapping to several classes of RNA species. The first bioinformatic comparison performed was analysing the RNA biotypes detected between BDEs, F3 EVs and BH within each disease state (, bioinformatic comparison #1). The libraries were first mapped to miRNAs (miRBase v.21) followed by other non-coding small RNA species including snRNA, lincRNA, vtRNA, scaRNA and snoRNA ()). Other RNA biotypes were tRNA, mRNA, mtRNA and lncRNA which were mostly observed as transcript fragments. Libraries were size selected at approximately 18–150 nt during small RNA library construction and therefore the RNA fragments represent transcript fragments, such as tRNA halves, rather than full length.
Figure 1. Pipeline showing the bioinformatics comparisons performed in this study.
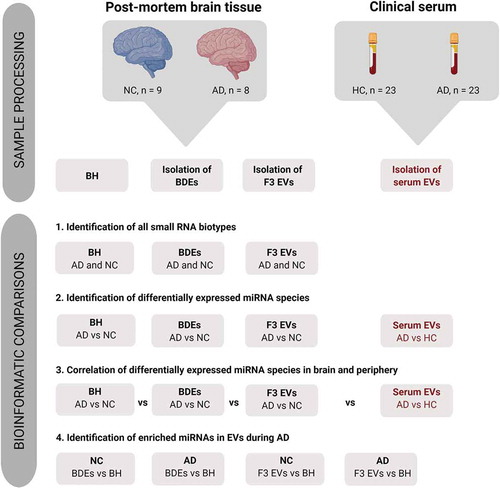
Figure 2. Distinct small RNA and miRNA composition in BH, BDEs and F3 EVs.
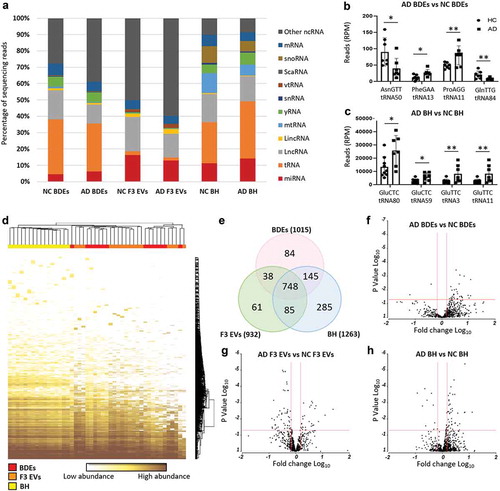
As expected, BH were found to map to most types of small RNA species and contained mostly tRNA (25–35%) followed by lncRNA (15–17%) and miRNA (11–14%). Overall, the most distinct RNA biotypes between the sample types were the percentages of miRNA (4–6% in BDEs, 13–16% in F3 EVs and 11–14% in BH), mtRNA (less than 1% in BDEs and F3 EVs but 6–12% in BH), snoRNA (less than 1% in BDEs and F3 EVs but 6–10% in BH) and yRNA (less than 1% in F3 EVs but 5–7% in BDEs and BH). BDEs contained less miRNA reads compared to F3 EVs and BH. However, BDEs shared similar tRNA enrichment with BH suggesting that BDEs are highly enriched with tRNA fragments, a feature consistently observed in bone-fide exosomes [Citation25,Citation26]. miRNAs can be seen enriched in exosomes however, in this study, are found relatively higher in the F3 EVs. F3 EVs are relatively smaller in diameter and potentially are unable to package longer RNA biotypes leading to an enrichment of miRNA and smaller RNA fragments. Although these vesicles were RNaseA treated, other non-vesicle material may be present in F3 EVs such as ribonucleoprotein complexes [Citation18]. The strongest differentiator between BDEs and F3 EVs is the amount of tRNA present in each of these vesicle preparations. There is a strong enrichment of tRNA in BDEs compared to F3 EVs which has similarly been observed in purified small EVs compared to non-vesicular components from cell lines [Citation24].
ADs and NCs were found to express similar compositions of RNA biotypes across all samples types except for lncRNA and tRNA species. Statistically significant tRNA halves were detected only in BDEs ()) and BH ()) in AD subjects compared to NC, one of which, tRNA11, had halves found in both BDEs and BH. The biogenesis of these tRNA halves are not understood, however may have roles such as being loaded on Ago proteins and acting through RNAi pathways [Citation27]. New revelations have demonstrated that certain tRNA synthases can be found enriched in syntenin-containing exosomes that are triggered during cellular stress conditions leading to inflammation [Citation28,Citation29]. This certainly brings a new insight into the potential role tRNA may be playing in BDEs during AD pathology. Statistically significant lncRNA was also detected between AD and NCs within BDEs, F3 EVs and BH; however, no lncRNA were found to be differentially expressed (DE) in more than one sample type (data not shown). The biological functions of these biotypes and individual species are yet to be defined and validated in EVs.
BDEs and F3 EVs exhibit distinct miRNA profiles
To examine whether BDEs and F3 EVs contained different miRNA species, further miRNA analysis was performed in these vesicle fractions and compared to BH. The total number of miRNA species detected in the entire dataset (inclusive of NC and AD) was 1446 miRNAs and the majority were found in BH (1263 miRNAs) followed by BDEs (1015 miRNAs) and F3 EVs (932 miRNAs) (, e)). The majority of miRNA species detected in BDEs and F3 EVs were also detected in BH at similar expression levels (), bottom of the heat map showing mostly brown = high expression and top of the heat map showing mostly white = low expression) while some miRNA displayed higher expression in BH compared to EV fractions or vice versa. Unsupervised clustering confirmed that BH samples overall had different features to both EV fractions ()). The majority of miRNAs were shared between both EV fractions and BH (748 miRNA species, ), Supplementary Table 1). Several miRNA species were found to be only detected in BDEs (84 miRNAs) and F3 EVs (61 miRNAs), with an additional 38 miRNAs detected in both BDEs and F3 EVs but not in BH ()). BH samples were found to express 285 miRNAs species which did not appear in EVs and exosomes. BDEs were found to best represent the frontal cortex with 145 miRNAs only present in BDEs and BH (), Supplementary Table 1).
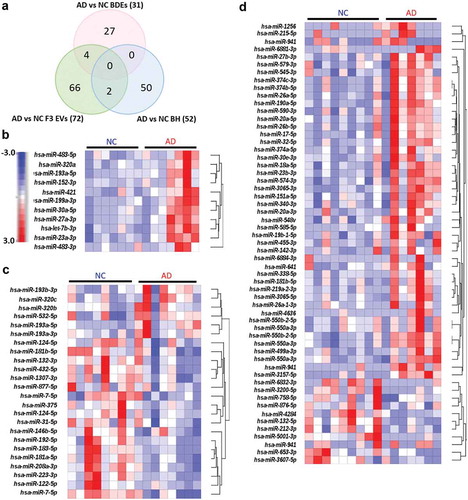
The second bioinformatics comparison in this study was to identify DE miRNA in AD subjects compared to NC and whether miRNAs associated with AD changed within BDEs, F3 EVs and BH (, bioinformatic comparison #2). Upon performing ANOVA analysis, statistically significant DE (Fold change ≤ −1.5 and ≥ 1.5, P ≤ 0.05) miRNAs found in AD post-mortem tissues compared to control tissues were observed in all sample types as shown in the volcano plots (BDEs, F3 EVs and BH, -g)). Upon comparing AD BDEs with NC BDEs, the volcano plot displayed more data points on the right ()) suggesting that there are more upregulated miRNAs compared to downregulated miRNAs in BDEs isolated from AD tissues compared to NC. Within the BH, there was also more upregulated miRNAs in AD subjects compared to downregulated miRNAs ()). In F3 EVs, there were more downregulated AD miRNAs compared to upregulated miRNAs ()), the opposite of BH. This may suggest that the material in F3 contains less disease associated miRNA in AD samples. Another possibility is that differential packaging of miRNA may occur between vesicle populations or the heterogeneity of F3 EVs has resulted in a dilution of miRNA copies. Nonetheless, the data suggest that the deregulation seen in enriched BDEs can mimic the expression profile of BH and potentially support the role of exosomes in RNA horizontal transfer during AD.
While there were several miRNAs that were DE in both BDEs and BH, those that were statistically significant were found not to be in common between these two sample types. This may be due to the low study number, however was limited due to the supply of the brain bank. The number of statistically significant DE miRNAs detected in ADs compared to controls were 27 DE miRNAs in BDEs, 66 DE miRNAs in F3 EVs and 50 DE miRNAs in BH (), Supplementary Table 2). None were found to be present in both BH and BDEs. The DE miRNAs were then filtered for abundancy (mean greater than 20 RPM) and unsupervised hierarchical clustering of highly expressed DE miRNAs between AD and control post-mortem tissues was performed for each sample type (BDEs, F3 EVs and BH, -d)). DE miRNAs that are abundantly expressed (after filtering for abundancy) in BDEs were all found to be upregulated in AD BDEs compared to controls ()) which was also the case for the majority of DE miRNA in the BH ()). DE miRNAs in both F3 EVs were found to contain miRNAs upregulated and downregulated in AD compared to controls ()). Having observed a different panel of DE miRNA between BDE, F3 EVs and BH, this raises an interesting question concerning the transfer of RNA between parental cells and EVs in the brain during disease pathology. We decided to further examine these patterns by performing global fold change comparisons between vesicles and BH during AD pathology.
Figure 3. Differentially expressed miRNA in BH, BDEs and F3 EVs.
Differential expression patterns of EV miRNA profiles within the AD brain
A correlation plot was produced which demonstrated that all biological replicates of each sample type displayed a high degree of consistency ()). BDEs and F3 EVs were found to express a higher correlation index (1 = high correlation, orange; 0.5 = lower correlation, yellow; and 0 = low correlation, white) and therefore display more similar miRNA profiles when compared to BH ()). F3 EVs of subject number six was found to display a significantly different profile. This may have been due to technical reasons during the collection of the F3 fraction given that the BDEs of subject six were similar to other BDE samples. Most importantly, the correlation plot demonstrates that BDEs and BH displayed the highest positive correlation across all samples ()) suggesting that F2 vesicles, defined as BDEs, contain a better representation of RNA species produced by parental cells (i.e. BH) compared to F3 EVs.
Figure 4. Dynamic expression changes within brain EVs compared to BH and peripheral blood EVs.
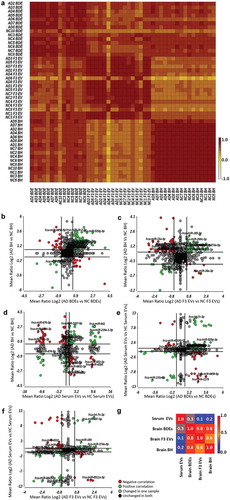
From here, ANOVA analysis (AD vs HC) was performed and expression fold changes (Mean Ratio Log2) for each miRNA were identified and this was performed for all sample types (BDEs, F3 EVs and BH). Expression fold changes of each miRNA were then plotted to observe the dynamic changes of DE AD miRNAs between sample types (, bioinformatic comparison #3). Firstly, the dynamic changes of AD associated miRNA in BDEs and BH were plotted in ). This allowed us to observe whether all miRNA expression changes in BH of AD brains correlated with those seen in the isolated BDEs of AD subjects. Green data points show miRNAs DE (AD vs HC) in the same direction within both sample types, either upregulated in both BDEs and BH or both downregulated (), Supplementary Table 3). Red data points show miRNAs in both sample types that are differently expressed (AD vs HC) but in the opposite direction, either downregulated in BDEs but upregulated in BH or vice versa (), red data points). The majority of miRNAs do not show expression changes in either sample type (black data points) and other miRNAs remain unchanged in one sample type but are differently expressed in the other sample type (grey data points).
While, there are some miRNAs that show opposite fold change between BH and their BDEs, the correlation graph provides an insight into various miRNAs that do show a correlation in fold change. miRNAs showing an upregulation in both AD BH and AD BDEs may be candidates that contribute in spreading pathology changes through gene dysregulation (a number of these miRNAs are labelled in the plots, ) and Supplementary Table 3). An upregulation of miRNA level is likely to cause an increase in post-transcriptional silencing of target mRNA compared to miRNAs that are downregulated. This demonstrates a level of selectivity of miRNAs in BDEs of AD subjects compared to control subjects and provides some thought-provoking possibilities regarding EV RNA transfer between recipient and parental cells during disease. Those that show opposite fold changes with BH and BDEs may suggest the miRNAs were not packaged in the BDEs or potentially used post-transcriptionally and degraded in cells. Expression changes between BH with F3 EVs were also plotted in ) which demonstrates another group of miRNAs that are detected in F3 EVs of AD subjects (), Supplementary Table 4). This analysis provides insights into the dynamics of EVs and their contents within in situ tissues which will provoke further studies into EV cargo biogenesis. The systematic analysis performed here has been limited to bulk NGS sequencing however, would be greatly improved once the field can apply the same methods to single-cell sequencing and single-EV sequencing. Mathys et al, elegantly performed single-cell transcriptomics on two longitudinal cohorts of post-mortem human brain samples which provided a detailed blueprint of mRNA changes within six major brain cell-types of AD brains [Citation2]. Combining single-cell and single-EV analysis, in addition to miRNA transcriptomics, could provide the ability to differentiate between neuron-derived sub-populations of EVs.
Differential expression patterns of EV miRNA profiles between the brain and peripheral blood in AD compared to controls
There remains debate in the field whether brain biomarkers can be detected in the periphery. To explore whether the DE miRNAs detected in AD brain tissues were the same as those DE in peripheral blood, miRNAs DE in BH isolated from post-mortem tissues were compared to miRNAs found to be DE in serum EVs isolated from a cohort of AD patients (), Supplementary Table 5). It is important to note that serum EVs were isolated from AD and HC participants from the AIBL cohort and are not the same patients as the post-mortem tissues provided by the Victorian Brain Bank. Peripheral serum EV miRNAs DE in AD patients were also compared to those DE in BDEs () and Supplementary Table 6) and F3 EVs () and Supplementary Table 7). Correlation coefficients demonstrated that BDEs and BH miRNA expression profiles were the most similar (0.8, )) in addition to BDEs and F3 EVs (0.8). However, brain samples (BH, BDEs and F3 EVs) showed little correlation to serum EV miRNA profiles (0.2). While, there is little correlation between brain and serum EVs, there are miRNAs DE in the brain that displayed the same fold change in serum EVs. The second quadrant in -e) (top right quadrant, green data points) displaying an upregulation in AD patients in both the brain sample types and serum EVs would make for an ideal liquid brain biopsy as they can be easily detected by targeted qRT-PCR due to their abundancy (full list of miRNAs in Supplementary Table 5 and 6, highlighted in red). Potentially, an improvement in correlation between brain EVs and serum EVs would be seen within a neuron-derived serum EV population immunocaptured by neuronal markers such as NCAM. Overall, the change of expression between sample types has provided insights into the dynamics of RNA transfer between the brain and periphery. It provides new research areas to explore as the field is yet to understand the transcytosis mechanism of EVs across the BBB and whether EV-miRNA can be transported from the brain to the periphery.
Enriched BDE and F3 EV miRNAs displaying functional transfer
Highly abundant EV miRNAs secreted from neurons and glia may influence post-translational changes upon the transfer to recipient neighbouring cells. This area is also highly debatable and yet to be explored in the literature until now due to the ability to isolate BDEs [Citation18]. Upregulated miRNA species were identified in BDEs and F3 EVs compared to BH (–d)), in both AD and NC samples (–d), not all labelled but are listed in Supplementary Tables 8–11). Comparing miRNAs upregulated in AD BDEs and AD F3 EVs with AD BH will provide an insight into functional transfer during AD pathology and progression within the AD brain. The upregulated miRNA found in AD BDEs can be compared to those identified in NC BDEs to provide an insight into physiological and pathological differences.
Figure 5. Enriched BDE and F3 EV miRNAs in AD subjects show differential biological functions compared to controls.
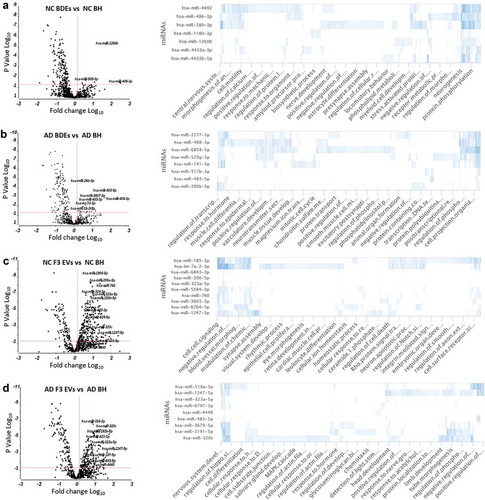
Under “normal” conditions, in cases with no AD diagnosis, NC BDEs contained eight statistically significant enriched miRNAs compared to NC BH ()). There were 26 miRNAs highly enriched at greater than 1.5-fold more in AD BDEs compared to AD BH and in most cases greater than 3- and 10-fold greater in AD BDEs ()). One miRNA, hsa-miR-486-3p, was found enriched in both AD and NC BDEs suggesting this miRNA may be regularly packaged into BDEs during disease or physiological states. GO analysis revealed that hsa-miR-486-3p targets genes involved in nervous system development, central nervous system and cell motility which are highly relevant in the brain. To investigate whether enriched BDE miRNAs may be involved downstream and change biological outcomes in AD brains from healthy conditions, GO analysis was performed on the top 10 most enriched miRNAs in each comparison between BDEs and BH. NC BDEs were enriched with miRNAs associated with regulatory pathways known to maintain differentiation and fundamental signalling pathways in the brain such as astrocyte differentiation, nerve development, neurogenesis, amyloid processing and presynaptic processing ()) however, these essential biological functions are not targeted by the miRNAs found enriched in AD BDEs ()) and is potentially lost during AD, leading to neuronal death and neurodegeneration.
The same analysis was also performed on F3 EVs in both AD and NC subjects (,d)). There was a larger amount of enriched EV miRNAs in F3 EV samples in both AD and control tissues. Enriched miRNAs found in NC F3 EVs were found to target secondary regulatory pathways potentially involved in dynamic signalling pathways such as apoptosis, ion homoeostasis, cell-cell signalling and cell receptor surface signalling. Interestingly, NC F3 EV miRNAs were found to target genes specifically targeted to other organs such as retina development, cardiac muscle differentiation and blood vessel morphology, which may suggest these smaller EVs are able to travel to distant sites in the body ()). In AD, F3 EV miRNAs are found to target CNS related functions. Identifying a change of miRNA profile in F3 EVs may highlight neurode generalized dysfunction in this EV subtype ()). Significantly enriched miRNAs found in higher concentrations in EVs, compared to BH, may have biologically relevant roles specific for EV function.
Discussion
In the CNS, neurons, astrocytes, glia and vascular cells communicate with each other by exchanging signalling molecules and exosomes have been shown to play an important role in neuron-glia communication to ensure synaptic plasticity. miRNAs are highly enriched in the brain [Citation7] and contribute to the fine tuning of gene regulation during development. During neurodegenerative disease, the expression of various miRNAs is dysregulated leading to changes in gene expression and neuronal function. Exosomes carrying pathogenic cargo including dysregulated levels of miRNA may be taken up by neighbouring and distant cells within the brain to further exacerbate disease pathology. However, few studies have interrogated the dynamic changes in miRNA expression within EVs secreted from brain tissues in neurodegenerative diseases. In this study, we comprehensively profiled the repertoire of miRNAs in EVs isolated from post-mortem brain tissue from AD subjects and compared their profiles to BH which provided a picture of potentially transferred “pathogenic” RNA.
The study also uncovered insights into the dynamic expression patterns of miRNA between the brain and blood. The results suggested there is low correlation between the expression of miRNA in the brain during disease that is represented in the periphery. This observation is likely due to the dilution of other organ-derived miRNAs circulating in the periphery, highlighting the need to enrich for brain-derived vesicles in the periphery to improve the detection of AD associated blood-based miRNA biomarkers. Further investigations would involve determining whether the miRNA changes in BDEs detected in this study are specific towards AD or potentially a generaliszd signature of neurodegeneration. This would involve isolating BDEs from other neurodegenerative related diseases such as Parkinson’s disease and to differentiate specific disease signatures from generalised signatures related to neuronal degradation. Nonetheless, a number of miRNAs were found in this study that were deregulated in both the brain and blood which would be ideal candidates to validate as blood-based biomarkers considering their abundancy. Previously, we identified 16 significantly altered miRNA species in total circulating EVs isolated from serum collected from clinical AD patients compared to HC resulting in an accuracy of 82% for predicting clinical AD [Citation19]. Upon correlating our initial discovery study using serum EVs, we identified that two of our serum EV miRNAs are also highly abundant and deregulated greater than 2× fold in AD BDEs, although not statistically significant in the current study. Further work in correlating the serum EV markers with the brain requires greater numbers of post-mortem tissues which is a limiting factor due to access of these tissues. Ultimately, a blood-based assay requires the ability to detect the biological indicator above noise so long as it provides improved accuracy compared to current diagnostic methods.
Several studies have demonstrated the ability of EVs crossing the BBB and being detected in peripheral blood. Of note, tumour-cell secreted EVs carrying human genomic DNA sequences, within an orthotopic xenotransplant model of human cancer stem cells, were found to cross uncompromised BBBs and were detected in the bloodstream [Citation30]. The group further validated their model by successfully detecting the IDH1G395A mutation, associated with low- and high-grade gliomas, in peripheral blood, thus providing the potential to diagnose patients using conventional qRT-PCR and avoiding invasive biopsies to obtain solid tissues. The low correlation seen between brain and peripheral EVs should encourage development of a superior method that may involve enrichment of specific cell-derived exosomes. Indeed, neuron-derived and astrocyte-derived EVs, immunoprecipitated by anti-L1 CAM and anti-GLAST antibodies, respectively, have been shown to be enriched with AD biomarkers such as P-T181-tau, P-S396-tau, beta-site amyloid, BACE-1, GDNF, SNAP-25 and Abeta1-42 [Citation31–Citation34]. With further development, this method could also be applied to detect miRNA.
Upon comparing DE miRNAs in AD subjects compared to controls, many miRNAs found in both the brain and serum displayed an inverse correlation, i.e. upregulated in the brain but downregulated in the serum or vice versa. Communication between the brain and periphery is critical and requires careful control of biomolecules across the BBB. Consequently, it has been suggested that EVs could serve as a mechanism to traffic molecules and ions across the BBB. The biogenesis of EVs across endothelial cells is a relatively unexplored area and it is unknown whether the change in expression of miRNA between the brain and serum could be due to off-loading miRNA cargo for endothelial regulation or removal from the periphery. Further work to investigate this revelation will require sophisticated in vitro work using labelled EVs and RNA cargo to observe transcytosis of EVs across endothelial cells and/or transfer of RNA cargo to endothelial cells. Future studies may unravel how EV cargo changes through membrane barriers of the brain and various organs in the periphery before circulating in the bloodstream.
Overall, as this study is the first to provide a comprehensive insight into RNA content of BDEs, the data obtained from this study highlights three different elements that will contribute to both the EV and AD field: (1) Enriched BDEs have differential RNA biotypes compared to a heterogeneous population of EVs and provide a better representation of the total brain. (2) Differential expression patterns of AD associated miRNA in BDEs, F3 EVs and BH provide an insight into the biological pathways potentially affected during disease that is assisted by RNA horizontal transfer; and (3) there is little correlation between the miRNAs found deregulated in the brain and blood of AD subjects compared to controls. Building on our work, future research should endeavour to understand the role of BDE miRNAs in the early stages of AD and developing methods to detect these changes in the periphery.
Authors contributions
LC, LJV, KB and AFH designed the study. CM performed the post-mortem collection, determined diagnosis and provided the tissues. CLM approved and provided the serum samples. LJV processed the post-mortem tissues and EVs, characterized the post-mortem EVs, extracted the brain RNA and provided the associated figures. LC processed the serum EVs and constructed all the small RNA libraries in the study. LC performed all the bioinformatics analysis and constructed all the bioinformatic related figures. LC interpreted the datasets and constructed the manuscript. LC and AFH supervised the study. LJV, AFH and CLM provided critical revision of the manuscript.
Supplemental Material
Download Zip (982.3 KB)Acknowledgments
We wish to thank the Victorian Brain Bank and Australian Imaging, Biomarkers and Lifestyle Study of Ageing, in particular, the families for providing serum and post-mortem tissue samples for this study. We would like to acknowledge Fairlie Hinton and Geoff Pavey from the Victorian Brain Bank for their assistance in gaining access to the post-mortem tissues. We would like to acknowledge Christopher Flower and Alan Rembach for organizing the serum samples from the Australian Imaging, Biomarkers and Lifestyle Study of Ageing. We would also like to acknowledge Mitch Shambrook and Benjamin J. Scicluna for helpful discussions, tissue processing and assistance during the development of the protocol to isolate BDEs. We wish to thank Associate Professor Eric Hanssen and Dr Sergey Rubanov for assistance with the electron microscopy, which was performed at the Bio21 Advanced Microscopy Facility, The University of Melbourne. We thank Keyla Perez who isolated and performed RNA QC on the brain tissues.
Disclosure statement
No potential conflict of interest was reported by the authors.
Supplementary material
Supplemental data for this article can be accessed here.
Correction Statement
This article has been republished with minor changes. These changes do not impact the academic content of the article.
Additional information
Funding
References
- Alafuzoff I, Arzberger T, Al-Sarraj S, et al. Staging of neurofibrillary pathology in Alzheimer’s disease: a study of the BrainNet Europe consortium. Brain Pathol. 2008;18(4):484–15.
- Mathys H, Davila-Velderrain J, Peng Z, et al. Single-cell transcriptomic analysis of Alzheimer’s disease. Nature. 2019. DOI:10.1038/s41586-019-1195-2.
- Raj T, Li YI, Wong G, et al. Integrative transcriptome analyses of the aging brain implicate altered splicing in Alzheimer’s disease susceptibility. Nat Genet. 2018;50(11):1584–1592.
- Martiskainen H, Viswanathan J, Nykanen NP, et al. Transcriptomics and mechanistic elucidation of Alzheimer’s disease risk genes in the brain and in vitro models. Neurobiol Aging. 2015;36(2):1221.e15-28.
- Babak T, Zhang W, Morris Q, et al. Probing microRNAs with microarrays: tissue specificity and functional inference. RNA. 2004;10(11):1813–1819.
- Lukiw WJ. Micro-RNA speciation in fetal, adult and Alzheimer’s disease hippocampus. Neuroreport. 2007;18(3):297–300.
- Cogswell JP, Ward J, Taylor IA, et al. Identification of miRNA changes in Alzheimer’s disease brain and CSF yields putative biomarkers and insights into disease pathways. J Alzheimers Dis. 2008;14(1):27–41.
- Muller M, Kuiperij HB, Claassen JA, et al. MicroRNAs in Alzheimer’s disease: differential expression in hippocampus and cell-free cerebrospinal fluid. Neurobiol Aging. 2014;35(1):152–158.
- Rajendran L, Honsho M, Zahn TR, et al. Alzheimer’s disease beta-amyloid peptides are released in association with exosomes. Proc Natl Acad Sci U S A. 2006;103(30):11172–11177.
- Sharples RA, Vella LJ, Nisbet RM, et al. Inhibition of gamma-secretase causes increased secretion of amyloid precursor protein C-terminal fragments in association with exosomes. Faseb J. 2008;22(5):1469–1478.
- Polanco JC, Li C, Durisic N, et al. Exosomes taken up by neurons hijack the endosomal pathway to spread to interconnected neurons. Acta Neuropathol Commun. 2018;6(1):10.
- Wang Y, Balaji V, Kaniyappan S, et al. The release and trans-synaptic transmission of Tau via exosomes. Mol Neurodegener. 2017;12(1):5.
- Vella LJ, Sharples RA, Lawson VA, et al. Packaging of prions into exosomes is associated with a novel pathway of PrP processing. J Pathol. 2007;211(5):582–590.
- Fevrier B, Vilette D, Archer F, et al. Cells release prions in association with exosomes. Proc Natl Acad Sci U S A. 2004;101(26):9683–9688.
- Lotvall J, Hill AF, Hochberg F, et al. Minimal experimental requirements for definition of extracellular vesicles and their functions: a position statement from the international society for extracellular vesicles. J Extracell Vesicles. 2014;3(1):26913.
- Thery C, Witwer KW, Aikawa E, et al. Minimal information for studies of extracellular vesicles 2018 (MISEV2018): a position statement of the international society for extracellular vesicles and update of the MISEV2014 guidelines. J Extracell Vesicles. 2018;7(1):1535750.
- Kapogiannis D, Boxer A, Schwartz JB, et al. Dysfunctionally phosphorylated type 1 insulin receptor substrate in neural-derived blood exosomes of preclinical Alzheimer’s disease. Faseb J. 2015;29(2):589–596.
- Vella LJ, Scicluna BJ, Cheng L, et al. A rigorous method to enrich for exosomes from brain tissue. J Extracell Vesicles. 2017;6(1):1348885.
- Cheng L, Doecke JD, Sharples RA, et al. Prognostic serum miRNA biomarkers associated with Alzheimer’s disease shows concordance with neuropsychological and neuroimaging assessment. Mol Psychiatry. 2015;20(10):1188–1196.
- McKhann G, Drachman D, Folstein M, et al. Clinical diagnosis of Alzheimer’s disease: report of the NINCDS-ADRDA Work Group under the auspices of Department of Health and Human Services Task Force on Alzheimer’s Disease. Neurology. 1984;34(7):939–944.
- Ellis KA, Bush AI, Darby D, et al. The Australian Imaging, Biomarkers and Lifestyle (AIBL) study of aging: methodology and baseline characteristics of 1112 individuals recruited for a longitudinal study of Alzheimer’s disease. Int psychogeriatrics/IPA. 2009;21(4):672–687.
- Kehl T, Kern F, Backes C, et al. miRPathDB 2.0: a novel release of the miRNA pathway dictionary database. Nucleic Acids Res. 2019;48(D1):D142–D7.
- Karimi N, Cvjetkovic A, Jang SC, et al. Detailed analysis of the plasma extracellular vesicle proteome after separation from lipoproteins. Cell Mol Life Sci. 2018;75(15):2873–2886.
- Jeppesen DK, Fenix AM, Franklin JL, et al. Reassessment of exosome composition. Cell. 2019;177(2):428–45.e18.
- Lunavat TR, Cheng L, Kim DK, et al. Small RNA deep sequencing discriminates subsets of extracellular vesicles released by melanoma cells–Evidence of unique microRNA cargos. RNA Biol. 2015;12(8):810–823.
- Quek C, Bellingham SA, Jung CH, et al. Defining the purity of exosomes required for diagnostic profiling of small RNA suitable for biomarker discovery. RNA Biol. 2017;14(2):245–258.
- Kumar P, Anaya J, Mudunuri SB, et al. Meta-analysis of tRNA derived RNA fragments reveals that they are evolutionarily conserved and associate with AGO proteins to recognize specific RNA targets. BMC Biol. 2014;12:78.
- Kim SB, Cho S, Kim S. Exosomal secretion of truncated cytosolic lysyl-tRNA synthetase induces inflammation during cell starvation. Cell Stress. 2018;2(5):119–121.
- Kim SB, Kim HR, Park MC, et al. Caspase-8 controls the secretion of inflammatory lysyl-tRNA synthetase in exosomes from cancer cells. J Cell Biol. 2017;216(7):2201–2216.
- Garcia-Romero N, Carrion-Navarro J, Esteban-Rubio S, et al. DNA sequences within glioma-derived extracellular vesicles can cross the intact blood-brain barrier and be detected in peripheral blood of patients. Oncotarget. 2017;8(1):1416–1428.
- Fiandaca MS, Kapogiannis D, Mapstone M, et al. Identification of preclinical Alzheimer’s disease by a profile of pathogenic proteins in neurally derived blood exosomes: A case-control study. Alzheimer’s Dementia. 2015;11(6):600–7.e1.
- Goetzl EJ, Mustapic M, Kapogiannis D, et al. Cargo proteins of plasma astrocyte-derived exosomes in Alzheimer’s disease. Faseb J. 2016;30(11):3853–3859.
- Mustapic M, Eitan E, Werner JK Jr., et al. Plasma extracellular vesicles enriched for neuronal origin: a potential window into brain pathologic processes. Front Neurosci. 2017;11:278.
- Agliardi C, Guerini FR, Zanzottera M, et al. SNAP-25 in serum is carried by exosomes of neuronal origin and is a potential biomarker of Alzheimer’s disease. Mol Neurobiol. 2019;56(8):5792–5798.