
ABSTRACT
Circulating extracellular vesicles (EVs) were recognized as a promising source of diagnostic biomarker. However, there are limited studies published in this area, partly due to the limited number of detection platforms capable of detecting extracellular vesicles. In this study, extracellular vesicle immunoassays were developed using the Single Molecule array technology (SiMoa) and their clinical applications to cancer diagnosis were evaluated. Two extracellular vesicle detection assays, CD9-CD63 and Epcam-CD63, were designed to detect universal extracellular vesicles and tumour-derived extracellular vesicles, respectively. Our results show that CD9-CD63 and Epcam-CD63 SiMoa assays specifically detect extracellular vesicles but not free proteins with high sensitivities. The Epcam-CD63 levels detected in cancer cell culture media were consistent with levels of Epcam-expressing EVs isolated from the same cancer cell lines and detected by Western blot. Furthermore, the assays distinguish cancerous from non-cancerous plasma samples. The highest CD9-CD63 and Epcam-CD63 signals were observed in colorectal cancer patients comparing to healthy and benign controls. Both assays showed superior diagnostic performance for colorectal cancer. In addition, our results show that CD9-CD63 detection is an independent prognosis factor for both progression free survival and overall survival, while Epcam-CD63 detectionis an independent prognosis factor for OS.
Introduction
Extracellularvesicles (EVs), continuously secreted from normal and diseased cells into various bodily fluids, represent a heterogeneous mixture of differently sized vesicles [Citation1]. Two major classes of EVs, defined by their intracellular origin or biogenesis, are exosomes and microvesicles (MVs) [Citation2]. Exosomes, as described in various studies, are small EVs (30–100 nm) that derived from multivesicular body (MVB) [Citation3]. MVs, also known as ectosomes, are intermediate-sized EVs that buddirectly from the cellular membrane into vesicles ranging from 100 to 1,000 nm in diameter.
EVs carry several membrane-bound and intravesicular molecules that represent their cellular origins. The tetraspanin family of proteins, such as CD63, CD9 and CD81, are mainly used as EV/exosome markers [Citation4–Citation6]. A plethora of tumour surface markers, such as epithelial cell adhesion molecule (Epcam), epidermal growth factor receptor (EGFR) [Citation7] and CA125, are also expressed and analysed on tumour-derived EVs (T-EVs) [Citation8]. Use of these biomarkers to track EVs/T-EVs in bodily fluids has recently garnered much interest as a non-invasive liquid biopsy for cancer.Although this potential applicationis promising, the identification and quantification of EVs in clinical samples remains challenging. Currently, the most common method for purifying EVs involves a series of high-speed ultracentrifugation steps, which is very timeconsuming and is not applicable to a large number of clinical samples [Citation9].
The Single Molecule array (SiMoa) platform is a new ultrasensitive immunoassay technology that allows for the measurement of proteins via ELISA immunoassays using a fully automated instrument [Citation10,Citation11]. The fundamental theory of SiMoawas published by Chang and co-workers in 2012 [Citation12]. By utilizing SiMoa, protein biomarkers with very low expression levels could be detected in cancer prognostic studies after treatment, allowing prediction of disease outcomes [Citation11,Citation13].
In this study, for the first time by using SiMoa technology, we have developed two sensitive EV detection assays targeting EV markers, allowing for the profiling of EVs or T-EVs directly from cancer cell culture supernatants or plasma from cancer patients. Furthermore, we studied their clinical utility in colorectal cancer (CRC) diagnosis and prognosis.
Materials and methods
Study design
The objective of current research is to take the advantage of high sensitivity of SIMOA technology, and to detect extracellular vesicles without purification in plasma of cancer, especially in colorectal cancer patients. Two SIMOA assays were developed with two pairs of antibodies. The CD9-CD63 pair aims to capture CD9 positive EVs in plasma via micro-beads and detected by anti-CD63 as the 2nd antibody, the Epcam-CD63 pair use anti-Epcam to capture Epcam positive EVs and detect via anti-CD63. Due to the expression specificity of these proteins, CD9-CD63 pair assay is detecting general EVs, Epcam-CD63 pair assay is detecting Epcam positive EVs expressed from Epcam positive cells such as colorectal cancer.
The 2 assays were validated via a commercial EV standard isolated from HCT116, a colon cancer cell line. High sensitivity were achieved with a serial diluted standard curve. Assay specificities were proved by comparing sonicated and non-sonicated standard. The Epcam-CD63 assay was also validated by comparing results of western blot and SIMOA.
Plasma samples from 20 non-cancer were compared with 14 nasopharynx cancer, 20 breast cancer, 20 renal cell carcinoma and 5 lung cancer patients. Higher value was found in all of the cancer types in both assays. Then, 163 colorectal cancer patients were compared with 46 healthy control and 51 adenoma patients. Higher value for both assays were found associated with cancer and prognosis.
EVs detection assay prototyping
Antibodies against EV biomarkers CD63, CD9 and Epcam were selected and prepared for capture and detectionfollowingthe manufacturer’s recommendations. By using commercialEV standards from the HCT116 cell line (HBM-HCT-30/5, Hansabiomed), different antibody combinations were compared and those with the best signals were selected. The antibodies used in the assayswere CD9 MA1-19,002 (ThermoFisher), CD63 ab59479 (Abcam) and Epcam MAB9601 (R&D Systems).
The preparation of SiMoa homebrew kits for EV detection followed the manufacturer’s guideline. In brief, the capture antibody concentration was adjusted to 0.2 mg/mL with Bead Conjugation Buffer (Quanterix) andparamagnetic carboxylated microparticles (Quanterix) were activated with 0.3 mg/mL 1-ethyl-3- (3-dimethylaminopropyl) carbodiimide hydrochloride (EDC) (Thermo Fisher Scientific, Waltham, MA, USA). To start the biotinylation reaction, 3 μL of the biotin solution (2 mg NHS-PEG4-Biotin dissolved in 383 μL ddH2O) were added to 100 μL of the detection antibody solution (1.0 mg/mL). The concentration of the recovered antibody was adjusted to 0.2 mg/mL and beads were stored at 4°C.
Finally, two different EVs detection assays were developed: the first assay detecting universal EVs via CD9-CD63 and the second assay detecting tumour-derived EVs via Epcam-CD63.
SiMoa running setup
All SiMoa measurements were performed on a fully automated SiMoa HD-1 Analyser (Quanterix). The microscopic beads coated with either the CD9 or Epcam capture antibody were diluted in DiluentBuffer to 500,000 per test. The CD63 detection antibody was diluted in DiluentBuffer to a working concentration of 0.3 μg/mL. Streptavidin-β-galactosidase (SBG) concentrate was diluted in SBG Diluent (Quanterix) to a working concentration of 150 pM. Resorufin β-D-galactopyranoside(RGP) substrate, provided by Quanterix, was used. The assay configuration protocol was a three-step assay. Briefly, 25 μL of the microscopic beads solution and 100 μL of sample(25 μl plasma + 75 μl Homebrew Buffer)were incubated for 45 min in a reaction cuvettein the first step (Quanterix), followed by several wash steps. Then,100μL of detection antibody was added to the microscopic beads and incubated for 5 min and 15 s in the second step. Finally,100 μL of SBG was added and incubated for 5 min and 15 s in the third step. RGP substrate solution (20 μL) was added to the microscopic beads, mixed and loaded onto the SiMoa disc array. The array was then sealed with oil and the microscopic beads were imaged. Automated analysis was done by the HD-1 Analyser software (Quanterix); SiMoa signal is expressed in AEBas previous described [Citation14]. In short, AEB is determined by counting the number of wells containing both a bead and fluorescent signal (“on” well) relative to the total number of wells containing beads, using Poisson statistics and the digital or analogue methods based on high or low concentrations of captured analyte.
Cell line culture and plasma samples
Four cell lines (Glioblastoma U87, Lung Cancer A549, Pancreatic Cancer MIA PaCa-2 and Colorectal Cancer HT-29) were kindly provided by the Shanghai Institute of Biochemistry and Cell Biology and Fudan University Cancer Institute; each was cultured using a standard protocol in Fudan University Shanghai Cancer Centre – InstitutMerieux Laboratory. Cells were cultured in DMEM (L120KJ, YuanPei biotech) with 10% FBS (SH30084.03, HyClone) until 80% culture confluence, and then washed twice with DMEM. After 36 h of culturing in DMEM, the culture media were collected for direct testing or EV purification.
Clinical samples from colorectal cancers (CRC) (n = 163), adenomas (n = 51) and other cancers, including nasopharyngeal (n = 14), breast (n = 20), renal cell (n = 20) and lung cancers (n = 5), were EDTA plasma samples from the tissue bank of Fudan University Shanghai Cancer Centre (FUSCC). Control samples were EDTA plasma from cancer-free patients that were collected from the Medical Centre of FUSCC. The study was approved by the Institutional Review Board and the Ethics Committee of FUSCC (ID: 050432-4-1911D). The collection of samples followed the standard operation procedure of the FUSCC biobank. Plasma was isolated via centrifugation at 1,000 × g within 1 h of blood collection. Thereafter, the plasma samples were stored at −80°C. Thawed samples were centrifuged for 10 min at 3000 × g before use.
EV purification
This studyused a differential ultracentrifugation method for EV purification as described previously [Citation15,Citation16]. In brief, after collecting the cell culture media, low speed centrifugation (300 × g for 10 min) was used to remove dead cells. Cell debris was removed by another centrifugation step at 2000 × g for 20 min. Another centrifugation step at 10,000 × g for 40 min was applied to remove large microvesicles. EVs were then collected after a final ultracentrifugation step at 100,000 × g for 2 h (Type 70 Ti Fixed-angle Titanium Rotor, k factor = 157.4) (Optima™ XP ultracentrifuge; Beckman Coulter, Indianapolis, IN). Pellets were washed once with PBS using the same speed and time. The EV concentration was calculated on a Flow NanoAnalyzer (NanoFCM Inc., Xiamen, China) according to the manufacturer’s instructions.
Ultrasonic treatment of EVstandard
In order to disrupt the EV structure and release its proteins, a commercial EVstandard solution (Hansabiomed, HCT-116) was sonicated at 20 kHz. Three sonication conditions were tested, as referenced in a protein extraction procedure described previously [Citation17]: no sonication, 3 min of sonication and 10 min of sonication, comprising sonication cycles of 10 s on and 10 s off, until the end of the sonication time was reached.
Western blot
EVs were purified from approximately 50 mL of cell culture medium collected from U87, A549, MIA PaCa-2 and HT-29 cell lines via differential ultracentrifugation, followed by lysis in a lysis buffer as previously described [Citation18]. Protein lysates were separated by 10% sodium lauryl sulphate polyacrylamide (SDS-PAGE) gel, and then transferred onto apolyvinylidene difluoride (PVDF) membrane (Sigma-Aldrich). The membranes were blocked andincubated at 4°C overnight with either an anti-EpcamAb (R&D systems, MAB960) or an anti-tsg101 Ab (Abcam, ab1337586), as tsg101 is reported to be widely expressed in EVs and could be used for normalization [Citation19,Citation20]. After being incubated with a secondary antibody (anti-mouse IgG (HAF007, R&D systems) for anti-Epcam, anti-rabbit IgG (ab205718, Abcam) for anti-tsg101) for 1 h at room temperature, the signals were visualized using the LI-COR Image Studio lite imaging system. The relative Epcam levels in EVs from different cell lines were normalized to the expression of tsg-101.
SiMoa assays validation
A commercial EV standard isolated from the HCT116 cell line was prepared by serial dilution and used as a calibrator for the validation of our two SiMoa EV detection assays (Epcam-CD63, CD9-CD63). An aliquot of the neat EV standard was detected by a Flow NanoAnalyzer (NanoFCM Inc., Xiamen, China) to recalculate the initial concentration. Serial dilutions of the standard (7 dilutions with Quanterix homebrew buffer, fivefold dilutions for each point) produced 7 calibration points that were tested with the 2 SiMoa assays. The measurement for each dilution point was repeated 3 times (including a blank of the homebrew Quanterix buffer) in order to calculate the limit of detection (LoD). For each assay, the LoD was calculated as three times the standard deviation.
Statistical analysis
Calibration curves for the 2 SiMoa assays developed were fit using a 1/Y2 weighted 4-parameter logistics model. Passing-Bablok regression was used to study the linear relationship between CD9-CD63 and Epcam-CD63 to make regression analysis robust against potential outlier. The optimal cut-off points for discriminating between cancer and cancer-free patients using the Epcam-CD63 assay and the CD9-CD63 assay were estimated using the Youden index method with the R package OptimalCutpoints (version 1.1.3) [Citation21]. Both univariate and multivariate Cox regression analyses were used to analyse the risk factors in the study cohort for both overall survival (OS) and progression free survival (PFS). Hazard proportionality was diagnosed using a method based on scaled Schoenfeld residuals [Citation22]. Significant prognostic factors in the multivariate Cox model were selected using a stepwise variable selection method. In the case of monotone likelihood (non-convergence of the likelihood function) for rare or no events in patient groups with a certain risk factor level, Firth’s penalized maximum likelihood bias reduction method [Citation23] implemented in the R package coxphf (version 1.13) [Citation24] was employed to fit the Cox model. Survival curves were calculated by the Kaplan–Meier method using the dichotomized Epcam-CD63 or CD9-CD63 as grouping factors and compared using the log-rank test. All statistical analyses were performed using R for Windows (version 3.4.0, URL https://www.R-project.org) [Citation25].
Results
Development of SiMoa prototypes to detect EVs in plasma
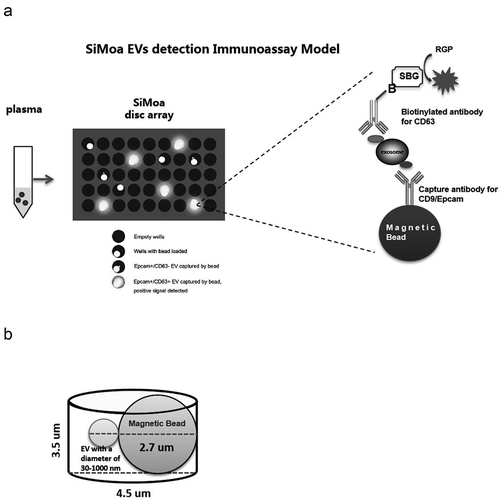
SiMoa technology makes use of arrays consisting of femtoliter-sized reaction chambers, which allow for detection of even single enzyme molecules. In recent years, this approach has been widely used for ultrasensitive detection of various protein biomarkers [Citation10,Citation11]. The objective of this study was to develop a SiMoa immunoassay prototype to detect EVs directly in plasma without utilization of a heavy purification method()). Plasma samples are incubated with magnetic beads coated with capture CD9 or Epcam antibodies. The bead-EV complexes are incubated sequentially with the biotinylated detector CD63 antibody, SBG and loaded to the SiMoa disc array thereafter. The catalytic reaction of SBG with RGP is restricted in the micro-well. The instrument detects an increasing fluorescent signal if a bead-EV-detector-SBG complex is loaded to the well.In the SiMoa design, 2-mm-wide disc arrays used in the signal collection step had ~50,000 wells with diameters of 4.5 μm and depths of 3.25 μm.Considering the diameter of the microscopic beads (2.7 μm), the SiMoa micro-wells are capable of containing one bead complex together with EVs, i.e. exosomes (30–100 nm) and MVs (100–1000 nm) ()). Two different EV detection assays, CD9-CD63 and Epcam-CD63, weredeveloped for targeting universal EVs and tumour-derived EVs, respectively, using the SiMoa homebrew kit (Quanterix).
Figure 1. SiMoa EVs detection immunoassay model.
Validation of the SiMoa EV detection assays
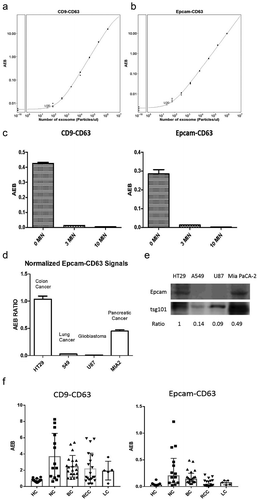
A commercial EV standard (HBM-HCT-30/5, Hansabiomed) was isolated from the HCT116 cell line, a colorectal cancer cell line with high Epcamexpression, using an ultracentrifuge method and diluted for use as a calibrator for the validation of our two SiMoa EV detection assays. A standard curve was generated from a serial dilution of the EV standard using the two assays. The limit of detection (LoD) of the CD9-CD63 assay was calculated at 34 particles/μL ()) and the LoD of the Epcam-CD63 assay was 25 particles/μL ()). Furthermore, the commercial EV standard was also ultrasonically treated and tested again withour SiMoa assays to confirm that they detect specifically whole EVs, but not free-proteins. ) shows that signals obtained with both assays were dramatically decreased after 3 min and 10 min of ultrasonic treatment. After 10 min of sonication, the signals obtained from both assays were at the background level (AEB<0.005), confirming those assays cannot detect free-proteins. In addition, when using CoIP lysis buffer to disrupt the EVs structures,asimilar result was observed (Supplementary Figure 1). These results confirm that our SiMoa EVs detection assays are sensitive and specific for EVs.
Figure 2. Validation of the SiMoa EV detection assays.
Detection of tumour-derived EVs via the Epcam-CD63 assay
In this study, we developed an Epcam-CD63 SiMoa assay to track tumour-derived EVs in the blood. As the expression levels of Epcam in various tumour types are different [Citation26], we decided to test culture media from different cancer cell lines with our Epcam-CD63 assay. Signals obtained with the Epcam-CD63 assay were normalized using signals obtained with the universal EV detection assay CD9-CD63. Ratios were calculated between the mean signals obtained with Epcam-CD63 and CD9-CD63.
As shown in ), the highest ratio was obtained with the HT29 cell line, a well-known Epcam-expressing colorectal cancer cell line. There was also good expression in the pancreatic cancer cell line Mia PaCa-2, whereas very low expression was found in the lung cancer cell line A549 and the glioblastoma cell line U87. These results were consistent with the Epcam expression levels obtained from WB with isolated EVs from the same cell lines ()), indicating the signals detected by SiMoa Epcam-CD63 assay reflected the amount of tumour-derived EVs directly released from tumour cells.
Furthermore, we used our SiMoa assays to test several plasma samples from healthy (non-cancer) individuals (HC, n = 20) and cancer patients, including nasopharynx cancer (NC, n = 14), breast cancer (BC, n = 20), renal cell carcinoma (RCC, n = 20) and lung cancer (LC, n = 5) patients. Interestingly, most cancer patients had higher universal EV (CD9-CD63) and T-EV (Epcam-CD63) signals than non-cancer patients ()). These results corroborated ourinterestinmeasuring EVs with the SiMoa assays in cancer patients.
EVs/T-EVs as potential CRC diagnostic biomarkers
Plasma samples from 163 CRC patients were tested with the SiMoa EV assays and compared with 46 healthy control (HC) and 51 adenoma (AD) plasma samples, which were benign tumours of glandular tissue mostly from the colon. Sample information for all the samples is listed in . Signals obtained with both the CD9-CD63 ()) and Epcam-CD63 ()) assays from CRC sampleswere significantly higher than signalsobtained for healthy controls and also significantly higher than signals from adenomas (p-val<2.2e-16 for both CD9-CD63 and Epcam-Cd63 for CRC vs Healthy; p-val = 4.9e-6 for CD9-Cd63, p-val = 0.022 for Epcam-CD63 for CRC vs adenoma). In addition, Passing-Bablok regression results showed that there is significant linear relationship between CD9-CD63 and Epcam-CD63 (slope and intercept are 18.752 and −0.015, corresponding 95% CI are 16.740 to 20.791 and −0.224 to 0.227). This linear relationship remains similar in adenoma, CRC patients and healthy subjects ().
Table 1. Sample information.
Figure 3. Diagnostic values for the EV detection assays in CRC samples.
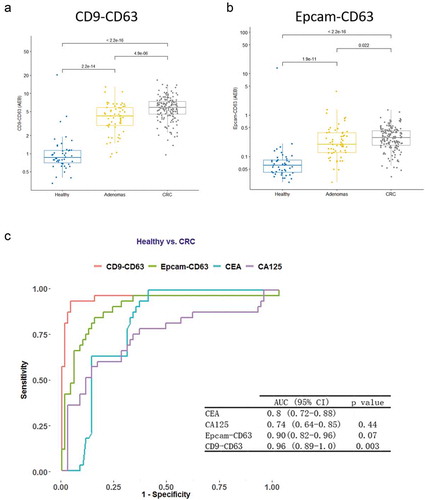
ROC curves were calculated to evaluate the diagnostic performance of the EV detection assays. The CD9-CD63 and Epcam-CD63 assays showed better diagnostic performance (AUC = 0.96 and 0.90, respectively) than the traditional biomarkers CEA and CA125 (0.8 and 0.74, respectively, in this cohort, CEA and CA125 data extracted from the patients’ clinical information) ()). The CD9-CD63 assay showed the best performance with an AUC = 0.96. Our results suggest that both the CD9-CD63 and the Epcam-CD63 EV detection assays have potential as diagnostic biomarkers for CRC, showing better performance than current biomarkers.
EVs/T-EVs as CRC prognostic biomarkers
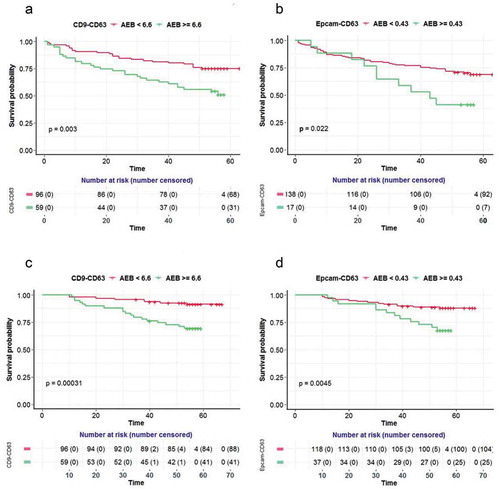
The prognostic value of the CD9-CD63 and Epcam-CD63 EV markers was analysed using a Cox proportional hazard regression model. The hazard ratio for each clinical factor and/or covariate was assessed by univariate Cox modelling. Both CD9-CD63 (PFS: p val = 0.04, OS: p val = 0.003) and Epcam-CD63 (PFS: p val = 0.12, OS: p val = 0.002) were significant for patient survival in univariate Cox analysis (Supplemental Table 1). Multivariate Cox regression studies were further performed to establish an independent prognostic value for both CD9-CD63 and Epcam-CD63. In addition to Epcam-CD63 or CD9-CD63, patient gender, age, tumour size, clinical stage, TNM staging (pT), differentiation status and lymph node metastasis were evaluated in the multivariate Cox regression model. Step-wise variable selection was used to find the final model. TNM stage Multivariate Cox modelling clearly shows thatthe CD9-CD63 level is an independent prognostic covariate for both PFS and OS (p = 0.048 and 0.0038, respectively). The Epcam-CD63 level is an independent prognostic factor for OS (p = 0.01), but not for PFS (p = 0.246) ().
Table 2. Multivariate Cox model for PFS and OS.
In order to give a more visible comparison, a Kaplan-Meier survival curve was performed for the survival difference between groups of patients with high or low levels of EV biomarkers. The cut-offs were selected at the highest Youden index when trying to discriminate the PFS and OS in the two groups via EV biomarkers. Consistently, two groups of patients with high and low levels of CD9-CD63 had significantly different survival curves for both PFS (p = 0.003 at cut-off 6.62) and OS (p = 0.00031 at cut-off 6.70) ( and )). However, unlike the results from themultivariate Cox regression for Epcam-CD63, the Kaplan-Meier survival curve comparison shows the two groups of patients with different levels of Epcam-CD63 also had significantly different survival curves for PFS (p = 0.022 at cut-off 0.56) and OS (p = 0.0045 at cut-off 0.43) ( and )).
Figure 4. Prognostic values for the EV detection assays in CRC samples.
Discussion
Colorectal cancer (CRC) has the third highest incidence (10.2%) in total cases and the second highest mortality (92%) in total cancer deaths for both sexes worldwide [Citation27]. Detection through robust screening for CRC could significantly reduce mortality associated with the disease. Currently, neither colonoscopy nor faecal occult blood test can fully meet the needs of CRC screening, because of the complicated and invasive procedure or poor performance of the screening, respectively. In addition, the most commonly used biomarkers in the management of patients with CRC, CEA and CA125, provide an insufficient level of sensitivity.
In this study, we have developed anultrasensitive, non-invasive, fully automated and high-throughput EV detection assay using Epcam/CD63 and CD9/CD63 markers with SiMoa technology. More importantly, the plasma EV and T-EV levels detected by the two assays had superior clinical performance in diagnosing CRC when compared to the conventional serological biomarkers CEA and CA125.
As promising biomarkers in liquid biopsy, EVs have received considerable interest in the diagnosis and monitoring of cancer [Citation28]. However, the feasibility of high throughput isolation of EVs from complex biological fluids, such as plasma samples, has not yet been demonstrated, leading to great anticipation of an easy and rapidmethod for evaluating circulating EVs. Over the past few years, the SiMoa platform has proven to be an ideal tool for clinical settings, since it is simple, fully automated and allows for ultrasensitive detection of proteins [Citation10,Citation11]. Although the SiMoa technology was originally designed for protein detection, the platform should allow for the detection of particles small enough to be loaded into the micro-wells on the surface of microscopic bead, such as microvesicles and exosomes. By targeting the double-positive EV surface biomarkers CD9 or Epcam with CD63 (all of which are reported to be highly expressed in both EVs and exosomes [Citation4,Citation6]), two EV detection assays were developed and further validated for clinical applications in CRC diagnosis and prognosis. It has been reported that the level of extracellular vesicles in the blood is higher in cancer patients than in healthy individuals [Citation29]. In our study, we observed an increased amount of universal EVs in samples from CRC patients when compared to healthy people and benign tumour patients. Our results are consistent with those obtained by J Silva et al. [Citation30] who found the fraction of exosomes in colorectal cancer patients was significantly higher than in healthy controls (mean rank = 53.93 vs. 24.35) and the high levels of exosomes in plasma also tended to be associated with shorter overall survival (p = 0.056). Y. Matsumoto et al. [Citation31] showed higher exosome levels in oesophageal cancer patients (n = 66) compared with non-malignant patients (n = 20) (p = 0.0002) when quantified by acetylcholinesterase (AChE) activity, which is known to be elevated within the exosome [Citation32]. Jakobsen et al [Citation29]. reported higher CD9, CD63 and CD81 signal levels in non-small cell lung carcinoma using EV arrays. Moreover, these increased signals had significant correlation with poor outcomes in CRC patients.
In addition to the universal EV markers, T-EV could be a more specific biomarker, since it is enriched with a group of tumour antigens, tumour associated microRNAs, long non-coding RNAs and mRNAs, which have all been reported to be good exosome biomarkers in many studies [Citation5,Citation28,Citation33]. However, we did not observe better performance of the T-EV assay (Epcam-CD63) than the universal EV assay (CD9-CD63) on CRC diagnosisin our study. Similarly, a less efficient performance of Epcam-CD63 on CRC prognosis was also observed. There was no significant correlation of Epcam-CD63 with PFS in the Multivariate Cox model, while it was significant in the KM survival analysis, in which other variables did not need to be controlled. A possible reason for these observations may be that the expression of Epcam as a biomarker for T-EVs is not sufficiently specific. Epcam is commonly expressed in CRC, and its expression was significantly higher in CRC than in normal controls, especially associated with the carcinogenesis of CRC [Citation34–Citation37]. Meanwhile several previous investigations have reported interesting findings regarding the loss of Epcam expression during CRC progression [Citation35,Citation38].This issue might be addressed in future work on the T-EV assay by choosing better tumour markers. Furthermore, selecting biomarkers more specific to some tumours could allow SiMoa T-EV detection to target other various cancers.
Based on results from previous studies, we understand that EV evaluation should consider the optimization and standardization of biobanking procedures, including collection, plasma isolation and storage protocols [Citation39]. In this study, retrospective samples were used to evaluate the circulating EVs, where we selected samples with equivalent biobanking conditions. Compared to serum, plasma is more acceptable as an EV sample, since additional EVs will be released into the serum from activated platelets during the coagulation process [Citation40]. Even for plasma collection, there are several anticoagulants, such as EDTA, sodium fluoride, or citrate, used in the collection process that may affect the EV detection results [Citation41]. In this study, only EDTA plasma samples with a standard protocol from FUSCC were included to minimize sample heterogeneity. One potential disadvantage in using retrospective samples is that they may have experienced various durations of −80°C storage. However, earlier studies have reported that long-term storage and freeze-thawing seems to have no critical influence [Citation41]. In addition, some researchers have reported EV concentration decreases with patients of advancing age [Citation42]. In our cohort, the median age of the healthy subjects was significantly lower than that of tumour patients, which could also affect the results. Considering these potential variations on the retrospective samples used in our study, a future study with a more standardized process for sample collection is anticipated to validate the current results. Furthermore, other kinds of benign controls such as inflammatory bowel disease (IBD) patients, need to be included into the future studies to validate the specificity of the EV biomarkers.
Disclosure of interest
The authors report no conflict of interest.
Geolocation information
Shanghai, PR. China.
Supplemental Material
Download MS Word (2.8 MB)Acknowledgements
We thank Dr. Huang Shenglin (FUSCC) for the kindly technical assistance.
Supplementary material
Supplemental data for this article can be accessed here.
Correction Statement
This article has been republished with minor changes. These changes do not impact the academic content of the article.
Additional information
Funding
References
- Cocucci E, Meldolesi J. Ectosomes and exosomes: shedding the confusion between extracellular vesicles. Trends Cell Biol. 2015;25(6):364–12.
- Raposo G, Stoorvogel W. Extracellular vesicles: exosomes, microvesicles, and friends. J Cell Biol. 2013;200:373–383.
- Witwer KW, Buzas EI, Bemis LT, et al. Standardization of sample collection, isolation and analysis methods in extracellular vesicle research. J Extracell Vesicles. 2013;2. DOI:10.3402/jev.v2i0.20360
- Caby MP, Lankar D, Vincendeau-Scherrer C, et al. Exosomal-like vesicles are present in human blood plasma. Int Immunol. 2005;17:879–887.
- Mathivanan S, Simpson RJ. ExoCarta: A compendium of exosomal proteins and RNA. Proteomics. 2009;9:4997–5000.
- Yoshioka Y, Konishi Y, Kosaka N, et al. Comparative marker analysis of extracellular vesicles in different human cancer types. J Extracell Vesicles. 2013;2. DOI:10.3402/jev.v2i0.20424
- Raulf N, Lucarelli P, Thavaraj S, et al. Annexin A1 regulates EGFR activity and alters EGFR-containing tumour-derived exosomes in head and neck cancers. Eur J Cancer. 2018;102:52–68.
- Zhao Z, Yang Y, Zeng Y, et al. A microfluidic ExoSearch chip for multiplexed exosome detection towards blood-based ovarian cancer diagnosis. Lab Chip. 2016;16:489–496.
- McNamara RP, Dittmer DP. Modern techniques for the isolation of extracellular vesicles and viruses. J Neuroimmune Pharmacol. 2019. DOI:10.1007/s11481-019-09874-x
- Rissin DM, Kan CW, Campbell TG, et al. Single-molecule enzyme-linked immunosorbent assay detects serum proteins at subfemtomolar concentrations. Nat Biotechnol. 2010;28:595–599.
- Schubert SM, Arendt LM, Zhou W, et al. Ultra-sensitive protein detection via Single Molecule arrays towards early stage cancer monitoring. Sci Rep. 2015;5:11034.
- Chang L, Rissin DM, Fournier DR, et al. Single molecule enzyme-linked immunosorbent assays: theoretical considerations. J Immunol Methods. 2012;378:102–115.
- Darlix A, Hirtz C, Thezenas S, et al. The prognostic value of the Tau protein serum level in metastatic breast cancer patients and its correlation with brain metastases. BMC Cancer. 2019;19:110.
- Rissin DM, Fournier DR, Piech T, et al. Simultaneous detection of single molecules and singulated ensembles of molecules enables immunoassays with broad dynamic range. Anal Chem. 2011;83:2279–2285.
- Thery C, Witwer E KW, Aikawa MJ, et al. Minimal information for studies of extracellular vesicles 2018 (MISEV2018): a position statement of the international society for extracellular vesicles and update of the MISEV2014 guidelines. J Extracell Vesicles. 2018;7:1535750.
- Kowal J, Arras G, Colombo M, et al. Proteomic comparison defines novel markers to characterize heterogeneous populations of extracellular vesicle subtypes. Proc Natl Acad Sci USA. 2016;113:E968–977.
- Liang J, Piao Y, Holmes L, et al. Neutrophils promote the malignant glioma phenotype through S100A4. Clin Cancer Res off J Am Assoc Cancer Res. 2014;20:187–198.
- Koritzinsky EH, Street JM, Chari RR, et al. Circadian variation in the release of small extracellular vesicles can be normalized by vesicle number or TSG101. Am J Physiol Renal Physiol. 2019;317:F1098–F1110.
- Ho DH, Yi S, Seo H, et al. Increased DJ-1 in urine exosome of Korean males with Parkinson’s disease. Biomed Res Int. 2014;704678:2014.
- Zakharchenko O, Greenwood C, Alldridge L, et al. Optimized protocol for protein extraction from the breast tissue that is compatible with two-dimensional gel electrophoresis. Breast Cancer. 2011;5:37–42.
- Ratón ML, Álvarez MXR, Suárez CC, et al. OptimalCutpoints: an R package for selecting optimal cutpoints in diagnostic tests. J Stat Softw. 2014;61(8):1–36.
- Grambsch PM, Therneau TM. Proportional hazards tests and diagnostics based on weighted residuals. Biometrika. 1994;81(3):515–526.
- FIRTH D. Bias reduction of maximum likelihood estimates. Biometrika. 1993;80(1):27–38.
- Ploner M, Heinze G. coxphf: cox regression with Firth’s penalized likelihood. 2018. R package version 1.13. https://CRAN.R-project.org/package=coxphf
- R Core Team. R: A language and environment for statistical computing. 2017
- Carter L, Metcalf R, Blackhall FH, et al. Biology and clinical relevance of circulating tumour cells. J Thorac Dis. 2012;4:453–455.
- Bray F, Ferlay J, Soerjomataram I, et al. Global cancer statistics 2018: GLOBOCAN estimates of incidence and mortality worldwide for 36 cancers in 185 countries. CA Cancer J Clin. 2018;68:394–424.
- Taylor DD, Gercel-Taylor C. MicroRNA signatures of tumor-derived exosomes as diagnostic biomarkers of ovarian cancer. Gynecol Oncol. 2008;110:13–21.
- Jakobsen KR, Paulsen BS, Baek R, et al. Exosomal proteins as potential diagnostic markers in advanced non-small cell lung carcinoma. J Extracell Vesicles. 2015;4:26659.
- Silva J, Garcia V, Rodriguez M, et al. Analysis of exosome release and its prognostic value in human colorectal cancer. Genes Chromosomes Cancer. 2012;51:409–418.
- Matsumoto Y, Kano M, Akutsu Y, et al. Quantification of plasma exosome is a potential prognostic marker for esophageal squamous cell carcinoma. Oncol Rep. 2016;36:2535–2543.
- Savina A, Vidal M, Colombo MI. The exosome pathway in K562 cells is regulated by Rab11. J Cell Sci. 2002;115:2505–2515.
- Kosaka N, Iguchi H, Ochiya T. Circulating microRNA in body fluid: a new potential biomarker for cancer diagnosis and prognosis. Cancer Sci. 2010;101:2087–2092.
- Karanikiotis C, Skiadas I, Karina M, et al. A novel chromatographic method for Ep-CAM mRNA detection in peripheral blood and bone marrow of patients with metastatic colorectal cancer. Anticancer Res. 2005;25:319–323.
- Kuhn S, Koch M, Nubel T, et al. A complex of EpCAM, claudin-7, CD44 variant isoforms, and tetraspanins promotes colorectal cancer progression. Mol Cancer Res. 2007;5:553–567.
- Chai XB, Song RF, Xu F. Expression changes in epithelial cell adhesion molecule during colorectal cancer tumorigenesis. Genet Mol Res: GMR. 2015;14:7624–7629.
- Zhou FQ, Qi YM, Xu H, et al. Expression of EpCAM and Wnt/beta-catenin in human colon cancer. Genet Mol Res: GMR. 2015;14:4485–4494.
- Gosens MJ, van Kempen LC, van de Velde CJ, et al. Loss of membranous Ep-CAM in budding colorectal carcinoma cells. Mod Pathol. 2007;20:221–232.
- Mora EM, Alvarez-Cubela S, Oltra E. Biobanking of exosomes in the era of precision medicine: are we there yet? Int J Mol Sci. 2015;17. DOI:10.3390/ijms17010013
- Wolf P. The nature and significance of platelet products in human plasma. Br J Haematol. 1967;13:269–288.
- Baek R, Sondergaard EK, Varming K, et al. The impact of various preanalytical treatments on the phenotype of small extracellular vesicles in blood analyzed by protein microarray. J Immunol Methods. 2016;438:11–20.
- Eitan E, Green J, Bodogai M, et al. Age-related changes in plasma extracellular vesicle characteristics and internalization by leukocytes. Sci Rep. 2017;7:1342.