?Mathematical formulae have been encoded as MathML and are displayed in this HTML version using MathJax in order to improve their display. Uncheck the box to turn MathJax off. This feature requires Javascript. Click on a formula to zoom.
ABSTRACT
Background: Currently literature on the impact of patent expiry on drug prices is lacking.
Objective: To determine the impact of patent expiration and generic entry on drug prices in the Netherlands.
Methods: Prescription and price data from 1999 up to and including December 2016 were collected from two national databases. The overall price ratio of drugs prices up to 48 months after patent expiration was compared to the price in the month before expiry. Sub-analyses were performed to provide insights in generic uptake, length of market exclusivity and price development for originators and generics separately.
Results: In total 250 drugs faced patent expiration during the study period. Forty-eight months after patent expiration the median price ratio decreased to 0.59 (IQR = 0.23–0.86) compared to the month prior patent expiry. Major differences in price developments were observed depending on the level of revenue prior to patent expiration and the time of patent expiration with ratios ranging from 0.08 (IQR = 0.07–0.16) to 0.81 (IQR = 0.62–0.97). Prior to patent expiry, the price decreased by 2.3% annually while having market exclusivity for 11.3 years on average.
Conclusion: This study showed that the median drug price after patent expiration decreased by 41% after 4 years. The results of this study can be used to provide more reliable estimates on drug prices over its lifecycle and can be implemented in economic evaluations to inform the cost-effectiveness and long-term budget impact of new drugs.
Introduction
In the Netherlands, the discussion regarding drug pricing has become more prominent in society during the last decade, with a focus on long-term affordability. Well-funded decision-making and knowledge regarding drug pricing over the lifecycle is key when accepting products in the reimbursement system and to advance in the discussion regarding drug spending. Drug pricing plays a crucial role in reimbursement decisions [Citation1–2], in which the cost-effectiveness ratio is based on the price at launch. However, in general prices of a patented drug gradually decline after market introduction. This decline increases after patent expiration, as generic copies of the originator are introduced. By including the price lifecycle of drugs, the cost-effectiveness ratio and budget impact of drugs [] can be estimated more precisely. This may lead to better reimbursement decision-making that reflects the real-life outcomes and subsequently improve the availability of drugs for patients.
Table 1. Calculation of mean drug prices and price ratios
A previously published systematic review showed that there are limited data available on the impact of patent expiry on drug prices for the European countries [Citation3]. With solid country-specific data lacking, it is currently impossible to predict the impact of patent expiry on the price of newly introduced drugs, not to mention considering such impact on budget impact and cost-effectiveness of new pharmaceuticals in the European market.
The aim of this study was therefore to determine the impact of patent expiration on drug prices using the data from national drug price and sales databases in the Netherlands. Additionally, we also investigated the price development after patent expiration of originator and generic drugs separately, the price development of originator drugs before patent expiration and the generic uptake after patent expiration. The outcomes of this article can be used to inform cost-effectiveness analyses and long-term budget-impact studies for a better underpinning of reimbursement decisions.
Methods
Data sources
Data from two national databases covering the entire Dutch population were used in this study. First, drug prices and general information on drugs were extracted from the G-standard [Citation4]. The G-standard is a digital database containing comprehensive information on all drugs available on the Dutch market. Every month an update is released, as approximately 65 different raw text files (ASCII, fixed length), containing information on new products and list price changes. From these files, all unique Stock Keeping Units (SKUs) that were available between January 1999 and January 2017 were selected. Additionally, for all selected SKUs, data on the Anatomical Therapeutic Chemical (ATC) class, Defined Daily Dose (DDD) information, the manufacturer, form of administration, trade channel and prices were extracted. The relevant series of files were read into a single database and stored in a cumulative longitudinal format. This process was performed for all releases from January 1999 up to and including December 2016. Second, sales data for selected drugs (see below) were obtained from a national sales database containing the number of packages sold per month for every separate product (SKU) in the Netherlands [Citation5]. In total 1982 ATCs were available between January 1999 and December 2016 ().
Figure 1. Flowchart of the selection of products developed categorized by revenue. *Wet Marktordening Gezondheidszorg (WMG): The healthcare market regulation act. *Z-index [Citation4]
![Figure 1. Flowchart of the selection of products developed categorized by revenue. *Wet Marktordening Gezondheidszorg (WMG): The healthcare market regulation act. *Z-index [Citation4]](/cms/asset/3c0486e8-d4de-4c0c-afb3-05cfe4567845/zjma_a_1849984_f0001_oc.jpg)
Drug selection
An automated query was run to categorize the data in the software package R (version 3.5.3, R-core team, Vienna, Austria) using the Dplyr package version 1.0.0. to select all drugs that faced initial generic entry during the study period, using ATC codes to identify patented-drugs and corresponding generics. The moment of initial price listing of a generic drug (e.g., generic entry) was used as a surrogate for the moment of patent expiration, similar to previously published studies on the same topic [Citation3]. All selected drugs were manually reviewed to see if the inclusion criteria were met. Drugs that did not meet these criteria were excluded. In case of disagreement regarding the reviewed drugs, the cases were reviewed individually by the other authors and discussed until consensus was reached. Drugs (ATCs) were included for analysis if the originator was exclusively available with the absence of generic counterparts for at least 3 months during the study period; after which generic competitors entered the market with the originator product still being available. The resulting database was subsequently used to estimate the relative impact of patent expiry on drug prices in the Netherlands.
Calculation of drug price ratios
For each individual drug, the mean drug price ratios after patent expiration for each month was calculated using R (version 3.5.3, R-core team, Vienna, Austria), following the equations displayed in box 1. All calculations were conducted within the monthly unit and the same calculation applied to all months. First, price per DDD for a certain SKU (Psku) was calculated by dividing the package price per SKU by the amount of DDDs contained within this specific SKU (Equation 1). Second, this PSKU was multiplied by the ratio of the monthly sales in amount of DDDs for a certain SKU (SSKU) compared to the monthly sales in amount of DDDs for the entire ATC group (SATC) to calculate the mean drug price for a specific SKU. The mean monthly drug price (MPDDD) was then calculated by adding all per SKU drug price (Equation 2). Next, the relative price ratio was calculated for every drug by dividing MPDDD by the price per DDD at the moment of initial generic entry (1 month prior to patent expiry) (Equation 3).
Reported outcomes
In the primary analysis, we calculated the median, mean, interquartile range (IQR) and the range overall price ratio across all drugs. The main outcome of interest presented is the overall ratio of drug prices up to 48 months after patent expiration compared to the price in the month before patent expiry. A paired t-test was performed between the price ratio 12 months before and 48 months after patent expiry. Several sub-analyses were performed based on the expectation that the impact of patent expirations could be influenced by both policy changes as well as drug revenue prior to patent expiration. Since 2009, healthcare insurers were allowed to only reimburse the lowest priced generic drug in the Netherlands [Citation6]. This alteration in the drug reimbursement policy resulted in more price competition between generic drug manufacturers, lowered generic prices overall and decreased the overall number of generic manufacturers [Citation7]. For this reason, the impact of patent expiration was also analyzed separately for drugs that faced initial generic entry before and after 2009. We also expected that drug with higher annual revenue would attract more generic manufacturers resulting in more competitions and subsequently lower price ratios. Therefore, we further divided drugs into three categories based on the revenue in the year prior to patent expiration; those with revenue of less than €4 million, those with revenue between €4 to €40 million and those with revenue of more than €40 million. The choice of these categories was made in order to create balanced sample sizes (€4 million cut-off) and because €40 million is used as a criterion by the Dutch government to define drugs with a large budget impact. For all groups, the descriptive statistics were expressed as mean, median, IQR and range. We also investigated the price developments after patent expiry of the originator and generic drugs separately (see ). Finally, we also explored the price developments of originator drugs after initial market entry until patent expiration. All calculations were performed using R with the exceptions of the final analyses in which price ratios were computed using Microsoft Excel (Microsoft, Redmond, WA, USA).
Results
Drug selection
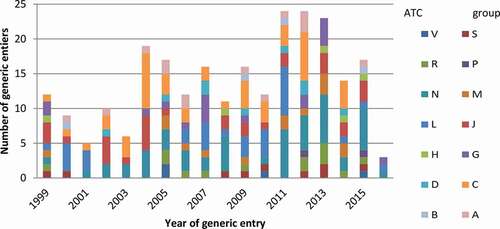
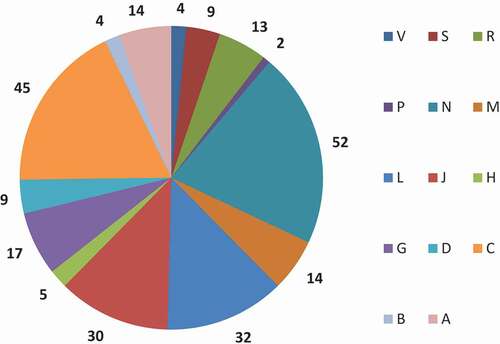
In total 250 drugs faced patent expiration during the study period. Of these 250 drugs, 117 patents expired prior to 2009 and 133 post 2009 (see ). displays the total number of drugs with generic by ATC group and year. The mean number of patent expiries per year was 15, although this varied, between 3 in 2016 and 24 in 2011 and 2012 (). The peak numbers of generic entries were during the period between 2011 and 2013: 28% (n = 71) of all included drugs in this study. Most patent expiries (n = 52) occurred for drugs acting on the central nervous system, followed by drugs for cardiovascular disease (n = 45) and antineoplastic and immune-modulating agents (n = 32) ().
Figure 2. Total number of drugs with generic entries between 1999 and 2016 by ATC group and year
Generic uptake
For all included drugs, the average generic uptake in DDD gradually increased from 39% at initial generic entry to 73% of the prescribed amount of DDDs in the first 48 months after initial generic entry (). Generic uptake was slightly faster for drugs facing patent expiry after 2009 as well as for drugs with higher revenue prior to patent expiry. Four years after patent expiry, 86% of the drugs prescribed where generics for drugs with annual revenue exceeding €40 million compared to 70% on average for drugs with annual revenue below €4 million.
Figure 3. Mean generic uptake after patent expiry as proportion of the amount of DDDs prescribed after initial generic entry compared to the DDDs prescribed for the originator drug
Price impact of patent expiry
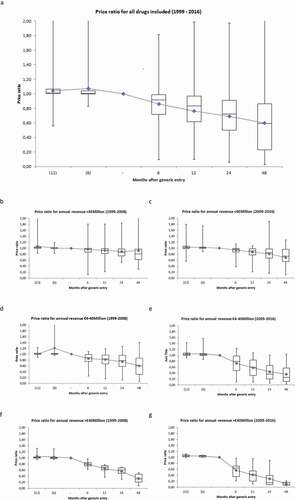
The box–whisker plots in ) depict the median, mean, IQR and the range of the price ratios 12 and 6 months before- and 6, 12, 24 and 48 months after patent expiration. Overall the median price ratio 48 months after initial generic entry was 0.59 (IQR = 0.23–0.86, p < 0.05). Nevertheless, large differences in price developments were observed depending on the level of revenue prior to patent expiration and on the time of patent expiration. In particular, higher revenue in the year prior to patent expiration resulted in lower price ratios as did more recent patent expiries (i.e., those after 2009). Four years after patent expiration the mean price ratios were 0.81 (IQR = 0.62–0.97, p = 0.139), 0.60 (IQR = 0.31–0.86, p < 0.05) and 0.31 (IQR = 0.21–0.47, p < 0.05) for drugs that lost their patent before 2009 and that had annual revenues of <€4, €4 – 40 and >€40 million, respectively. These ratios were substantially lower for drugs of which the patent expired after 2009. For drugs with annual revenue of <€4 Million before patent expiration the median price ratio was 9% lower for those expired after 2009 compared to those before 2009 (0.74, IQR = 0.55–0.97, p < 0.05). The same ratio was 58% lower for drugs with annual revenue ranging between €4-40 million (0.25, IQR = 0.12–0.57, p < 0.05) and 74% for drugs with annual revenue ≥€40 million 48 months after patent expiration (0.08, IQR = 0.07–0.16, p < 0.05).
Figure 4. Box–whisker plot for price developments of all drugs included (a); facing generic entry prior to 2009 (b, d, f); after 2009 (c, e, g), stratified by annual revenue before patent expiration
Price developments prior to patent expiry
The price developments of originator drugs after initial market entry were analyzed in a sub-analysis containing 61 drugs which entered the market after March 1999 and had their patents expired within the study period. The median and mean annual price decrease were 2.3% and 1.9%, respectively, during the market exclusivity period. The average market exclusive period was calculated as 11.3 years (). Based on this value, the average total price decrease between market entry and patent expiry was calculated as 20.7%.
Price developments of originator and generic drugs
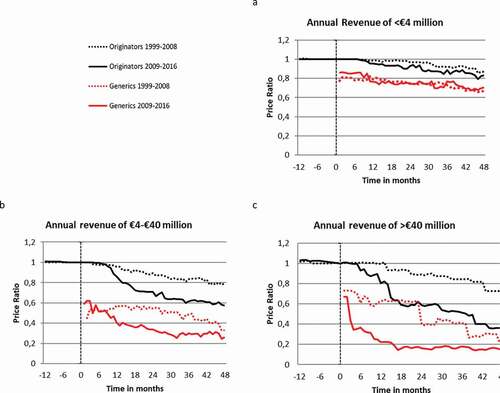
Median price developments for originator and generics separately are shown in . The price ratio of the originator drugs differed by annual revenue prior to patent expiration and the patent expiration date (). Overall, the median price ratios of originator drug were always higher than generics. Similarly, the price ratio of drugs with an expiring patent before 2009 was in general higher compared to drugs with an expiring patent after 2009.
Discussion
This is the first study to investigate the impact of patent expiration on the drug prices for the Dutch market using two national databases including 250 drugs of which the patent expired. Four years after initial generic entry the median price ratio of these drugs was 0.59. However, the price decrease varied widely. Ranging from 0.08 to 0.81, depending on the revenue prior to patent expiration and the year of patent expiration. Additionally, it was shown that drug prices also decreased by 2.3% annually on average during the period of market exclusivity. The combination of the annual decrease during the market exclusive period with the impact of patent expiration indicates that drug prices 48 months after patent expiration are 74% lower compared to initial market entry on average.
The results of this study can be used to predict the price developments and budget impact of newly registered drugs in the Netherlands, as well as those that are bound to face patent expiry and generic entry in the near future. This study can also be used to complement the Horizon scan, an initiative in the Netherlands to track all the innovative drugs that will come to the market as well as drugs that will have their patent expired in the near future [Citation8]. In particular, the outcomes of this study can be applied to estimate the cost-effectiveness of innovative drugs for pricing and reimbursement purposes. The data presented in this study enable the modelling of dynamic prices over the lifetime of a drug instead of the static price that is currently used in HTA and decision-making processes. Implementing price changes and possible generic substitution after patent expiry will retrieve a more reliable estimate of the cost-effectiveness of that drug in practice. This is especially the case for chronic diseases, as drugs for chronic diseases are used during the patients’ entire life. Having a cheaper generic available 10–12 years after initial generic entry will improve the cost-effectiveness ratio of these drugs. In most cost-effectiveness models only one cohort of patients is modelled. However, with a dynamic price, it would make sense to develop multi-cohorts models for more reliable estimations to fully capture the benefits of future patients.
We showed that the impact of patent expiration on price is largely influenced by the revenue prior to patent expirations, with larger revenue resulting in lower price ratios. Higher revenues prior to patent expiration might result in increased generic competition after patent expiration resulting in lower prices. This means that when our findings are being used as an input for cost-effectiveness analyses a prediction needs to be made about the potential revenue in the year prior to patent expiration.
Our analyses face some limitations. First and foremost, the prices were calculated based on drug list prices, which are publicly accessible and are often used for international reference pricing purposes. These prices might not represent the real price paid for the drug as price negotiations often lead to confidential discounts and price volume agreements between manufacturer and the government or healthcare provider [Citation9]. In line with other studies, we defined the moment of patent expiry as the moment of initial generic entry [Citation3]. Although this might be representative in most cases, not every drug is bound to face generic entry after patent expiry. This might especially be true for orphan drugs with low patient numbers and budget impact. Using a surrogate marker for patent expiration could also have slightly biased our estimate of the market exclusivity period in the Netherlands (11.3 years). The Netherlands uses a reference pricing scheme, which calculates the maximum price of a drug based on prices of similar drugs in surrounding countries (Belgium, Norway, France and the UK). The maximum drug prices are recalculated twice a year, which has proven to lead to overall price decreasing of drugs [Citation10]. There is a possibility that the calculated price decrements during the market exclusive period were partly due to reference pricing as price decrements were estimated as high as 3–4% per annum in 2010 [Citation10].
Future research is recommended to validate and compare our results in other European markets to improve the broadness and comparability of our data. Analyses with our type of data are yet scarce in the literature. Various methods can be applied to our data. Our analysis should be seen as a first step in analysing this type of data. As a next step, formal time series analysis could be performed. The possibilities for implementation of price developments in health economic analysis of new and innovative drugs and the following consequences of price-decreasing on cost-effectiveness outcomes should also be explored.
Conclusion
Drug prices decreased during the lifetime of a drug and especially after patent expiry, the median prices decreased by 41% corresponding to a median price ratio of 0.59. The reduction of the price ratio is dependent on the revenues generated prior to patent expiry. Data on these price developments within the total market can be used to provide more reliable estimates on future drug prices as well as pharmaceutical healthcare expenditures. Data on price developments over the lifetime of drugs can also be implemented to provide better estimates on the cost-effectiveness of new and innovative drugs.
Compliance with ethical standards
Pfizer paid for the purchase of the data from the Netherlands National Sales Database and Pfizer paid Data Scientia for work associated with data extraction and processing.
Author contributions
GTV, MHR and MJP developed the design of this study. GTV SV and QC carried out the data collection and conducted the data extraction and were supplemented by MHR for discussion in case of disagreement on formatting the data. The data was analysed by GTV, SvdS, SvdP, QC and MHR. All authors contributed in the conceptualization of the paper. GTV, SvdS and MHR drafted the manuscript. All authors revised it critically for intellectual content. All authors read and approved the final manuscript.
Disclosure of interest
All other authors declare that they have no competing interests.
References
- Vogler S, Habl C, Bogut M, et al. Comparing pharmaceutical pricing and reimbursement policies in Croatia to the European Union Member States. Croat Med J. 2011;52(2):183–9.
- Fens T, van der Pol S, Kocks JWH, et al. Economic impact of reducing inappropriate inhaled corticosteroids use in patients with chronic obstructive pulmonary disease: ISPOR’s guidance on budget impact in practice. Value Heal. 2019;22(10):1092–1101.
- Vondeling GT, Cao Q, Postma MJ, et al. The impact of patent expiry on drug prices: a systematic literature review. Appl Health Econ Health Policy. 2018;16(5):653–660.
- Z-index. G-Standaard databank. https://www.z-index.nl/g-standaard.
- Axon. Close-UP national sales database. Available from: https://www.close-up-online.nl/close-up/Logon.aspx?ReturnUrl=%2Fclose-up%2FDefault.aspx.
- OPG group n.v. Press release preference policy causes extreme price decline. 2008. https://www.afm.nl/downloadregisterfile.aspx?type=openbaarmaking-voorwetenschap&enc=7Rpj0BBaMD5lzfwUlyQ9TIe+XbKYS1JE7+GVfXY2PxNqAT3NVNKp3QCQcI2WUb5gS/PYmhvg5EA+E7FpgiengZj0NLAMUDbP/oPnUtKH27VA0/CZGu7E4hLGdYYwwWpdhBL08ujGS087vBs9s/swrPvInrNxipZU6u/SvcVoaoQe+UGBFWjFGKmjOfq3TbL9KqxrE8GZ1uNd6BSBgSdTr/r7op8zwc/cJUTo87J0LQMsgmtRbb2oTKuoptZpNr0//uK8W4ohbMnr1dvbzx6yl5hVzFfiM/38JZkNenrJbQBPYiveQkQYIsm+5sUrEDIUy2+YYhNalosoIo7UR2EAMF17Bw8bj8WFsS1P0OqOfhQ=OPG Group N.V. Press release: Preference policy causes extreme price decline. 2008.
- Carp M, Kraal A, de Bekker P, et al. Management summary: effects of the preference policy for pharmaceuticals on the availability of medicines. 2018. https://www.berenschot.nl/publish/pages/6054/effects_preference_policy-berenschot.pdf
- Zorinstituut Nederland. Geneesmiddelen horizonscan. Published 2017. Available from: https://www.horizonscangeneesmiddelen.nl/binaries/content/assets/horizonscan/gepublicatie-scan-1-september-2017-correctie.pdf.
- Morgan SG, Vogler S, Wagner AK. Payers’ experiences with confidential pharmaceutical price discounts: A survey of public and statutory health systems in North America, Europe, and Australasia. Health Policy (New York). 2017;121(4):354–362.
- Kengetallen SF. Steeds meer geneesmiddelen onder de WGP. Pharm Weekbl. 2010;145(46–47):11.
Appendix
Figure A1. Total number of drugs with generic entry between 1999 and 2016 by ATC group
Number of Generic Competitors Introduced
During the first 3 months after patent expiration, there were on average 2.9 competitors that entered the market for all 250 included drugs. This number gradually increased to 5.8 competitors over the entire lifetime of a drug. A slight underestimation might exist in our presented evidence due to the limited follow-up time of various included drugs. The average number of generic competitors was 7.1 when the entry period was limited to 2009.
Market Exclusivity Period
Sixty-one drugs had a first-time price listing in March 1999 or later, meaning that these drugs did not have any generic competition at the start of the database (Jan 1999). The length of the market exclusivity periods of these drugs is shown in Appendix . The average period of market exclusivity ranged from 11 to 177 months with a median and mean duration of 10.6 years (127 months) and 10.1 years (122.1 months), respectively. Ritalin® had the shortest market exclusive period (11 months), while both Chirocain® & Micardis® had the longest market exclusivity period with 177 months. Nevertheless, the most recent numbers might be underestimated as drugs that did not went off-patent are not taken into account (as they were not selected). When the market entry period was limited to drugs that went off-patent before January 2002, the mean and median market exclusive period became 135.8 months (11.3 years) and 142.5 months (11.9 years), respectively.
Figure A2. Length of the market exclusive period of all drugs that entered the market after January 1999 and had generic entry between 1999 and 2016
Three biological drugs and three drugs with orphan status that faced patent expiry and generic entry were identified within the included drugs. Price developments of these drugs were also assessed in a separate analysis. Price ratios of biological drugs remained rather stable over time and showed no significant price decreases. The mean and median price ratio for the three biological drugs 48 months after patent expiry was 1.05 and 1.06, respectively. The three included drugs with an orphan designation did show price decreasing after patent expiry with respective mean and median price ratios of 0.33 and 0.11, 48 months after patent expiry.
Figure A3. Median price ratio of generics and originator drugs 12 months prior up to 48 months after patent expiration. (a) The price ratio of drugs with revenues below €4 million in the year prior to patent expiry. (b) The price ratio of drugs with revenues of €4-10 million in the year prior to patent expiry. (c) The price ratio of drugs with revenues of >€40 million in the year prior to patent expiry