
 ?Mathematical formulae have been encoded as MathML and are displayed in this HTML version using MathJax in order to improve their display. Uncheck the box to turn MathJax off. This feature requires Javascript. Click on a formula to zoom.
ABSTRACT
Introduction: To ensure the sustainability of the AT access improvement, it is important that health system stakeholders have timely, analyzed information accessible for reference and decision-making support. In this study, we projected the direct costs required as well as the expected direct medical cost-offset and productivity benefits resulting from improving the disease control. Methods: We implemented a deterministic, prevalence-based mathematical model to project the annual cost of rheumatoid arthritis (RA) management within the public healthcare system in Malaysia. We also calculated the annual productivity loss due to uncontrolled RA in monetary value. Using the projection model, we compared the projected costs of the status quo scenario vs. several scenarios of improved advanced therapy (AT) access over a 5-year period. Results: We projected that between 10,765 and 11,024 RA patients in Malaysia over the period of 2020–2024 will need access to AT due to treatment failure with conventional synthetic disease modifying antirheumatic drugs (DMARDs). The projected net total medical cost under the status quo scenario were 163.5 million annually on average (approximately MYR 15,000 per patient per year). Cost related to health service utilization represented the heaviest component, amounting to 71.8% followed by drug cost (24.7%). Under the access improvement scenarios, drug cost constituted a higher proportion of the total medical, ranging from 25.6% to 30.4%. In contrast, the cost of health service utilization shown a reverse pattern (reducing to between 66.3% and 70.1%). Productivity costs were also expected to reduce as AT access improved leading to better outcomes. Treatment shifts to targeted synthetic DMARDs in anticipation of price adjustment appeared to have a cost saving advantage to the health system if all other parameters remain unchanged. Discussion: Improving AT access for RA patients towards the aspirational target appeared to be feasible given the current health budget in Malaysia. Broader socio-economic consequences of productivity and income loss should be included as an important part of the policy consideration. The financial implication of different AT utilization mixes and the anticipated price adjustment will likely result in some cost saving to the health system.
Introduction
Efficient and equitable allocation of resources have been a great challenge to many health systems, especially in the developing world. Similar to many middle-income countries, Malaysia is facing the same challenge as chronic diseases have become the major contributor to morbidity and mortality [Citation1]. In particular, chronic inflammatory diseases such as rheumatoid arthritis (RA), a systemic inflammatory disease affecting the synovium of joints and beyond, are particularly debilitating. It poses a significant social and economic burden as the population grows and life expectancy increases [Citation2,Citation3]. The risk of functional disability in RA increases with higher disease activity, leading to low quality of life and elevated mental health issues [Citation4].
Given that RA typically affects individuals during their most productive ages, inadequate control of RA not only results in great suffering and disability but also has a significant impact on their work productivity and financial income [Citation5,Citation6]. A study conducted in the Netherlands suggested that workers with RA lost about 4.0 h of productive work every two weeks [Citation7]. In Australia, 75% of those who suffered from RA lost greater than AUD 10,000 a year in personal income as a result of their disease [Citation5].
Treatment options for RA have evolved tremendously over the past two decades. The development of advanced therapies (AT) for RA, such as biologics and targeted synthetic disease-modifying antirheumatics (tsDMARD) which act on specific inflammatory pathways to control RA, have dramatically improved RA outcomes [Citation8,Citation9]. The first biologic treatment was made available for RA control since more than 20 years ago [Citation10], with a hefty price tag initially. Over time, the cost of AT for RA has been reduced substantially. Today, these ATs are more affordable to many middle-income country health systems.
Recognizing the disease burden as well as the importance of AT in elevating the suffering and productivity loss among the RA patients, Ministry of Health (MOH) Malaysia has recently injected a dedicated sum of budget to improve AT access for RA patients who rely on the care of the public health system in Malaysia. To ensure the sustainability of the AT access improvement, it is important that health system stakeholders have timely, analyzed information accessible for reference and decision-making support.
In this study, we projected the direct cost required to sustain the access improvement that was initiated by the dedicated sum of budget from the Malaysia MOH. We then measured the potential direct health system cost-offset and productivity benefits resulting from the improvement of RA control. We first projected the direct costs of RA management to the MOH and the cost of productivity loss to the society for a five-year period, under a status quo scenario. We then reprojected the direct and productivity costs with various expectations and assumptions of access improvement and compared the projection with the status quo scenario to understand the financial requirement, potential cost offset and productivity gains. Additionally, we also explored the potential financial impact of different mixes of AT utilization in anticipation of the likely short-term changes in AT landscape and medicine prices in Malaysia.
Methods
Model description
We implemented a deterministic, prevalence-based mathematical model to project (1) the annual direct medical cost of RA management within the MOH health system and (2) the monetary value of annual productivity loss due to uncontrolled RA (). The population under examination are adults with moderate-to-severe RA unresponsive and/or intolerant to conventional synthetic disease modifying antirheumatic drugs (csDMARD). The setting of the model was the health system within the MOH. A 5-year projection horizon was used. Costs used were undiscounted. The Malaysian Ringgit (MYR) will be used in the projection.
Figure 1. Model Schematic. Module (1) projected the size of the target population and divided them by their treatment status. Module (2) calculated the average direct medical cost and productivity loss per patient. Multiplying the number of patients projected by module (1) and per patient average cost and loss by module (2) gave the total cost and benefits for a specific scenario.
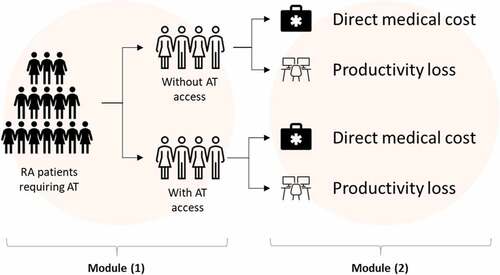
The model consists of two modules. The first module provided a projection on the target population size (i.e., the number of RA patients requiring and suitable for AT after failing conventional DMARD) as well as the patient number with vs. without AT access for each projection year. The second module provided the calculation of the average per-patient annual direct medical cost and cost of productivity loss. The calculation module for direct medical cost was an aggregation of six sub-modules representing the calculated cost of various RA-related health resource utilization (see ). Multiplying the number of patients projected by module (1) and the per-patient average cost by module (2) gave us the total direct medical and productivity cost for a specific scenario under examination.
Figure 2. Six sub-modules within the direct medical cost calculation.
Population size projection
We projected the size of the target population using data from the National Inflammatory Arthritis Registry (NIAR) and the Malaysian Registry for Biologics (MARBLE) [Citation11]. The NIAR captured data on RA patients’ demographics, clinical characteristics, clinical management, and outcomes since 2009 within the MOH setting. All major specialist hospitals with rheumatology service under the MOH supply data to NIAR via a web portal on a voluntary basis. The MARBLE captured administrative and safety data on biologics use across various inflammatory arthritis, with a focus on the utilization patterns and safety.
We used the NIAR data (Penang subset) to estimate the local RA prevalence in adults; the MARBLE data was used to estimate the proportion of RA patients treated with biologic therapy after failing csDMARD in Year 2019. listed the input values used in the model for the population size projection. In Malaysia, 80% of the population uses the MOH health services [Citation1]. Due to the non-mandatory nature of the NIAR, a 20% random under-reporting was assumed.
Table 1. Input values used in the model for the population size projection.
Calculation of direct medical costs
RA medication costs were calculated separately for csDMARD and advanced therapy. For patients treated with csDMARD, the cost of three subcategories were calculated – monotherapy, dual therapy, and triple therapy. Monotherapy with csDMARDs involves the use of a single csDMARD to treat RA. This may be appropriate for those with mild-to-moderate RA who have responded well to treatment with a single DMARD. Duo and triple therapy with csDMARDs involve the use of two or more DMARDs for more severe RA or for those who have not responded well to monotherapy. For each subcategory, we calculated the per-person-per-year cost weighted by the category-specific DMARD utilization proportion reported by Shahrir 2008 [Citation12]. We assumed full treatment adherence per clinical prescription. The IQVIA National Sales Audit (Malaysia) database for pharmaceutical products 2020 was used to inform the unit cost of each medication. IQVIA is a for-profit organisation that collects and provides data and information on pharmaceutical market intelligence in over 100 countries around the world. The Malaysia sales data for the public sector were obtained directly from the MOH procurement database via a partnership program. Pharmaceutical sales data (volume and value) were organized per anatomical therapeutic classification of the European Pharmaceutical Market Research Association.
For AT, a similar calculation approach was used. Two subcategories were calculated: biologic DMARD (bDMARD) and targeted synthetic DMARD (tsDMARD). Only agents that are reimbursed by the MOH were used in the calculation. A list of the reimbursed agents is provided as the supplementary materials (S1). Utilization-weighted per-person-per-year cost for each subcategory were calculated. Data from the MARBLE were used to inform the utilization distribution.
Other RA-related medications, including non-steroidal anti-inflammatory drugs (NSAID), cyclooxygenase-2 (Cox-2) inhibitor and corticosteroids were also included in cost of medication projection. We assumed that all patients on csDMARD would require these medications on regular intervals (3 days per week for NSAID/Cox-2i; six 30-days courses of corticosteroid) due to inadequate treatment response. These assumptions were verified with a panel of local rheumatologists per their local clinical practice. For AT users, a 30% reduction of these medication was assumed based on reported data [Citation11].
A list of common adverse event (AE) and annual absolute risk related to the use of csDMARD, and AT was established via literature review (See Supplementary Materials, S2) [Citation13–17]. Most of the AE listed except the management of tuberculosis required only effort equivalent to two sessions of outpatient care (MYR 274.29) per the panel opinion. For tuberculosis management due to the use of biologic, we referred to the cost estimated by Atif et al. (2014) (MYR 1,178.10) [Citation18]. All costs were adjusted to 2020 equivalent value using the health sector-specific consumer price index.
Annual utilization rates of health services among those unresponsive to csDMARD, including outpatient visits, emergency services and inpatient episode, were sought from a panel of local rheumatologists (due to lack of local data) based on their collective experience in providing care for this target population. It was assumed that those treated with advanced therapy will have (at least) a 50% utilization reduction on these health services as a result of outcome improvement, based on a previously published report [Citation19]. Cost per care episode for outpatient (MYR 68.57) and emergency service use (MYR 200.00) was referenced from the MOH services fee schedule. The cost per episode of inpatient care was informed by Dahlui et al. (2012) [Citation20].
The non-pharmacological treatment consisted of physiotherapy and occupational therapy. Utilization rates of these treatments for those unresponsive to csDMARD were informed by Shahrir et al. (2008) [Citation12]. A similar assumption of 50% utilization reduction for those treated with advanced therapy was similarly used. We included the cost of RA-related surgeries: arthrodesis, arthroplasty, synovectomy, and spinal surgery. Annual utilization rates of these procedures among those unresponsive to csDMARD were provided by data of NIAR and Jamsen et al. (2013) [Citation11,Citation21]. Please refer to the supplementary material (S3 & S4) for the input values used.
Calculation of productivity costs
The Human Capital Approach (HCA) was used to valuing the lost productivity [Citation22]. The HCA was deemed appropriate because presenteeism typically represents a high proportion of the total productivity loss in RA [Citation23–25]. This is consistent with the recommendation made by Lensberg et al. (2013) [Citation26].
We referenced the Canada-based COMET study [Citation27], which evaluated the impact of the etanercept-methotrexate (MTX) combination relative to MTX alone on work productivity among RA patients. In the study, the total productivity losses were reported in terms of number of day loss over a period of 52 weeks. We assumed that patients in the MTX alone arm (of the COMET study) represented a reasonably suitable proxy for the without-AT-access subgroup in our model; similar assumptions were made for the with-AT-access subgroup using the etanercept-methotrexate (MTX) arm findings. We converted the total productivity losses (in terms of day loss) to a percentage-based impairment factor (see S5 of supplementary material) and used the factor to calculate the cost of productivity loss per below formula:
P(t) = Monetary value of productivity loss for t treatment group; PrF = Productivity factor for t treatment group; mHI = median household income (annual). Average monthly household income (MYR 7,169) was used (2020).
Calculation of annual total direct and productivity cost
For each direct cost subcategory, we multiplied the projected number of patients within each treatment group with the distribution or annual event risks (or utilization rates) to obtain the patient or event (or care episode) number relevant to each cost category. The total subcategory cost is equal to this number multiply by the unit cost. The total direct cost for each projected year was the sum of all the cost subcategories across the two treatment groups. Productivity costs were calculated in the same manner.
Analysis
Base case analysis for at access improvement
Using the projection model, we compared the projected costs of two base case scenarios over a 5-year horizon: the status quo scenario vs. the scenario of improved biologics access. In the status quo scenario, the proportion of RA patients with access to biologics was assumed to remain unchanged. In the improved access scenario, the AT access proportion was projected upward in a series of stepwise incremental fashions. Three different improvement scenarios were assessed: 15%, 20%, and 25% relative increments in annual access proportion year-on-year. The scenarios examined were decided based on the local policy decision context advised by the clinician leaders. The goal here is to provide a range of different access improvement scenarios to the MOH for budget planning and assessment. The net cost or benefit is referred to as the difference between the status quo scenario vs. the improved access scenarios for the total direct and productivity cost.
Scenario analysis for different at utilization mixes
Different mix of AT utilization may affect the financial requirements differently due to their differential drug costs. Using the model, we examined two likely scenarios of AT utilization mixes: (1) 10% of bDMARD use move to tsDMARD with an anticipation of a 10–20% adjustment of price for tsDMARD; (2) 10% of tsDMARD use move to bDMARD with the same anticipated price adjustment. We assumed that the two categories of AT have similar efficacy and safety profiles based on currently available evidence.
Sensitivity analysis
The effects of uncertainty were explored via a one-way sensitivity analysis (OWSA). Parameters included and assessment range used in the OWSA are provided as Supplementary Table (S6).
Results
The projected number of RA patients requiring and suitable for AT after failing csDMARD ranges from 10,764 in 2020 to 11,024 in 2024 as shown in . The number was further divided by the AT access status for the status quo scenario. For the access improvement scenarios, the projected number of patients with AT access is shown in .
Table 2. Projected patient number and the breakdown by at access status under the status quo scenario.
Table 3. Projected patient number with at access under three access improvement scenarios. Yoy = year-on-year.
Direct medical and productivity costs
The projected direct medical costs (total and by cost subcategory) under the status quo scenario are tabulated in . The average annual medical cost per RA patient was approximately MYR 15,000. Cost related to health service utilization represented the heaviest component, amounting to 72.3% of the projected total direct medical cost. This was followed by drug cost, which was 23.9%. Non-pharmacological, surgical cost and other subcategories constituted only a small fraction of the overall medical cost (~3.8%). The total medical cost was projected to trend upward only slightly given the assumption of unchanged epidemiological and health system parameters (except the population growth).
Table 4. Projected total and subcategory direct medical costs under the status quo scenario.
Under the access improvement scenarios, drug cost carried a higher proportion of the total direct medical, ranging from 28.9% to 30.4% across the different scenarios and assessment years. In contrast, the cost of health service utilization is expected to show a reverse pattern, i.e., reducing to between 66.3% and 70.1%. The differential direct medical costs (absolute) are shown in . Details of the projected direct medical costs for the three AT improvement scenarios can be seen from S7 (a-c) of Supplementary Materials.
Table 5. Projected 5-year total differential direct medical cost in between the status quo scenario vs. the three access improvement scenarios.
Productivity costs are expected to reduce as AT access increases as a result of improved patient outcomes and functions. A 20% access improvement year-on-year over a period of five years is expected to give rise to MYR 2.5 million worth of productivity gains (i.e., reduced productivity cost), which is equivalent to an average of MYR 2,771.6 per patient-year on AT. provides details on the 5-year differential productivity cost projected by the model. Details of the projected productivity cost under the status quo scenario and the improved access scenario are provided in S8 of Supplementary Material.
Table 6. Projected 5-year differential productivity cost in between the status quo scenario vs. the three access improvement scenarios.
Differential drug cost with varying at utilization mixes
The projected financial requirement under different (assumed) mix of AT utilization is shown in . Higher use of bDMARD and tsDMARD without any changes of prices (of the tsDMARDs) is expected to result in a marginal reduction of the 5-year cumulative drug cost for the healthcare system. In contrast, (10%) treatment shift to tsDMARD (without tsDMARD price adjustment) may bring about an incremental cost impact to the health system assuming that all other parameters remain unchanged. Given the likelihood of a coming price adjustment for tsDMARDs due to several anticipated market factors in Malaysia, our assessment suggested that a 20% price reduction for tsDMARD will likely bring about a cost saving to the MOH based on a (10%) switch of bDMARD use to the tsDMARD category. ()
Table 7. Projected 5-year differential drug cost under different at utilization mixes scenarios (20% improvement scenario used).
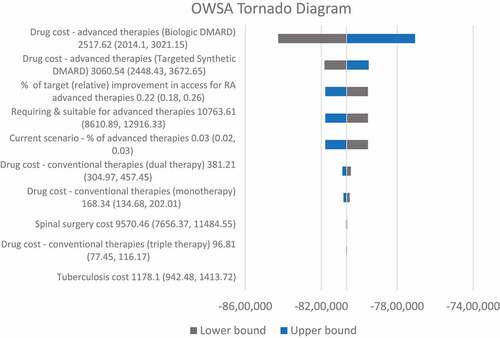
shows the results of the one-way sensitivity analysis. Parameters that most affected the target prediction appeared to be those related to the projection of the target population size and AT unit costs. Otherwise, the target prediction shows considerable robustness against changes to unit costs for other drugs, surgery, and other health service utilization.
Figure 3. Results of the one-way sensitivity analysis using a 20% range in both directions.
Discussion
The recent budget injection for RA AT access improvement by the Malaysian government is a commendable policy decision. A challenge that follows is to ensure that a financially sustainable improvement can be actualized. To do so, health system leaders and public financial controllers must be informed about the current reach of the initial funding as well as establish a realistic and anticipatory financial projection to support subsequent program upscaling.
Based on the model, we learned that the current available AT access for those who suffered from RA is indeed very limited. Based on the three access improvement scenarios we have examined; it is likely that we will need to achieve at least a 20–25% improvement over the short term in order to realize the treatment benefits at the population level. Our projection indicated that to achieve this desired 20–25% improvement over the shorter term, an incremental drug cost of approximately 30–40 million MYR will likely be required over the next 5 years. Of this amount, about 16% is expected to be offset by a lower cost from other areas resulted from improved outcomes. Eventually, the net cost to the health system as a whole will likely fall around 25–31 million MYR. This amount appeared to be in line with the proposed budget announced lately.
Loss of productivity and household income as a result of this debilitating condition represents another important consideration for any RA-related treatment policy. The annual productivity loss for those with moderate-to-severe disease was projected to be close to 100 million under the status quo scenario. This represented close to 60% of the total direct medical cost. This is consistent with studies from other regions and settings, which suggest that productivity costs in RA usually make up 0.5–1.0 times the amount of direct medical costs [Citation28–30]. Given the AT access improvement scenarios we have examined, productivity cost was indicated to reduce proportional to the access proportion by a significant 11% annually. This implies that when considering the burden of uncontrolled RA, policymakers should look beyond the direct health system impact. The broader socio-economic consequences of productivity and income loss should form an important part of the policy consideration due to its real-life significance.
In addition, our study has also assessed the differential financial cost by the various anticipated changes in AT utilization as well as the potential price adjustment for tsDMARD in Malaysia. We found that higher use of the orally administered tsDMARD will likely have a neutral effect on the overall financial requirements given the same number of beneficiaries, provided that the average price is reduced by about 20%. Based on a few market factors like the recent price adjustment of bDMARD, increased competitions among the different RA treatment options as well as the foreseeable expiry of exclusivity on certain tsDMARD products, it is anticipated that this magnitude of price adjustment for tsDMARD products is unavoidable.
Recent evidence suggested the similarity of efficacy among the various AT options. Moreover, international guidelines for RA management also recommended clinical use of AT regardless of their specific class. Hence, given the cost neutrality of increased tsDMARD use, health system stakeholders may contemplate other factors in making AT access policy and decision for RAfor example, patient preferences and ease of stock management. Previous studies have suggested that, orally administered treatment mode may be preferred by patients for various reasons [Citation31–33]. From a logistic standpoint, the ease of stock management for tsDMARD may also represent an additional plus point to improving the managerial efficiency of the MOH healthcare system and services, giving further indirect cost and resource saving potential beyond our projection.
There are two key limitations worth highlighting in this study. Firstly, our projection model was prepared to present some hypothetical courses of action that the MOH might consider. For example, the various AT access proportion to be improved and the different mixes of AT utilization to be directed. Hence, the underlying assumptions of the model were directed toward supporting these decision goals instead of aiming to achieve a highly accurate prediction or forecast [Citation34,Citation35]. Specifically, the potential changes of cost/price for drugs and services were not accounted for despite the possibility of the future changes. Similarly, the RA treatment landscape was also assumed to remain stagnant over the projection period, which might not be realistic. Yet, these assumptions were deemed essential to providing an interpretable outcome based on the examining courses of action for our target stakeholders. Nevertheless, we have used local and suitable published data or information, as much as we can, to optimize the real-world relevance of the projection wherever appropriate.
Secondly, we opted for the HCA for productivity valuation. We used the average salary for working adults in Malaysia as the proxy measure of employee outcome. This theoretically grounded approach assumes that companies employ labor until the marginal value of a worker equals the marginal cost of his/her salary [Citation36]. However, in the real world, an absent worker may or may not be replaced; temporary or permanently. Each of these likely outcomes represent different potential costs. As a result, different approaches could be used (such as the friction cost approach and the multiplier approach) [Citation26]. In the case of rheumatoid arthritis, presenteeism constituted a larger portion of the total productivity loss, which has been consistently shown in various previous study [Citation23–25]. Moreover, workers with RA are not normally replaced in entirety. As a result, the friction cost method was deemed not suitable. Valuing the lost productivity of a co-worker in the temporary absence of a RA patient at work is more desired (which can be estimated using the multiplier approach) [Citation26]. Yet, it was deemed infeasible in this study due to the lack of sufficient data and access.
In conclusion, improving AT access for RA patients towards the aspirational target appeared to be feasible given the current health budget in Malaysia. Additionally, the broader socio-economic consequences of productivity and income loss should be included as an important part of the policy consideration. Different AT utilization mixes with an anticipated price adjustment will likely have a minimal financial implication to the health system. Hence, the decision to providing access to the various AT options should be aligned between the clinicians and health system administrators in order to best balance the population health and financial goals of the healthcare system.
Notes on Contribution
CYF, NANM, SSC and MMZ conceived the analysis and contributed to collection of the data; All authors analyzed and/or interpreted the results; FCY & NANM wrote the first draft; All authors critically reviewed the content and approved the final version.
Supplemental Material
Download MS Word (18.7 KB)Acknowledgments
We are thankful to Dato’ Dr Hjh Azmillah Rosman and Dr. Habiba Mohamed Yusoof (Hospital Selayang, Malaysia) who provided expertise that greatly assisted this analysis. We would also like to express our appreciation to Nixon Teh and Ricardo Avila Galindo from Pfizer Malaysia for their inputs and support to this project.
Disclosure statement
FCY and NANM are employees of IQVIA, who were paid consultants to Pfizer in connection with the development of this manuscript. Other authors had no competing interests to declare.
Supplemental data
Supplemental data for this article can be accessed online at https://doi.org/10.1080/20016689.2023.2173117.
Additional information
Funding
References
- Harjit S, Gunn A, Abdul J, et al. NATIONAL HEALTHCARE ESTABLISHMENTS & WORKFORCE STATISTICS 2010. Chapter 5 | SURGICAL SERVICES IN MALAYSIAN HOSPITALS. 2010. http://www.crc.gov.my/nhsi/wp-content/uploads/publications/NHEWS_Hospital2010/Chapter5Hospitals_Report_2010.pdf
- Rudan I, Sidhu S, Papana A, et al. Prevalence of rheumatoid arthritis in low- and middle-income countries: a systematic review and analysis. J Glob Health. 2015 Jun;5(1):010409. DOI:10.7189/jogh.05.010409.
- Hsieh PH, Wu O, Geue C, et al. Economic burden of rheumatoid arthritis: a systematic review of literature in biologic era. Ann Rheum Dis. 2020 Jun;79(6):771–10. DOI:10.1136/annrheumdis-2019-216243.
- Ji J, Zhang L, Zhang Q, et al. Functional disability associated with disease and quality-of-life parameters in Chinese patients with rheumatoid arthritis. Health Qual Life Outcomes. 2017 May 2;15(1):89. DOI:10.1186/s12955-017-0659-z.
- Shanahan EM, Smith MD, Roberts-Thomson L, et al. The effect of rheumatoid arthritis on personal income in Australia. Intern Med J. 2008 Jul;38(7):575–579. DOI:10.1111/j.1445-5994.2007.01546.x.
- Merkesdal S, Ruof J, Schoffski O, et al. Indirect medical costs in early rheumatoid arthritis: composition of and changes in indirect costs within the first three years of disease. Arthritis Rheum. 2001;44(3):528–534.
- van Vilsteren M, Boot CR, Knol DL, et al. Productivity at work and quality of life in patients with rheumatoid arthritis. BMC Musculoskelet Disord. May 6 2015;16:107. DOI:10.1186/s12891-015-0562-x.
- Callhoff J, Weiss A, Zink A, et al. Impact of biologic therapy on functional status in patients with rheumatoid arthritis–a meta-analysis. Rheumatology (Oxford). 2013 Dec;52(12):2127–2135. DOI:10.1093/rheumatology/ket266.
- Iragorri N, Hofmeister M, Spackman E, et al. The effect of biologic and targeted synthetic drugs on work- and productivity-related outcomes for patients with psoriatic arthritis: a systematic review. J Rheumatol. 2018 Aug;45(8):1124–1130. DOI:10.3899/jrheum.170874.
- Upchurch KS, Kay J. Evolution of treatment for rheumatoid arthritis. Rheumatology (Oxford). 2012 Dec;51(Suppl 6):vi28–36.
- Merih B, Sedat Ç, Servet A, et al. Comparison of glucocorticoid and nonsteroidal anti-inflammatory drug requirement before and after tumor necrosis factor inhibitor treatment in patients with rheumatoid arthritis. Arch Rheumatol. 2015;30(3):206–213.
- Shahrir M, Shahdan M, Shahid M, et al. Multicentre survey of rheumatoid arthritis patients from ministry of health rheumatology centers in Malaysia. Int J Rheum Dis. 2008;11(3):287–292. DOI:10.1111/j.1756-185X.2008.00379.x
- de Camargo MC, Barros BCA, Fulone I, et al. Adverse events in patients with rheumatoid arthritis and psoriatic arthritis receiving long-term biological agents in a real-life setting. Front Pharmacol. 2019;10:965. https://pubmed.ncbi.nlm.nih.gov/31572173/.
- Haagsma CJ, van Riel Pl, de Jong AJ, et al. Combination of sulphasalazine and methotrexate versus the single components in early rheumatoid arthritis: a randomized, controlled, double-blind, 52 week clinical trial. Br J Rheumatol. 1997 Oct;36(10):1082–1088. DOI:10.1093/rheumatology/36.10.1082.
- Jones G, Sebba A, Gu J, et al. Comparison of tocilizumab monotherapy versus methotrexate monotherapy in patients with moderate to severe rheumatoid arthritis: the AMBITION study. Ann Rheum Dis. 2010 Jan;69(1):88–96. DOI:10.1136/ard.2008.105197.
- Lee EB, Fleischmann R, Hall S, et al. Tofacitinib versus methotrexate in rheumatoid arthritis. N Engl J Med. Jun 19 2014;370(25):2377–2386. DOI:10.1056/NEJMoa1310476.
- Taylor PC, Keystone EC, van der Heijde D, et al. Baricitinib versus placebo or adalimumab in rheumatoid arthritis. N Engl J Med. Feb 16 2017;376(7):652–662. DOI:10.1056/NEJMoa1608345.
- Atif M, Sulaiman SA, Shafie AA, et al. Resource utilization pattern and cost of tuberculosis treatment from the provider and patient perspectives in the state of Penang, Malaysia. BMC Health Serv Res. Aug 19 2014;14:353. DOI:10.1186/1472-6963-14-353.
- Chen DY, Yu F, Tuan LW, et al. Comparison of healthcare utilization and costs between ra patients receiving biological and conventional synthetic DMARDs: a nationwide population-based cohort study in Taiwan. Front Pharmacol. 2019;10:1214.
- Dahlui M, Wan NC, Koon TS. Cost analysis of UMMC services: estimating the unit cost for outpatient and inpatient services. BMC Health Serv Res. 2012;12(Suppl 1):1–2.
- Jamsem E, Virta LJ, Hakala M, et al. The decline in joint replacement surgery in rheumatoid arthritisis associated with a concomitant increase in the intensity of anti-rheumatic therapy. Acta Orthop. 2013;84(4):331–337.
- Zhang W, Bansback N, Anis AH. Measuring and valuing productivity loss due to poor health: a critical review. Soc Sci Med. 2011 Jan;72(2):185–192. DOI:10.1016/j.socscimed.2010.10.026.
- Braakman-Jansen LM, Taal E, Kuper IH, et al. Productivity loss due to absenteeism and presenteeism by different instruments in patients with RA and subjects without RA. Rheumatology (Oxford). 2012 Feb;51(2):354–361.
- Goetzel RZ, Long SR, Ozminkowski RJ, et al. Health, absence, disability, and presenteeism cost estimates of certain physical and mental health conditions affecting U.S. employers. Journal of Occupational & Environmental Medicine. 2004 Apr;46(4):398–412. DOI:10.1097/01.jom.0000121151.40413.bd.
- Sruamsiri R, Mahlich J, Tanaka E, et al. Productivity loss of Japanese patients with rheumatoid arthritis - a cross-sectional survey. Mod Rheumatol. 2018 May;28(3):482–489. DOI:10.1080/14397595.2017.1361893.
- Lensberg BR, Drummond MF, Danchenko N, et al. Challenges in measuring and valuing productivity costs, and their relevance in mood disorders. Clinicoecon Outcomes Res. 2013;5:565–573.
- Anis A, Zhang W, Emery P, et al. The effect of etanercept on work productivity in patients with early active rheumatoid arthritis: results from the COMET study. Rheumatology (Oxford). 2009 Oct;48(10):1283–1289.
- Lee TJ, Park BH, Son HK, et al. Cost of illness and quality of life of patients with rheumatoid arthritis in South Korea. Value Health. 2012 Jan-Feb;15(1 Suppl):S43–9. DOI:10.1016/j.jval.2011.11.020.
- Lundkvist J, Kastang F, Kobelt G. The burden of rheumatoid arthritis and access to treatment: health burden and costs. Eur J Health Econ. 2008 Jan;8(Suppl 2):S49–60. DOI:10.1007/s10198-007-0088-8.
- Hamuryudan V, Direskeneli H, Ertenli I, et al. Direct and indirect healthcare costs of rheumatoid arthritis patients in Turkey. Clin Exp Rheumatol. 2016;34(6):1033–1037.
- Alten R, Kruger K, Rellecke J, et al. Examining patient preferences in the treatment of rheumatoid arthritis using a discrete-choice approach. Patient Prefer Adherence. 2016;10:2217–2228.
- Taylor PC, Betteridge N, Brown TM, et al. Treatment mode preferences in rheumatoid arthritis: moving toward shared decision-making. Patient Prefer Adherence. 2020;14:119–131.
- Edel Y, Sagy I, Pokroy-Shapira E, et al. A cross-sectional survey on the preference of patients with rheumatoid arthritis for route of administration of disease-modifying anti-rheumatic drugs: oral target-specific versus parenteral biologic. Isr Med Assoc J. 2020 Mar;22(3):154–159.
- Caswell H. Matrix population models. Vol. 1. Sunderland(MA): Sinauer Associates; 2000.
- Keyfitz N. On future population. J Am Stat Assoc. 1972 June 1;67(338):347–363.
- Liljas B. How to calculate indirect costs in economic evaluations. Pharmacoeconomics. 1998 Jan;13(1 Pt 1):1–7. DOI:10.2165/00019053-199813010-00001.