
 ?Mathematical formulae have been encoded as MathML and are displayed in this HTML version using MathJax in order to improve their display. Uncheck the box to turn MathJax off. This feature requires Javascript. Click on a formula to zoom.
ABSTRACT
Background: Gene replacement therapy (GRT) is a treatment method used to combat or prevent various diseases. Its high one-off cost constitutes a major obstacle for successful market access. This paper aims to assess and discuss the applicability of amortization in models, such as cost-effectiveness models (CEMs) and budget impact models (BIMs) informing HTA recommendations and reimbursement decisions.
Methods and findings: A hypothetical CEA and BIA were considered. The objective was to compare the GRT with and without amortization. A straight-line amortization model was used. The CEM and BIM were considered and assessed based on two set of scenarios: considering different amortization duration or different discounting rate. The impact of amortization against the total cost of gene therapy was assessed for all the scenarios.
The cost difference between GRT with and without amortization in relation to its total cost was -$58,855, thus amortization does not have a significant impact on the results and conclusions of the cost-effectiveness analysis. For BIM in the base case, amortization had no impact on the results.
Conclusion: Amortization has negligible impact on the results of CEM and total BIM and no impact on the conclusions from the model. One exception is the budget impact in case of an amortization period longer than the time horizon of BIM, where a half of the GRT price is moved beyond the model time horizon. Amortization has a distinguishing effect from an accounting perspective, but it does not have any implication for payers.
Introduction
Gene therapy
Gene therapy is a treatment method based on inserting fragments of genetic material into cells. Gene therapy is used to combat or prevent inherited diseases, treatment-resistant cancers, and viral infections [Citation1,Citation2]. The concept of gene therapy is to address a genetic problem at its source by replacing, fixing or turning-off mutated genes [Citation1]. One significant disadvantage of gene therapy is its high one-time cost [Citation2]. For example, betibeglogene autotemcel (Zynteglo®) for the treatment of beta-thalassemia is priced at - $2.8 million for a one-time administered single dose. Similarly, the cost of onasemnogene abeparvovec (Zolgensma®) is $2.125 million, and $3.5 million for etranacogene dezaparvovec (Hemgenix®). This has a very significant impact on already limited healthcare budgets. There are various highly effective and costly treatments on the market in many indications. However, many of these treatments are being used in the long-term in order to sustain the outcomes. Hence, also the high cost of therapy is split over the years. From the budgetary perspective, the biggest challenge related to financing any gene replacement therapy (GRT) is the high one-off cost. This challenge needs to be met, especially taking into account the increasing number of GRTs arriving on the market. One of the possible solutions is to address the budgetary impact from an accounting perspective by adopting amortization to healthcare. However, in contrast with the rapid development of GRTs, accounting guidelines may not change as rapidly. An important accounting issue is the realization of an expense over a long period of time that represents future benefits. Policy-makers may consider such an amortization-based methods to facilitate the affordability of GRTs significantly [Citation3].
Amortization
In accounting, amortization is where the costs of intangible assets are spread over a period of time. With this technique, an intangible asset can be written off, eventually covering the intangible asset’s full balance by the time it matures or at the end of an amortization period during which the entire principal is payable [Citation4]. In essence, the principal amount represents the entire value of the intangible asset, and the interest represents the fee imposed on the principal amount [Citation5,Citation6]. The interest to be paid will typically decrease over time as the total amount of outstanding principal decreases [Citation5,Citation6]. In this context, amortization refers to the ability to make payments according to an amortization schedule, often spread out throughout the asset’s useful life [Citation7]. Amortization is provided in accordance with generally accepted accounting principles (GAAP) and the International Financial Reporting Standards (IFRS).
The impact of applying amortization to the funding of GRTs and GRT assessment can be observed in its application in economic models, such as cost-effectiveness models (CEMs) and budget impact models (BIMs). These economic tools are commonly used by health authorities worldwide, specifically payers, to inform health technology assessment (HTA) recommendations, including reimbursement decisions.
CEM/BIM
A CEM is an analytical framework that combines data on various factors (e.g., resource consumption, expenditures, cost-savings, and others) in order to assess and compare the cost and benefits, mainly over a lifetime, associated with two or more interventions [Citation8]. The estimates of a CEM are utilized to produce incremental cost-effectiveness ratios (ICERs), which are then used by health authority decision-makers to determine which treatments represent good value for money. Financial decision tool important to the assessment of reimbursing and adopting highly costly therapies, such as GRTs, is a BIM. A BIM illustrates the cost implications related to the adoption of a new health-care intervention compared to the current situation before introducing this new intervention. Rarely is a BIM’s time horizon greater than five years, and occasionally it is only one year. BIM is an indispensable part of negotiating local reimbursement [Citation9]. It is a versatile and straightforward tool that aids decision-makers in comprehending the ramifications of adopting a new health technology.
As these models are heavily relied on to inform health authorities, it is of importance to better understand whether amortization of GRT funding has an impact on the results and/or conclusions of cost-effectiveness analyses (CEAs) and budget impact analyses (BIAs) of GRTs.
This paper aims to assess and discuss the implementation of amortization of GRT funding in CEMs and BIMs.
Methods
Models
A hypothetical model was created for the purpose of this exercise, in which the amortization of GRTs funding as implemented in a CEM and BIM. Further details about this model are provided later in the text.
Straight-line amortization
The straight-line amortization technique uses the same interest rate throughout the intangible asset’s whole amortization schedule up until the maturity date [Citation10]. The straight-line amortization model necessitates the predetermination of a number of components to be applied:
The cost of the GRT, which would stand in for the principal amount,
The amortization schedule, which consists of the number of payment periods (i.e., the payments that must be paid), and
the interest rate per period.
These components allow for the development and construction of a GRT amortization schedule that specifies payment intervals, the total payment amount (principal payment + interest payment) per period due, the interest payment per period due, the principal payment per period due, and the total amount owing per period due for GRT developers and payers to follow [Citation10]. Using the following equation, the payment amounts for the period in the amortization schedule can be determined [Citation11].
Where:
A – payment amount per period,
P – initial principal (cost of GRT),
r – interest rate per period,
n – total number # of payments or periods.
The amount of interest owed is determined by multiplying the initial sum by the interest rate of each period (r multiplied by previous balance). The previous balance for the first payment period is the cost of the GRT, with the remaining previous balances being the balance of the prior payment period.
Most GRT have been paid by payers through instalment payments over 5 years sometime 3 years. So the cash flow need is split over a number of years expected to match amortization period. Moreover in most countries GRT are funded ex-US by public payers who don’t have a cash flow constraint but a budget constraint. So paying the GRT up front is not an issue and amortization address the budget constraint.
So far health insurers are not using loans to pay quite expensive therapies and although it is a non-issue today it may become a question tomorrow. Loan has been considered as one of the options in the future for GRT but has not been used to the authors knowledge. For that reason we do not consider interest rate in ours analyses.
Base case & scenarios
The straight-line amortization was considered in the hypothetical CEA and BIA.
Regarding the CEM, the comparison of two interventions with the same health outcomes could be reduced to the assessment of costs i.e., the cheaper treatment is more cost-effective. Comparison of costs could be limited to the cost of the GRT as only this cost was impacted by amortization. Only two concepts present within the CEM framework could impact the cost of GRT in case amortization was applied: the discounting and the amortization duration.
The base case assumed 5 years of amortization and 3% discounting. In a hypothetical consideration, it was assumed that the cost of GRT with no amortization was $850,000.
Different scenarios around the amortization duration and the discounting rate were performed. The first batch of scenarios assumed a similar discount rate as in the base case (3%) while the values tested for amortization durations were: 3 years, 7 and 10 years. The second batch of scenarios considered a fixed 5-year amortization while the discount rates tested were 1%, 3%, and 7%. All the scenarios are summarized in the .
Table 1. Scenarios implemented.
BIM was considered for a single prevalent patient as well as for subsequent cohorts. In the initial cohort, 10 patients have been taken into account, whereas in the subsequent four years, 3 patient have been included each.
When it comes to the budget impact model, it’s typically recommended to exclude discounting because the budget holder is primarily focused on the anticipated impact at each individual moment in time. Only the batch of scenarios on amortization duration was therefore considered in the BIA.
Results
CEM
Incorporating amortization in the base case scenario led to a reduction from $850,000 to $791,145, corresponding to 6.9% of reduction in the drug cost ().
Table 2. CEM base case results.
The amortized costs of the GRT increased to $814,404 considering a 3-year instead of a 5-year amortization duration. In the same way, considering a longer amortization duration decreased the total costs: $768,773 considering 7 years and $736,796 considering 10 years. This was leading to the following cost differentials -$35,596, -$81,227, and -$113,204, for the scenarios A1, A2 and A3, respectively. The cost difference for scenarios B1 (1% discount rate), B2 (5% discount rate), and B3 (7% discount rate) were -$20,454, -$94,204, and -$126,810, respectively ().
In relation to base case, the cost difference decreased by 39.5% in scenario A1, while in scenarios A2 and A3, these differences increased by 38% and 92.3%, respectively. If we compare the scenarios related to the discounting rate with the base case, the cost difference decreased by 65.2% and increased by 60.1% and 115.5% respectively in scenarios B1, B2, and B3.
BIA
The first cohort
In the base case scenario, there is no disparity in the overall costs between including amortization or not. The discrepancy arises in the first year, with a value of -$680,000, whereas in the subsequent four years, the difference amounts to $170,000. In scenario A1, the total costs remain identical after a period of 5 years. The cost discrepancies are noticeable in scenarios A2 and A3, and those differences are -$242,857.14 and -$425,000, respectively (.
Table 3. CEM scenarios results.
Table 4. Total budget impact results for base case and scenarios A1-A3.
The subsequent cohort
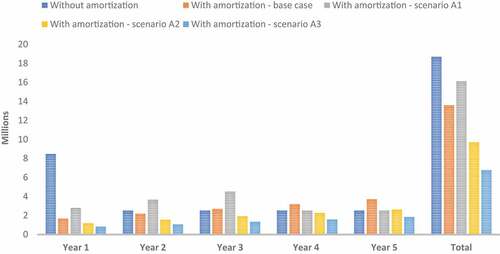
As the amortization period increases, the total cost decreases. In the base case, the disparity in BIM amounted $5,100,000, leading to a reduction of cost by 27%. The application of scenarios A1, A2, and A3 resulted in significant cost savings for the BIM when accounting for amortization. Specifically, the total cost of BIM was reduced by 14%, 48%, and 64% for scenarios A1, A2, and A3, respectively. ()
Figure 1. Total BIM results by year.
Discussion
Summary
It was visible in the CEM that the disparities between the cost of drugs with and without amortization became more evident as the amortization period was extended. A similar trend was discernible when the amortization discount rate was heightened.
Where BIM was associated with one prevalent patient, it was noticeable that when the amortization period was shorter than the time horizon, it did not have any impact on the total budget. It could also be observed that extending the amortization period beyond five years leads to a reduction in the budget. This was due to the fact that any time beyond the five-year timeframe was not factored into the calculation. This phenomenon was illustrated by scenarios A2 and A3.
Expanding BIM to encompass multiple cohorts has facilitated the observation of noteworthy correlations. A discrepancy of $5,100,000 in BIM was evident when comparing the base case, which was not discernible in prevalent patient. As the amortization period increased, there was a noticeable increase in the difference of BIM, particularly in scenarios A2 and A3 (around 9 M and 12 M, respectively).
Since the prevalent pool of patients was larger than the incident pool of patients, amortization allowed for a smoother distribution of the budget over time. However, once the amortization of the prevalent patient pool was complete, amortization no longer had any impact on the annual budget, assuming a stable population. This was evident in scenario A1, where the total cost with amortization in the 4th and 5th years was equivalent to the cost without amortization.
For the years withing the amortization period of the prevalent patients, the costs were spread over the years. When considering a 3-year amortization period, the total cost over the first three years was more stable than when no amortization was taken into account.
Different type of amortization
Well-known amortization methods include the declining balance method, the annuity method, the bullet method, the balloon method, and the increasing balance method. As an accelerated method, the declining balance technique makes bigger payments in the first few years of the amortization schedule and lesser payments in the following years until the maturity date is reached and the debt is repaid [Citation4,Citation6]. The annuity method is well-known since it determines the internal rate of return as well as the rate of return on the asset as an investment [Citation12]. The amortization of the balloon and bullet approaches typically does not span the entire amortization period. The bullet payment has only interest payments made over the course of the amortization plan, with the entire principal balance payable in a single, final ‘bullet’ payment [Citation12]. Given that a significant payment is required, the balloon approach and the bullet method are relatively similar. The balloon method, on the other hand, differs in that it has the possibility to incorporate smaller installment payments before the substantial ‘balloon’ payment, which serves as the substantial principal balance payment concluding the entire payment [Citation13,Citation14]. The increasing balance method, commonly referred to as negative amortization, is the final type of amortization method [Citation14]. This approach combines the outstanding principal sum and unpaid interest, increasing the total amount owed. Therefore, with a negative amortization technique, the principal amount of the loan will be increased by the unpaid interest [Citation14].
Several of the aforementioned techniques may not be the greatest for facilitating market access and patient access to GRTs when deciding which type of amortization method would be most suitably implemented for the amortization of GRTs. If the declining balance method was linked to the results, it could be enticing. The value of a GRT may increase with higher payments since it may offer greater advantages in the initial years. This would only be true if it was assumed that GRTs are provided promptly and result in immediate advantages after administration and gradually wane over time. Ultimately, the intricacy of incorporating the unknown efficacy lifetime into a declining amortization method may prove too difficult. The annuity method may also prove to be too challenging to begin amortizing GRTs because it needs the calculation and assessment of the asset’s rate of return. While technically allowing for the spreading out of GRT acquisition payments over time, the remaining three methods – the bullet method, the balloon method, and the increasing balance method – are all arguably inappropriate for the amortization of GRTs. It is because they all demand astronomically high payments by the amortization schedule’s maturity date and, which would defeat the goal of spreading out the GRT acquisition payments.
Employing the straight-line method for the amortization of GRTs does not pose a significant constraint, given its simplicity and the consistent trend alignment observed in other methods.
Is GRT tangible or intangible asset?
GRT must be classified as an asset under GAAP and IFRS [Citation3]. It should be assumed that GRT is a tangible or intangible asset. Regarding healthcare, GRTs, as its tangible products, are considered as consumables rather than assets. This is due to the fact that it is depleted after a single use [Citation4]. Therefore, according to GAAP, consumables must be included in the balance sheet of the year in which they were purchased. The question of when and how GRTs are paid for a certain number of years is irrelevant in this case since installment or one-off payments are recognized as an expense in the same year they were used. It is also possible to consider GRT as an intangible asset or an indicator of health benefits rather than a physical product.
Both intangibles assets and GRTs are intangible in nature, with GRTs having intangible health benefits manifesting in patients receiving the product. The benefits of GRT can be said to be physically measurable and tangible. However, it is important to realize that the benefits of GRT for one patient are not transferable to other patients, and the outcomes measured in clinical trials are often an estimate of health benefits of the treatment. The problem is further complicated by the fact that GRT aims to replace and correct disease-causing genes. Complications arise because the ultimate goal of GRT is to cure rare and severe genetic diseases by eliminating the underlying disease causation. The question then becomes, how is ‘cure’ measured? or, more specifically, how is ‘cure’ measured as a result of clinical trials? What are the outcome measures that will allow for the measurement of the curative, if not lifelong, long-term benefits of such innovative therapies for patients? Neither GRT developers nor payers can afford long-term monitoring of complex outcomes that span a patient’s lifetime or even decades. Therefore, alternative outcomes must be employed that demonstrate the unique and innovative benefits that GRTs can potentially provide. Such benefits are therefore intangible because they cannot be transferred, maintained or extended in a particular patient or between patients.
In addition, other important similarities can be found between GRTs and intangible assets. They represent a high value due to their degree of benefit and their ability to meet essential needs. Their value increases with use. Additionally, they have a finite life, and their benefits are delivered over their lifetime. In fact, the notion that GRTs and all non-capital healthcare technologies in general are intangible is reflected in the payers’ rationale in decision-making and purchasing healthcare technologies based on the quantity (e.g., life-years) and quality (e.g., health-related quality of life) of the health benefits provided. Value-based pricing procedures implemented in numerous known and developing healthcare systems provide strong support for this idea.
A GRT must be classified in accordance with GAAP in order for it to be amortizable from an accounting standpoint. The Financial Accounting Standards Board (FASB) and the Governmental Accounting Standards Board (GASB) jointly created the US GAAP, a comprehensive set of accounting standards that are used for both governmental and non-profit organization accounting. As a result, the GRT must first be categorized as an asset in order for it to be eligible for amortization under GAAP. Given the similarities between GRTs and intangible assets described above, we suggest that it is required to categorize GRTs as an intangible asset that is realistically and adequately eligible for amortization, as well as one for which the expenses can be written off (i.e., expensed) on a payer’s balance sheet.
The analysis conducted relied on fictional data. To enhance the comprehensive nature of the discussed topic, authors recommend performing the analysis using real data.
Disclosure statement
No potential conflict of interest was reported by the author(s).
References
- Hampson G, Towse A, Pearson SD, et al. Gene therapy: evidence, value and affordability in the US health care system. J Comp Eff Res. 2018;7(1):15–7. doi: 10.2217/cer-2017-0068
- Pochopień M, Paterak E, Clay E, et al. An overview of health technology assessments of gene therapies with the focus on cost-effectiveness models. J Mark Access Health Policy. 2021;9(1):2002006. doi: 10.1080/20016689.2021.2002006
- Dabbous M, Toumi M, Simoens S, et al. Amortization of gene replacement therapies: a health policy analysis exploring a mechanism for mitigating budget impact of high-cost treatments. Health Policy. 2022;126(1):49–59. doi: 10.1016/j.healthpol.2021.11.005
- Mueller JM. Amortization of certain intangible assets. J Account. 2004. https://www.journalofaccountancy.com/issues/2004/dec/amortizationofcertainintangibleassets.html
- Lessambo FL, Financial statements: analysis and reporting. 2018.
- Petrino RJ, et al. Accounting Trends and Techniques. New York: American Institute of Certified Public Accountants; 2011.
- CFI ,Capital Expenditures , 2022 https://corporatefinanceinstitute.com/resources/accounting/capital-expenditure-capex/.
- Musgrove P, J F-R. Disease control priorities in developing countries. chapter 15: cost-effectiveness analysis for priority setting. New York: Oxford University Press; 2006.
- HERC. Budget impact analysis. 2021. https://www.herc.research.va.gov/include/page.asp?id=budget-impact-analysis
- Kimmel PD, Weygandt JJ, Kieso DE. Accounting: tools for business decision making. Hoboken, NJ: Wiley; 2009.
- Fontinelle A. What is Amortization? 2022.
- Greer GE, Kolbe PT. Investment analysis for real estate decisions. Chicago: Dearborn Real Estate Education; 2003.
- Mothibi G. An assessment of car buyers’ understanding of balloon payment method in relation to the national credit act in South Africa. J Law Policy Glob. 2015;35:1–9.
- Quercia RG, Stegman MA, Davis WR. The impact of predatory loan terms on subprime foreclosures: the special case of prepayment penalties and balloon payments. Hous Policy Debate. 2007;18(2):311–346. doi: 10.1080/10511482.2007.9521603