
 ?Mathematical formulae have been encoded as MathML and are displayed in this HTML version using MathJax in order to improve their display. Uncheck the box to turn MathJax off. This feature requires Javascript. Click on a formula to zoom.
ABSTRACT
ESG (Environmental, social, and corporate governance) parameters are involved in investing-related decision-making. DESG (Dominantly ESG) related investing represents a complex tasks studied under severe information shortages. NESG (Non-dominantly ESG) investing either ignores ESG parameters completely or it takes it as less important. ESG investing is partially DESG and partially NESG. A very simple fuzzy reasoning algorithm is used to find out the similarity between DESG and NESG in this paper. A similarity graphs is generated. An edge represents a fuzzy similarity between two nodes / conditional statements. Each statement specifies fuzzy conditions under which some DESG/NESG tools are mutually similar or totally dissimilar. Examples of investing tools are Developed Markets, Emerging Markets Small Caps, Sustainability Index and Environmental Social Governance Index. The following five parameters of investing tools are Risk, Cost, Return, Drop, and Correlation. Low pairwise fuzzy similarities between DESG and NESG are detected.
1. Introduction
A broad spectrum of different models of investing decisions under different objective functions exist, see, e.g. Andersen et al. (Citation2015) and Stermole and Stermole (Citation2006). Many investors make their investment decisions only on the basis of different versions of financial criteria. However, for an increasing number of investors, this is not enough (Ballestero et al. Citation2012).
Standard finance theory suggests that when two portfolios yield identical returns, an investor will be indifferent between investing in either one, see Dam and Heijdra (Citation2011). Investors could recognize the positive effect on future cash flows created by enlightened managers, see Whittaker (Citation2011). This leads to a strengthening of ethical management, see Ballestero et al. (Citation2012) and Ortas and Moneva (Citation2013).
DESG investing represents a complex and multidimensional task studied under severe information shortages. DESG time series are usually short. More and more sophisticated methods, e.g. applied artificial intelligence – fuzzy and rough sets, are therefore used to extract useful items of information, which cannot be analysed by conventional statistical methods, see, e.g. Aboura and Chevallier (Citation2017) and Ahi, Searcy, and Jaber (Citation2018) and Mohammed (Citation2021).
Any currently active investor has to contra-balance DESG versus NESG. This makes any feasible investing more problematic. An inevitable shortage of information items results in desperate attempts to extract all relevant data sets from the available information/knowledge. This leads to more and more sophisticated algorithms, see, e.g. Bilbao-Terol et al. (Citation2016) and Escrig-Olmedo et al. (Citation2017).
There are very few studies on non-professional DESG investors. However, this segment is gradually growing (Hafenstein and Bassen Citation2016; Mousavi and Ouenniche Citation2018).
A simple formal method(s) must available to support decisions and not ignore information/knowledge items, which are (in)directly hidden within available (semi) subjective information inputs. Unfortunately, these algorithms are not available in a form of user’s friendly software systems, see, e.g. Parsons and Dohnal (Citation1992) and Vesely, Klöckner, and Dohnal (Citation2016). Moreover, mathematical/logical/artificial intelligence-based theories are often out of reach of investors who are not mathematicians. ESG-oriented investor has no intention of going into mathematical details. Therefore, the simplicity of used formal tools is inevitable.
In addition, any investor requires transparency of formal reasoning. Investors want to use simple common sense to reach similar conclusions as these reached by applied formal theories. Therefore, simple and consequently transparent algorithms must be used to support ESG investing decisions (Weston and Nnadi Citation2021).
AI (Artificial Intelligence) has developed a large number of formal tools, see, e.g. Elliott (Citation2021) and Gao et al. (Citation2021). Frequently used tools are neural networks, genetic algorithms, vague reasoning (fuzzy, qualitative, semi-qualitative, rough, and probabilistic), neural networks and genetic algorithms. Artificial intelligent systems, e.g. common sense reasoning and fuzzy/rough sets genetic algorithm are used to utilize such available vague information/knowledge items, which cannot be treated by, e.g. classical statistical and numerically oriented algorisms.
2. ESG common sense
Simple, straightforward and easily understandable common sense algorithms, of different natures, represent a significant advantage, see, e.g. Miller et al. (Citation2013). ESG experts, especially at the very beginning of any analysis/decision making, do not use mathematical/formal models as the basic framework for their reasoning. ESG experts and/or investors draw heavily on knowledge represented by common sense, see, e.g. Bredeweg and Salles (Citation2009) and Forbus (Citation1996).
One of the most important features of human thinking is the ability to extract, from a huge collection of masses of heterogeneous data/knowledge sets, only such items of knowledge that are relevant to the task at hand (Dohnal Citation1991). Moreover, the goal of this study is to examine some factors that influence the use of sustainable investing in sustainable companies by non-professional ESG investors (Hafenstein and Bassen Citation2016).
Complex DESG decisions are information poor, see, e.g. Blasi, Caporin, and Fontini (Citation2018). Different datasets are constructed by merging different data sources. The resulting set is usually very heterogeneous. DESG is an evolving concept that is, by its nature, ambiguous, uncertain and imprecise, see, e.g. Lamata, Liern, and Pérez-Gladish (Citation2018).
To determine the cost of each investment instrument, as well as the scaling of risk and return variables, data from Morningstar inc. (“Morningstar. and Empowering Investor Success” Citation2021) and, as a supplement (taking into account the requirements of the EU legislative framework for investment products intended for private investors), data from financial servers covering mainly ETF financial products traded on European exchanges were used. These servers are www.justetf.com and www.extra-funds.de, which provide an overview of the costs of individual investment funds or ETFs and also categorise these costs, including by asset class or by sector or geography.
The parameters of investment instruments meeting the ESG criteria have been established on the basis of the methodologies provided by MSCI and S&P. Time series for each index was also used from both of these companies, including for determining the return, risk, downside and also correlations (Pearson correlation).
The MSCI World ESG Universal Index was chosen as a proxy for general ESG stocks. Environmental data were used based on MSCI information and methodology (“MSCI ESG Indexes” Citation2021)
Data for water stocks were used based on the S&P information and methodology (“S&P Global Water Index. S&P Dow Jones Indices” Citation2021) and (“Core ESG – Indices. S&P Dow Jones Indices” Citation2021). The S&P Global Water Index (“S&P Global Water Index. S&P Dow Jones Indices” Citation2021) was selected as a specific proxy.
This is the key reason why experts do not use numbers to quantify studied DESG/NESG relations. Quantifiers based on numbers are prohibitively information intensive and therefore not applicable to many DESG decisions. Precisely defined and easily measurable quantification units, as, e.g. kg, m, sec, are not available for DESG/NESG tasks. This is another important reason why numbers as quantificators cannot be easily used.
DESG investing is an interdisciplinary task, see . It means that a heterogeneous team of experts must be engaged. This fact makes the DESG decisions even more difficult. Examples of DESG issues are given below.
Table 1. DESG issues.
The above-mentioned DESG related features indicate that the most information-intensive numerical quantification is not the best variant. However, DESG tasks are not so information poor to justify the least information quantifications, i.e. trends – positive/increasing, zero/constant, negative/decreasing (Dohnal Citation2016; Doubravsky and Dohnal Citation2018). Therefore, medium information-intensive quantifiers are used in this paper. This is the reason why fuzzy sets are introduced, see, e.g. Prato (Citation2007) and Remig (Citation2015).
2.1. Simple fuzzy multidimensional reasoning
Ancient philosophers understood classical problems related to, e.g. definition of a bald head – how many hairs may have a bald head. There is a clear gradual transition from bald to no-bald as the total number of hairs is increasing, see, e.g. Dubois (Citation2014) and Gaines (Citation1976).
The concept of fuzzy sets was introduced relatively recently (Zadeh Citation1965). However, fuzzy logic is a relatively well established formal tool, see, e.g. Dubois et al. (Citation2014) and Dubois, Fargier, and Guyonnet (Citation2013). In its most basic sense, a fuzzy set is a set where objects have a gradual transition from membership to non-membership, see, e.g. Kaufmann (Citation1975).
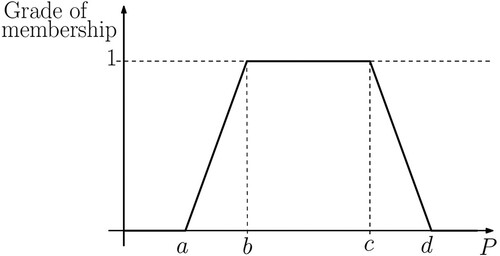
A linguistic value is a value that is given by words, e.g. High, Low, Medium, Approximately 5. A linguistic value is transformed into a fuzzy set by the specification of a grade of membership. For example, a Medium Profit is transferred into a fuzzy set by the grade of membership function given in .
Figure 1. Fuzzy set Medium Profit P – Grade of membership function.
There are many different fuzzy reasoning, see, e.g. Dubois and Prade (Citation1997). Unfortunately, the majority of the published reasoning algorithms is prohibitively complex and not suitable for routine applications of ECG experts, see, e.g. Armengol, Dellunde, and García-Cerdaña (Citation2016).
A typical medium profit P, see :
(1)
(1) The Profit P (1) belongs to the fuzzy set Medium with the grade of membership equals 1.
(2)
(2) where P is the profit, index M is Medium and μ is the grade of membership. There are two fuzzy intervals, namely
(3)
(3) The intervals (3) represent profits P that belong to the fuzzy set Medium partially.
A real number is represented by a special fuzzy grade of membership where
(4)
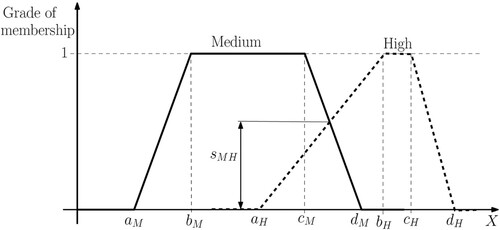
(4) There are different definitions of fuzzy similarities of two fuzzy sets for the same variable, see, e.g. Radhakrishna et al. (Citation2018). The simplest possible definition of a similarity s of the fuzzy sets Medium (M) and High (H) for the variable P is demonstrated by .
(5)
(5) A fuzzy model, as it is used in this paper, is a set of m n-dimensional conditional statements:
(6)
(6) where sets Ai,j, for i = 1,2, … , m and j = 1,2, … , n, are fuzzy sets, see . They can be easily specified or/and modified using the relevant points a, b, c, d (see ). The evaluation of fuzzy sets A is a task for a team of experts. Unfortunately, it is partially subjective.
Figure 2. Graphical definition of fuzzy similarity s.
2.2. Similarities graphs
The similarity (5) is a one-dimensional similarity, i.e. a similarity based on profit P. However, a multidimensional similarity quantifies the similarity of the multidimensional set, e.g. similarity of two n-dimensional fuzzy sets Ω1 and Ω2.
(7)
(7) There are n one-dimensional similarities
(8)
(8) The n-dimensional similarity λ1, 2 of two n-dimensional fuzzy sets Ω1 and Ω2 is
(9)
(9) The similarity of the first two A segments of the conditional statements (8) can be easily modified for similarity of any pair of A segments of vth and wth statements svw.
A similarity graph G is an oriented graph. It has m nodes. Its edgiest are pairwise similarities λ. Each similarity λ represents an edge leading from node v to node w.
3. Results and discussion
A team of experts and PhD students developed the fuzzy model using traditional methods of knowledge bases for fuzzy expert systems. This model was one of the outputs of the research with the title of Modelling and simulation of sustainable investing decision-making (registration No. 17-23448S), which was supported by the Czech Science Foundation. The model is five dimensional, n = 5, and there are 17 statements, m = 17 (6).
There are chosen 17 investing’s tools, two of them are bonds indices and the rest equity indices, see . The single stock index follows a unique investing strategy, such as focusing on small stock companies, companies with small fluctuations of their equity, or strategies focusing on the specific industry sector ().
Table 2. List of investing’s tools.
Table 3. Variables used to characterise the investing tools.
Each investing tool, see , has the following fuzzy descriptions, see .
Table 4. Set of statements.
The dictionaries used in are given in .
Table 5. Fuzzy dictionaries, see and and .
The results, see , were based on interviews with experts from Assets Management of financial institutions, investment companies and banks (Patria Finance, Erste Premier, KBC, Societe General), and previous research was also taken into account, see, e.g. Bilbao, Parra, and Cañal-Fernández (Citation2012) and Kocmanova et al. (Citation2017). Unfortunately, some fuzzy sets are very fuzzy. It means that the range of the relevant interval a–d is large. This high level of fuzziness reflects the fact that the experts were not able to reach a meaningful consensus.
All non-zero pairwise similarities λ (9) are given in . For example, statement No. 2 is similar to statements 3 and 17. It means that BOE is similar to CF and CEI. Both similarities are the same 0.267.
Table 6. Pairwise similarities, zero similarities are not given.
The similarity graph G, based on , is given in . There are just two investing tools DESG, namely WAT, statement No. 10, and ESGI, statement No. 14. Both, see and .
Figure 3. The similarity graph based on the 17 statements, see .
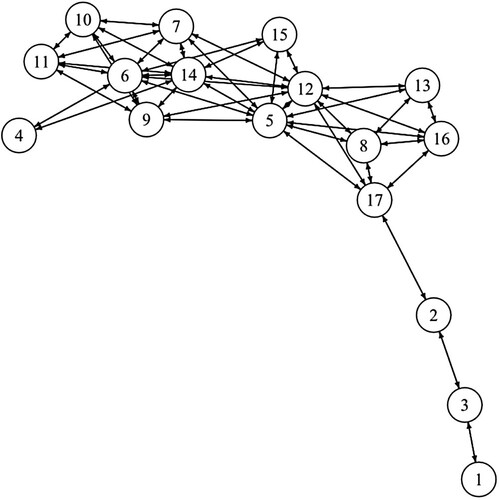
The non-zero similarities of WAT, ESGI and the rest of the investing tools are given in . The most similar investing tool to DESG is the INF tool. The fuzzy similarity λ (9) is 0.9. This is a surpassingly high similarity.
Table 7. Similarities of WAT and ESGI.
The investing tools with no fuzzy DESG equivalent are given in .
Table 8. Investing tools without DESG equivalent.
A trivial investor interpretation of is simple – ESG features are not supported by the tools given in . is not based on deep knowledge. It is based exclusively on a partially subjective fuzzy model. Any change of the fuzzy model can lead to modification of and .
4. Conclusion
The concept of Socially Responsible Investing and related tasks is known since 1960. Ethical Investing and some other similar approaches arose from the mid twentieth-century political climate of social awareness for the environment, etc.
Real investing processes are complex, integrated, ill known and nearly always difficult to observe in their ECG and macroeconomic environments. They may be subject to complex relations with their surroundings which may make it nearly impossible to isolate them without substantial distortion of the available knowledge.
Therefore, knowledge of such processes is inconsistent, sparse and uncertain and represented by different formal calculi and consequently by different quantifiers. A general strategy for dealing with investing knowledge is to modify it as little as possible, thus reducing information loss.
The presented approach is only one out of many possible modifications. To accommodate flexibly all features of realistic investing problem, an ad hoc fuzzy modification must be implemented. Unfortunately, there is no general methodology as to how to invent the best possible formalization of fuzzy knowledge.
If fuzzy knowledge is to be used in realistic investing complex tasks, it must be heterogeneous. This will inevitably require the integration of many different kinds of knowledge. Therefore, a flexible structure of interrelated sub-models of different nature (fuzzy, qualitative, semi qualitative, rough, conventional) is needed, see, e.g. Parsons and Dohnal (Citation1995).
Realistic applications of information non-intensive calculi, as fuzzy mathematics, require:
maximal utilization of the conventional methods – development of mixed models,
suitable integration of fuzzy and classical calculi 0 software – user friendly – man-computer interface – graphic presentation of final results – flexible interface between numerical and fuzzy representation top object experts and top knowledge engineers,
common sense retrospective analysis of each step It is not clear how to create the best network of different calculi (fuzzy, rough, etc.) to revitalize knowledge.
On the basis of experts’ claims, it can be concluded that most similarity is shown by those stock indexes that are in line with usable investing.
The characteristics of these indices are so different that they cannot be replaced by other indices (or combinations of other indices). According to the expert’s claims, these equity indices are an interesting alternative to index investing in capitalization-weighted indices. Based on comparisons over the past 10 years, these companies have shown higher returns with less risk of fluctuations.
Disclosure statement
No potential conflict of interest was reported by the author(s).
Additional information
Funding
References
- Aboura, Sofiane, and Julien Chevallier. 2017. “A New Weighting-Scheme for Equity Indexes.” International Review of Financial Analysis 54 (November): 159–175. doi:10.1016/j.irfa.2016.11.004.
- Ahi, Payman, Cory Searcy, and Mohamad Y. Jaber. 2018. “A Quantitative Approach for Assessing Sustainability Performance of Corporations.” Ecological Economics 152 (October): 336–346. doi:10.1016/j.ecolecon.2018.06.012.
- Andersen, Torben G., Oleg Bondarenko, Viktor Todorov, and George Tauchen. 2015. “The Fine Structure of Equity-Index Option Dynamics.” Journal of Econometrics: Econometric Analysis of Financial Derivatives 187 (2): 532–546. doi:10.1016/j.jeconom.2015.02.037.
- Armengol, Eva, Pilar Dellunde, and Àngel García-Cerdaña. 2016. “On Similarity in Fuzzy Description Logics.” Fuzzy Sets and Systems, Special Issue in Honor of Francesc Esteva on the Occasion of his 70th Birthday 292 (June): 49–74. doi:10.1016/j.fss.2015.11.021.
- Ballestero, Enrique, Mila Bravo, Blanca Pérez-Gladish, Mar Arenas-Parra, and David Plà-Santamaria. 2012. “Socially Responsible Investment: A Multicriteria Approach to Portfolio Selection Combining Ethical and Financial Objectives.” European Journal of Operational Research 216 (2): 487–494. doi:10.1016/j.ejor.2011.07.011.
- Bilbao-Terol, Amelia, Mar Arenas-Parra, Verónica Cañal-Fernández, and Mariano Jiménez. 2016. “A Sequential Goal Programming Model with Fuzzy Hierarchies to Sustainable and Responsible Portfolio Selection Problem.” Journal of the Operational Research Society 67 (10): 1259–1273. doi:10.1057/jors.2016.33.
- Bilbao, Amelia, Mar Parra, and Verónica Cañal-Fernández. 2012. “Selection of Socially Responsible Portfolios Using Goal Programming and Fuzzy Technology.” Information Sciences 189 (April): 110–125. doi:10.1016/j.ins.2011.12.001.
- Blasi, Silvia, Massimiliano Caporin, and Fulvio Fontini. 2018. “A Multidimensional Analysis of the Relationship Between Corporate Social Responsibility and Firms’ Economic Performance.” Ecological Economics 147 (May): 218–229. doi:10.1016/j.ecolecon.2018.01.014.
- Bredeweg, Bert, and Paulo Salles. 2009. “Qualitative Models of Ecological Systems — Editorial Introduction.” Ecological Informatics.” Special Issue: Qualitative Models of Ecological Systems 4 (5–6): 261–262. doi:10.1016/j.ecoinf.2009.10.001.
- “CFA Institute.”. 2021. https://www.cfainstitute.org/.
- “Core ESG – Indices. S&P Dow Jones Indices.” 2021. Accessed December 10. https://www.spglobal.com/spdji/en/index-family/esg/core-esg/#overview.
- Dam, Lammertjan, and Ben J. Heijdra. 2011. “The Environmental and Macroeconomic Effects of Socially Responsible Investment.” Journal of Economic Dynamics and Control, Growth, Dynamics, and Economic Policy: Special JEDC Issue in Honor of Stephen J. Turnovsky 35 (9): 1424–1434. doi:10.1016/j.jedc.2011.05.005.
- Dohnal, Mirko. 1991. “A Methodology for Common-Sense Model Development.” Computers in Industry 16 (2): 141–158. doi:10.1016/0166-3615(91)90086-O.
- Dohnal, Mirko. 2016. “Complex Biofuels Related Scenarios Generated by Qualitative Reasoning Under Severe Information Shortages: A Review.” Renewable and Sustainable Energy Reviews 65 (November): 676–684. doi:10.1016/j.rser.2016.07.029.
- Doubravsky, Karel, and Mirko Dohnal. 2018. “Qualitative Equationless Macroeconomic Models as Generators of All Possible Forecasts Based on Three Trend Values—Increasing, Constant, Decreasing.” Structural Change and Economic Dynamics 45 (June): 30–36. doi:10.1016/j.strueco.2018.01.001.
- Dubois, Didier. 2014. “On Various Ways of Tackling Incomplete Information in Statistics.” International Journal of Approximate Reasoning, 55 (7): 1570–1574. doi:10.1016/j.ijar.2014.04.002.
- Dubois, Didier, Helene Fargier, Meissa Ababou, and Dominique Guyonnet. 2014. “A Fuzzy Constraint-Based Approach to Data Reconciliation in Material Flow Analysis.” International Journal of General Systems 43 (8): 787–809. doi:10.1080/03081079.2014.920840.
- Dubois, Didier, Helene Fargier, and Dominique Guyonnet. 2013. “Data Reconciliation Under Fuzzy Constraints in Material Flow Analysis.” In Proceedings of the 8th Conference of the European Society for Fuzzy Logic and Technology (EUSFLAT-13), 25–32. Atlantis Press. doi:10.2991/eusflat.2013.4.
- Dubois, Didier, and Henri Prade. 1997. “The Three Semantics of Fuzzy Sets.” Fuzzy Sets and Systems 90 (2): 141–150. doi:10.1016/S0165-0114(97)00080-8.
- Elliott, Anthony. 2021. The Routledge Social Science Handbook of AI. Abingdon: Routledge.
- Escrig-Olmedo, Elena, Juana María Rivera-Lirio, María Jesús Muñoz-Torres, and María Ángeles Fernández-Izquierdo. 2017. “Integrating Multiple ESG Investors’ Preferences into Sustainable Investment: A Fuzzy Multicriteria Methodological Approach.” Journal of Cleaner Production 162 (September): 1334–1345. doi:10.1016/j.jclepro.2017.06.143.
- Forbus, Kenneth D. 1996. “Qualitative Reasoning.” CRC Handbook of Computer Science and Engineering. https://www.scholars.northwestern.edu/en/publications/qualitative-reasoning.
- Gaines, B. R. 1976. “Foundations of Fuzzy Reasoning.” International Journal of Man-Machine Studies 8 (6): 623–668. doi:10.1016/S0020-7373(76)80027-2.
- Gao, Xiao-Zhi, Rajesh Kumar, Sumit Srivastava, and Bhanu Pratap Soni. 2021. “Applications of Artificial Intelligence in Engineering.” Proceedings of First Global Conference on Artificial Intelligence and Applications (GCAIA 2020). Springer Nature.
- Hafenstein, Andrea, and Alexander Bassen. 2016. “Influences for Using Sustainability Information in the Investment Decision-Making of Non-Professional Investors.” Journal of Sustainable Finance & Investment 6 (3): 186–210. doi:10.1080/20430795.2016.1203598.
- Kaufmann, Arnold. 1975. Introduction to the Theory of Fuzzy Subsets. Cambridge: Academic Press.
- Kocmanova, Alena, Marie Pavlakova Docekalova, Nataļja Lāce, and Petr Nemecek. 2017. “Environmental, Social, Governance and Economics Model of a Company’s Sustainable Development as a Base for Investment Decision Making.” The 21st World Multi-Conference on Systemics, Cybernetics and Informatics (WMSCI 2017): Proceedings. Vol. 2, 7–12. https://ortus.rtu.lv/science/en/publications/26648.
- Lamata, Maria Teresa, Vicente Liern, and Blanca Pérez-Gladish. 2018. “Doing Good by Doing Well: A MCDM Framework for Evaluating Corporate Social Responsibility Attractiveness.” Annals of Operations Research 267 (1): 249–266. doi:10.1007/s10479-016-2271-8.
- Miller, Tan, Emmanuel Peters, Vijay Gupta, and Oduntan Bode. 2013. “A Logistics Deployment Decision Support System at Pfizer.” Annals of Operations Research 203 (1): 81–99. doi:10.1007/s10479-010-0775-1.
- Mohammed, Husam Jasim. 2021. “The Optimal Project Selection in Portfolio Management Using Fuzzy Multi-Criteria Decision-Making Methodology.” Journal of Sustainable Finance & Investment. doi:10.1080/20430795.2021.1886551.
- “Morningstar. Empowering Investor Success.” 2021. Accessed December 10. https://www.morningstar.com/.
- Mousavi, Mohammad Mahdi, and Jamal Ouenniche. 2018. “Multi-Criteria Ranking of Corporate Distress Prediction Models: Empirical Evaluation and Methodological Contributions.” Annals of Operations Research 271 (2): 853–886. doi:10.1007/s10479-018-2814-2.
- “MSCI ESG Indexes”. 2021. Accessed December 10. https://www.msci.com/our-solutions/indexes/esg-indexes.
- Ortas, Eduardo, and José M. Moneva. 2013. “The Clean Techs Equity Indexes at Stake: Risk and Return Dynamics Analysis.” Energy 57 (August): 259–269. doi:10.1016/j.energy.2013.03.046.
- Parsons, Simon, and Mirko Dohnal. 1992. “Qualitative, Semiqualitative and Interval Algebras, and Their Application to Engineering Problems.” Engineering Applications of Artificial Intelligence 5 (6): 553–559. doi:doi:10.1016/0952-1976(92)90031-E.
- Parsons, Simon, and Mirko Dohnal. 1995. “The Qualitative and Semiqualitative Analysis of Environmental Problems.” Environmental Software 10 (2): 75–85. doi:10.1016/0266-9838(95)00008-9.
- Prato, Tony. 2007. “Assessing Ecosystem Sustainability and Management Using Fuzzy Logic.” Ecological Economics 61 (1): 171–177. doi:10.1016/j.ecolecon.2006.08.004.
- Radhakrishna, Vangipuram, Shadi A. Aljawarneh, P. V. Kumar, and V. Janaki. 2018. “A Novel Fuzzy Similarity Measure and Prevalence Estimation Approach for Similarity Profiled Temporal Association Pattern Mining.” Future Generation Computer Systems 83 (June): 582–595. doi:10.1016/j.future.2017.03.016.
- Remig, Moritz C. 2015. “Unraveling the Veil of Fuzziness: A Thick Description of Sustainability Economics.” Ecological Economics 109 (January): 194–202. doi:10.1016/j.ecolecon.2014.11.016.
- “S&P Global Water Index. S&P Dow Jones Indices.” 2021. Accessed December 10. https://www.spglobal.com/spdji/en/indices/esg/sp-global-water-index/#overview.
- Stermole, Franklin J., and John M. Stermole. 2006. Economic Evaluation and Investment Decision Methods. Denver: Investment Evaluations Corporation.
- Vesely, Stepan, Christian A. Klöckner, and Mirko Dohnal. 2016. “Predicting Recycling Behaviour: Comparison of a Linear Regression Model and a Fuzzy Logic Model.” Waste Management (New York, N.Y.) 49 (March): 530–536. doi:10.1016/j.wasman.2015.12.025.
- Weston, Piers, and Matthias Nnadi. 2021. “Evaluation of Strategic and Financial Variables of Corporate Sustainability and ESG Policies on Corporate Finance Performance.” Journal of Sustainable Finance & Investment (February): 1–17. doi:10.1080/20430795.2021.1883984.
- Whittaker, Julie. 2011. “The Evolution of Environmentally Responsible Investment: An Adam Smith Perspective.” Ecological Economics 71 (November): 33–41. doi:10.1016/j.ecolecon.2011.08.006.
- Zadeh, L. A. 1965. “Fuzzy Sets.” Information and Control 8 (3): 338–353. doi:10.1016/S0019-9958(65)90241-X.