
ABSTRACT
There are diverging operationalizations of insight in experimental research, especially when comparing behavioral and neuroimaging research. The question arises how comparable these types of insight are. Here, we set out (1) to evaluate the usefulness of the matchstick arithmetic task for investigating cognitive and neural processes underlying insight-based problem solving, (2) to determine whether the Aha! Experience is diminished over a multitude of trials, and (3) to compare true (correctly solved), false (incorrectly solved), and induced insights. To this end, we analysed solution rates, response times, strength of the Aha! experience, and event-related potentials (ERPs). Our results showed that the Aha! experience was not weakened over 40 trials, but showed the importance of the time for a solution attempt. True, false, and induced insights differed with regard to Aha! ratings and ERP amplitude −2000 to −1500 ms before the response. Our study underscores the importance of the operationalization of insight.
Introduction
When people stumble upon a problem that at first seems difficult or even impossible to solve, they sometimes experience a sudden insight into its solution. Such insights have been of central interest to early Gestalt psychologists such as Wolfgang Köhler, who conducted research on the intelligence of apes (Köhler, Citation1917). Problem-solving skills were at the centre of Köhler’s research. Until now, a variety of operationalizations of insight have been developed, such as solving problems defined as insight problems that are thought of as only solvable via insight (e.g. Metcalfe, Citation1986), sudden comprehension after a state of incomprehension (e.g. Auble et al., Citation1979), experiencing a feeling of “Aha!” when solving a problem correctly (e.g. Bowden & Jung-Beeman, Citation2003) or incorrectly (e.g. Danek & Wiley, Citation2017), or experiencing a feeling of “Aha!” when comprehending the solution in general (self-solved or revealed by the experimenter) (e.g. Kizilirmak, Galvao Gomes da Silva, Imamoglu, & Richardson-Klavehn, Citation2016). Over the past 15 years, most insight researchers seem to have converged on the operationalisation of insight as a problem correctly solved by the participant, often with the concurrent subjective feeling of Aha! (Aziz-Zadeh et al., Citation2009; Danek et al., Citation2013; Danek & Wiley, Citation2017; Salvi et al., Citation2016). The definition of the subjective feeling of Aha! is often based on the four characteristics summarised by Topolinski and Reber (Citation2010): suddenness/surprise, a feeling of ease or relief after the solution is comprehended, confidence regarding the correctness of the solution, and the experience of positive affect. Please note that we did not include the subjective feeling of Aha! as part of the current study's operationalization of insight, but chose to assess Aha! strength as a dependent variable.
In the present study, we were especially interested in the differentiation between endogenous insights (problems solved by the participant) and induced insights (sudden comprehension of solutions when they were presented). This differentiation has been an ongoing topic of debate among insight researchers. Here, we would like to illuminate the neurocognitive basis of this differentiation. Moreover, endogenous insights can further be split into true (correctly solved) and false insights (incorrectly solved). In the following, we will use these terms as introduced here. Until now, most studies on this topic have only compared two of the three categories. The present study sought a comparison between all three with the same paradigm and participants.
Previous research on the overlaps and differences of true, false and induced insights showed that this differentiation seems warranted. For example, Danek and colleagues compared true and false insights with regard to their perceived affective qualities, as well as their solutionFootnote1 rates (Danek et al., Citation2014b; Danek & Wiley, Citation2017). They found a positive relationship between the occurrences of Aha! experiences and the likelihood of a solution being correct. Moreover, they reported that the key qualitative components for both true and false insights were the feeling of pleasure, suddenness, and certainty for the solution being correct, while surprise was generally higher for false insights, and relief was higher for true insights. Regarding the differentiation between endogenous true insights and induced insights, a study from our group found that they differ in regard to frequency of Aha!, the strength of the positive feeling evoked, as well as in the ability to subsequently recall the solution later (Kizilirmak, Galvao Gomes da Silva, et al., Citation2016; Kizilirmak, Wiegmann, & Richardson-Klavehn, Citation2016). Rothmaler et al. found additional electrophysiological support for a distinction between true endogenous insights and induced insights (Rothmaler et al., Citation2017). Specifically, 2000–1500 ms prior to the response indicating a solution had been found or that the presented solution was comprehended, alpha power differences were observed for solutions with versus without Aha!. Notably, there was an interaction for endogenous and induced insights with and without Aha! with regard to alpha power: When solved, solutions with Aha! had a higher alpha power than those without. On the other hand, when not solved, but comprehended after solution presentation, solutions with Aha! were associated with reduced alpha power. The authors suggested this effect to reflect differences related to internal versus external foci of attention.
As became evident in the study by Rothmaler and colleagues, neuroscientific methods can help to figure out the extent to which operationalizations of insight are actually comparable with regard to their underlying cognitive and neurophysiological processes. They are helpful uncovering temporal differences of neural processes that are not visible in behaviour, e.g. electroencephalography (EEG), as well as differential recruitment of neuroanatomical structures, e.g. functional magnetic resonance imaging (fMRI). Importantly, sometimes, when behavioural responses do not differ for a certain comparison, the cognitive and neural processes behind them still do, and this only becomes evident with neuroscience methods (e.g. the difference between high-functioning elderly and young adults in episodic memory retrieval who behaviourally perform at the same level; see Cabeza et al., Citation2002). Such basic neural processing differences can even be discovered with inexpensive and widely available methods such as event-related potentials (ERPs). One limitation faced by the user of these methods is the need for a sufficiently high signal-to-noise ratio, which in turn means the corresponding number of trials must be rather large (Bowden et al., Citation2005; Jung-Beeman et al., Citation2004). The exact number depends on the method, the size of the true effect, and specific neurophysiological correlate of interest. The most common paradigm used in neuroscientific studies of insight problem solving is the Compound Remote Associates Task (CRAT), designed by Bowden and Jung-Beeman (Citation2003), based on Mednick’s Remote Associates Task (Mednick, Citation1962). The original number of items was 144, but it has already been translated into different languages and the number of items has been expanded (German, Chinese, Dutch; e.g. Akbari Chermahini et al., Citation2012; Landmann et al., Citation2014; Qiu et al., Citation2008). The CRAT has been used with fMRI and simple BOLD contrasts between conditions (e.g. Jung-Beeman et al., Citation2004; Kizilirmak et al., Citation2019; Kizilirmak, Thuerich, Folta-Schoofs, Schott, & Richardson-Klavehn, Citation2016; Tik et al., Citation2018), and EEG methods including ERPs, frequency, and time–frequency; analyses (e.g. Kounios et al., Citation2006; Qiu et al., Citation2008; Rothmaler, Nigbur, & Ivanova, Citation2017; Sandkühler et al., Citation2008).
While tasks with a large number of trials are mandatory in EEG and fMRI research, they may pose a potential problem at the cognitive and behavioural level, namely, to what extent the Aha! experience during tasks like the CRAT is still comparable to the feeling of Aha! that participants report when solving classical one-trial problems. Our knowledge on the electrophysiological correlates of insight is largely based on EEG studies using the CRAT, which, in summary yielded the following key results:
A burst of gamma activity in response to solutions with Aha! relative to solutions without Aha!, located at right temporal electrode sites, beginning approximately 300 ms prior to the button press indicating that the solution has been found, and lasting roughly 1 s (Jung-Beeman et al., Citation2004).
An increase in alpha power −1750 to −500 ms prior to button press in response to correct solutions with versus without Aha! (Jung-Beeman et al., Citation2004), or between −2000 and −1500 ms respectively (Rothmaler et al., Citation2017).
When further differentiating not only between items solved correctly with (endogenous insight) vs. without Aha!, but also between items whose solutions were comprehended with (induced insight) vs. without Aha! when shown after an unsuccessful attempt at problem solving, there is a double dissociation. While endogenous insights are associated with a parietal increase in alpha power −2000 and −1500 ms before button press compared to items solved without Aha!, induced insights are associated with a decreased alpha power compared with solutions comprehended without Aha! within the same time range and the same posterior topographical maximum (Rothmaler et al., Citation2017).
In the 2 s before stimulus onset, power analyses revealed higher alpha power over temporo-parietal and temporal electrode sites as well as over central frontal electrode sites, operationalised as above (Kounios et al., Citation2006).
Regarding our aim to understand the cognitive and neural dissociation of true, false, and induced insights, only Rothmaler et al. (Citation2017) also compared endogenous (true) and induced insights, whereas no study has specifically assessed the neural underpinnings of false compared to true insights. Hence, our question regarding the triple-dissociation of true, false, and induced insights has until now only been partly answered.
Aims of the current study
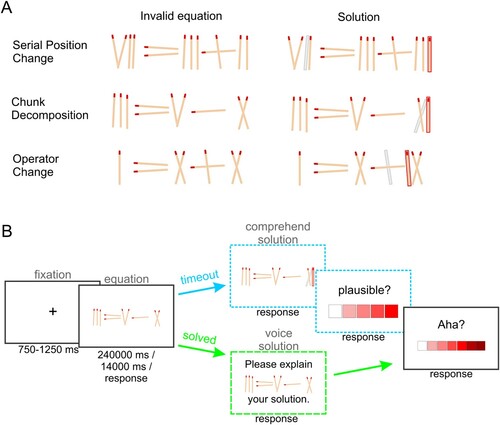
The aim of the current study was to directly compare, for the first time, true (correctly solved), false (incorrectly solved), and induced insights (comprehension induced by presenting the solution after a failed attempt at problem solving) with regard to behavioural performance (RTs and accuracy), Aha! ratings, and also mean ERP amplitudes. We chose matchstick arithmetic problems for this endeavour (Knoblich et al., Citation1999). The stimuli consist of matchstick figures depicting equations with Roman numerals. The equations are initially invalid, but they can be corrected by moving a single matchstick from one position to another. The participant’s task is to find out which single matchstick to move where to make the equation valid (see A for examples). An advantage of this task compared to the CRAT is that there are multiple ways to solve them. We assumed that the presence of multiple approaches to a solution would decrease the likelihood of the Aha! experience weakening over time. There are mainly three different types of problems (Knoblich et al., Citation2001) for which examples are provided in A: (1) Items that can be solved via Serial Position Change (SPC), that is, by shifting a single matchstick, such as changing VI into IV, (2) items that can be solved via Chunk Decomposition (CD), namely by deconstructing a chunk such as V or X to create, for example, II (or rather \\), or (3) items that can be solved via Operator Change (OC), that is, by changing not a numeral but rather an operator, for example, by taking a matchstick from an = (equal sign) to make a – (minus), or by taking a matchstick from one of the numerals to change a – (minus) into a + (plus sign). The items are highly similar in their appearance, and the visual input does not change during the problem-solving stage, in contrast to magic tricks, but comparable with CRAs. This makes the items also suitable for EEG measures with high temporal resolution (e.g. ERPs, time–frequency analysis). For the current study, we therefore also chose to study ERPs. ERP analyses are less complex than time–frequency analyses and if one could already find a distinction between different insight operationalizations in such a simple measure, it would be very helpful to back up the respective theoretical or cognitive processing distinction.
Figure 1. Stimulus material and exemplary trial. Panel A depicts one example per equation type for the invalid equation (the problem) and the valid equation (the solution). Stimuli were exactly presented as depicted. Panel B shows the trial structure. An equation could be presented for a total of 240 s or 14 s. When no button was pressed (turquoise), a valid solution was presented. Afterwards, participants were asked to rate the plausibility of the presented solution. When a response was made (green), the equation remained on display and the participant was instructed to voice the corrected equation. Finally, participants were asked to rate their Aha! experience.
The current study set out to illuminate the following research questionsFootnote2 and hypotheses:
Is there a difference in the mean strength of the Aha! experiences, as measured with a rating scale, for comprehending a particular way to solve a problem for the first time (first solved trial of each equation type), compared to the mean Aha! experience across many trials solved via the same method? This question was motivated by the fact that the Aha! experience may be diminished over time, due to the search space being more structured for a repeated compared to the first encounter (Derbentseva, Citation2007) and that most other studies using matchstick equations applied only one problem per type (e.g. Danek et al., Citation2016; Knoblich et al., Citation2001).
We expected to replicate the following pattern for the solution rates of different equation types: SPC > CD > OC (Knoblich et al., Citation1999, Citation2001), and the reverse pattern for the corresponding response times.
We further expected the feeling of Aha! to be stronger the more difficult the problem is (Derbentseva, Citation2007), with problem difficulty being associated with equation type (SPC < CD < OC). This would also be in line with the finding that solved items (hence, relatively easy for the participant) were found to illicit a lower Aha! than unsolved (∼ relatively difficult for the participant) presented solutions, while solutions that were read (no automatic splitting between subjectively easy and difficult items based on which were solved) lay in the middle (Kizilirmak, Wiegmann, et al., Citation2016).
As the feeling of Aha! is partly based on the confidence regarding the correctness of the solution, and because Danek and Wiley (Citation2017) reported that incorrect solutions with Aha! were associated with a lower confidence in the correctness of the solution, we expected the strength of the feeling of Aha! to show the following pattern: false insight < true insight. In this context, we also sought to assess the strength of Aha! experiences in the induced insight condition. We expected induced insight to show a weaker Aha! than true insight, but we could not make strong predictions regarding whether it would diverge from false insight in this respect.
We set out to find an ERP correlate of endogenous (true and false) and induced insights. Our ERP analyses were exploratory in nature, because there is little ERP research on insight problems so far, and especially none with matchstick arithmetic tasks to base exact hypotheses on. We explored the following questions:
Do endogenous true insights and induced insights differ with respect to response-locked ERPs?
Are there further differences between true (correctly solved) and false insights (incorrectly solved), as suggested by behavioural studies (Danek et al., Citation2014a; Danek & Wiley, Citation2017)?
Material and methods
Participants
Thirty-one students of the University of Hildesheim, mostly psychology undergraduates, participated in the study. Twenty-eight participants were right-handed (two were left-handed) and had normal or corrected-to-normal vision, 28 were female and three male. Their median age was 21 years (min = 18, max = 38; mean age = 21.6). The two left-handers were excluded from data analysis, to avoid any confounding effects of handedness, particularly regarding the ERP data, and one further participant had to be excluded from data analysis, because their behavioural response pattern (no correct solutions) strongly suggested that they misunderstood the task instructions. A fourth participant had to be excluded due to technical difficulties in recording the behavioural responses. The remaining 27 participants (24 female, 3 male) had a median age of 21 years (min = 18, max = 38; mean = 21.9). All participated after providing written informed consent. Additionally, they were also informed about their rights according to European Union and German data protection regulations. The local ethics committee of the University of Hildesheim approved the study.
Stimuli
For the task, we created 48 matchstick equations that used Roman numerals from 1 to 18 (I to XVIII). The equations were created as digital drawings made of matchsticks (see ). We intentionally chose varying angles for “laying out” the equations, i.e. the matchsticks were not always at an orientation of 0°, 45°, and 90°, but varied as if they had been laid out by hand. This was done to make it easier to realise that e.g. a V could be created from a I, by just adding another matchstick (I/), even if it did not look perfectly mirror-symmetrical (\/). For each equation, one incorrect form and one correct form were created. All incorrect equations could be changed into correct ones by moving just one matchstick to another position. The stimuli were created using Microsoft PowerPoint for Windows and GIMP (https://www.gimp.org/).
We created 16 items per solving option, that is, (1) SPC, (2) CD, and (3) OC. An example item for each equation type is depicted in A. A subset of the items could be solved in more than one way. With only numerals under 20, it was impossible to create only one-way solvable equations to that amount. Certain combinations of Roman numerals always allowed for several options. Of all 48 items, 28 were only solvable in one way, 16 items were solvable in two ways, three items were solvable in three ways. For one item we realised that a graphical error rendered the item unsolvable, and this item was therefore excluded from data analysis. A complete list of all items, primary solutions and potential alternative solutions can be found in Appendix 1.Footnote3 Which solution was found how often is also listed for reference.
Design
The following variables were manipulated: time for solving an item (14, 240 s) and equation type (SPC, CD, OC). Each type of equation comprised 16 items. Half of all items of each equation type were randomly presented with a long (240 s) and the other with a short (14 s) duration. These durations were chosen based on previous solution times reported by Knoblich and colleagues (Knoblich et al., Citation1999, Citation2001), to obtain a similar amount of solved and unsolved items. To summarise, all participants were presented with all 48 items (16 per equation type) and half of the items were presented with a long and the other half with a short duration (8 per equation type long, 8 short). The following behavioural data were collected:
whether items were solved (solved, not solved),
whether the solution offered was correct (correct, incorrect),
response time (RT) for solving an item or comprehending a presented solution after timeout, and
an Aha! rating on a 7-point scale (0 = no aha, 6 = very strong feeling of aha).
The Aha! rating was measured for both solved and unsolved items. In case no solution was found within the respective time limit, participants were presented with a correct solution and were asked to rate its plausibility on a 5-point scale, as well as their feeling of “Aha!”.
Task and procedure
Before the experiment, participants were informed about the EEG procedure and what the following task entailed. After providing written informed consent, participants were tested for their knowledge of Roman numerals. To this end, they were seated at a table, and Roman numerals were laid out one after another with large matchsticks. Participants were instructed to tell the experimenter the value as quickly as possible. After singular numerals, they were also presented with a very simple, but incorrect equation (II + I = I) they were instructed to fix by moving just one matchstick (solution: _I + I = II). This procedure served two purposes: (1) to detect participants with insufficient knowledge about Roman numerals, and (2) to familiarise them with the stimulus material and task. None of the participants appeared to have any trouble recognising the numeric values of the Roman numerals.
After this brief test and familiarisation, the participant was fitted with an electrode cap and the electrodes were attached to the cap, which included lowering the impedances below 10 kΩ using electrolyte gel. Participants were seated in a chair approximately 1 m in front of an LCD display with a resolution of 1920*1080 pixel, and a refresh rate of 60 Hz. Stimulus presentation was controlled with Presentation 20.0 (Neurobehavioral Systems, Inc., Berkeley, CA, USA). Behavioural data such as button presses and response times were also measured using this software and a standard USB keyboard. During electrode preparation, participants received written instructions of the task, which also informed them that “sometimes, during problem solving, they may experience an Aha! moment”. This Aha! experience was described listing the four criteria named by (Topolinski & Reber, Citation2010): suddenness, a feeling of ease, being convinced of the correctness of the solution, and a positive emotional response.
During the experiment, participants were presented with incorrect equations in Roman numerals that were made of matchsticks. Their task was to shift only one matchstick to make the equation valid (see B for an exemplary trial). In each trial, a fixation cross was presented for 750–1250 ms (randomly jittered to avoid cognitive preparation before equation onset and to reduce the amount of rest-related alpha EEG activity). Then an equation was presented for either 14 s or 240 s.Footnote4 Participants were instructed to press the spacebar key (four fingers of the left hand) as soon as they had figured out which matchstick to shift where. Once the button was pressed, the incorrect equation was still on display with the additional instruction to voice the corrected equation. After pressing the spacebar key again, a 7-point colour scale was presented to rate the degree of their feeling of “Aha!” from 0 (no Aha!; RGB white) to 6 (very strong feeling of Aha!; dark red, i.e. RGB 153,0,0). The respective part of the scale was chosen via using the cursor keys to-the-left and to-the-right (using the index and ring fingers of the right hand) and by pressing space to confirm. This ended a trial, and the next trial started.
Whenever participants did not press the spacebar key before time ran out, a correct solution was presented. Participants were instructed to press the spacebar key as soon as they had understood what had been done to make the equation valid. This was easy to see, because the shifted matchstick was replaced by a grey bar at its original location while it was highlighted with a red outline at its new location (see A). Immediately afterwards, a 5-point rating scale, ranging from RGB white over RGB red (5th box: 255, 0, 0) to dark red (7th box: 153, 0, 0), was presented on which participants should rate the plausibility of the presented solution. The same buttons were used as with the Aha! rating scale. After the plausibility rating, a 7-point Aha! rating scale was presented, just as with solved equations. This was done to enable comparisons of endogenous (solution found by participant) as well as induced (solution presented) Aha! experiences.
EEG recording and preprocessing
EEG was recorded using a Brain Amp DC amplifier and 32 ActiCap active cup electrodes with Ag/AgCl lining (Brain Products, Gilching, Germany), arranged according to the extended 10–20 system (Jasper, Citation1958). The following electrode positions were used: Fp1, Fp2, F7, F3, Fz, F4, F8, FC5, FC1, FC2, FC6, T7, C3, Cz, C4, T8, TP9, CP5, CP1, CP2, CP6, TP10, P7, P3, Pz, P4, P8, O1, Oz, O2. Two additional electrodes were used to measure the horizontal and vertical electrooculogram. One was positioned below the right eye (later re-referenced to Fp2) and the other at the outer right canthus. Impedance was kept below 10 kΩ for all electrodes. Data were recorded using BrainVision Recorder 1.21 software (Brain Products). FCz was used as reference electrode during recording, and ground was located at AFz.
For preprocessing, the BrainVision Analyzer (Brain Products, Gilching, Germany), version 2.2.0, was used. The following preprocessing steps were applied: Re-referencing to averaged mastoids (re-including FCz as a normal channel), applying high-pass (0.1 Hz) and low-pass filters (35 Hz), plus a 50 Hz notch filter (to account for data being collected in a non-shielded room), and applying an Independent Component Analysis for ocular artifact correction (Ocular Correction ICA). The ICA was used to identify independent components (ICs) explaining the variance of blinks, vertical, and horizontal eye-movements. For each participant, at least one IC was excluded for blinks/vertical eye-movements, plus an additional IC for horizontal eye-movements, in case the component was unmistakable. By visual inspection, it was checked whether only the respective artifact was removed from the signal, and not additional noise introduced. Then segmentation was carried out. Based on the focus of our work, i.e. comparing endogenous and induced insights, and especially true and false endogenous insights, and based on the behavioural results, items were split into true, false, and induced insights. Segments were chosen from time windows around the response (button press) indicating that either the response was found (true and false insights) or that the presented solution had been understood (induced insights). Segment length was −2000 ms to 100 ms, with button press as time point 0 ms. After segmentation, semi-automated artifact correction was performed (the following parameters were applied that never resulted in false positives: maximum allowed voltage step: 50 µV/ms, min/max allowed amplitude +/−200 µV, lowest allowed activity in intervals: 0.5 µV within 100 ms). During this step, segments including the masking stimulus were excluded from analysis (9 segments). The last 100 ms before button press were used to perform the baseline correction necessary for the computation of ERPs. This baseline was chosen, because it can be assumed that motor processing is what is happening there, as the decision making process is already over (Roskies, Citation2010). Because all participants pressed the same button under all conditions (i.e. space), it can be assumed that the process of coding and initiating the motor response should be highly similar if not the same. Moreover, in the most classical studies which use response-locked ERPs, namely those on the readiness potential (Bereitschaftspotential), a −200–0 ms or −100–0 ms baseline is often used for that reason (e.g. Jentzsch & Leuthold, Citation2002). Such a baseline has also been used by other problem-solving (Paynter et al., Citation2010) and insight problem-solving ERP research (Lang et al., Citation2006). A pre-stimulus baseline would be extremely inadequate as the problem-solving process sometimes took a few seconds and sometimes minutes, implying enormous variability in when comprehension (or insight) actually happened. A post-response deadline would also not make much sense, because participants may engage in response-evaluation processing which may differ between conditions (which is interesting on its own, but not the current focus). For further information, please see the Supplementary Methods section. After baseline correction, the segments were averaged per insight condition for each participant.
Splitting the data into more conditions would have resulted in an insufficient number of trials for data analysis. Nevertheless, multiple participants ended up having less than five trials in at least one condition. The specific conditions with low numbers of trials varied across participants, depending on whether participants had a stronger inclination towards responding when unsure or responding only when they were completely sure their response was correct. In this context, it should be pointed out that all participants were instructed to only press the button when they were sure that they could voice the valid equation.
Statistical analysis
All statistical analyses were performed using SPSS version 26 (IBM, Armonk, NY, USA). Considering that participants had low numbers of trials in different conditions of the experiment (see above), not all participants contributed to each cell of a factorial model and it was therefore likely that participants showed different patterns across conditions. To account for this pronounced variability, all data were analysed using Linear Mixed Models (LMM, also known as hierarchical linear model), including Participant as a random-effects factor to model the interdependence of observations. Thereby, we were able to include data from participants with empty cells, which would not be possible in repeated-measures ANOVAs. All parameter choices are reported in the results section. The significance level was set to p < .05, and p values of .05 < p < .10 were reported as trends. Regarding the assumptions for LMMs, these are normality of residuals, linearity, and variance homogeneity. The variance homogeneity assumption does not apply as we do not compare groups (no between-subjects manipulations). With regard to the normality of the residuals, this was either given or if not, there was at least no bimodal distribution or otherwise that would have severely biased the results (Schielzeth et al., Citation2020).
Response-locked ERPs were analysed using bin-wise LMMs. We are aware that the number of segments per insight condition was quite low to discover any but relatively large amplitude differences. Nevertheless, we chose to include this measure for exploratory purposes. All bins were of 250 ms length. Bins from −2000 ms to −250 ms before the response (indication of wanting to voice the solution for true and false insight, or having comprehended the presented solution for induced insight) were analysed. The bin just before the response was assumed to mainly reflect preparation of the motor response and thus being unspecific with respect to the cognitive processes of interest. It was therefore not statistically analysed. Moreover, it contained the interval used for baseline correction, which was especially chosen for that reason. To make the model feasible, we included only nine electrodes with good coverage of the head (F7, Fz, F8, T7, Cz, T8, P7, Pz, P8; located left frontal, middle frontal, right frontal, left temporal, middle central, right temporal, left parietal, middle parietal, right parietal). All LMMs were computed with fixed-factors Electrode (F7, Fz, F8, T7, Cz, T8, P7, Pz, P8) and Insight (true, false, induced), as well as random-effects factor Participant (25 levels). EEG data sets of two participants were unfortunately lost due to technical problems. Covariance of repeated measures was estimated using Compound Symmetry, because it can be assumed that the variability in measurements should be relatively homogeneous.
Results
Behavioural results
Please note that item number 39 (equation: VIII-X = III, solution template: VIII = X-III, type: OC) had to be excluded from data analysis, because the template solution was invalid for the item due to an error in its graphical presentation (it should have been VII-X = III → solution: VII = X-III).
Item analysis
Of all 47 items, a mean of 42.4% was solved. The relative number of items solved according to our first solution template, on which the categorisation of equations into SPC, CD, and OC was based, was 34.3% (of all 47 items). Since this was the vast majority (80.9% of all correctly solved items), our categorisation appears appropriate. A minority of 7.3% (of all correctly solved items) was solved according to the first alternative solution, and 1.3% was solved according to a second alternative. Mean Aha! Rating for all items was 3.8. The item with lowest mean Aha! Rating had a rating of 3.26 (item 32, VI = IX + III → VI = III + III, solution type: CD), and the one with the highest Aha! Rating had a mean rating of 4.42 (item 47, I = X + X → I = X-IX, solution type: OC). Note that the 7-point rating scale was from 0 (no aha) to 6 (very intense feeling of Aha!).
We further chose to test the potential correlation between the solution frequency of items as an operationalisation of item difficulty and mean Aha! rating. The one-tailed Spearman correlation was significant [r = -.298, p = .021, N = 47 items]. Please refer to Appendix 1 for details and a complete list of all items and solutions.
Solution rate
Solution rates were tested with an LMM with fixed-effects factors EQ_type {SPC, CD, OC} and Timeout {14, 240 s}, and random-effects factor Participant {27 levels}. We chose the full-factorial option, reduced maximum likelihood estimation (REML), and Satterthwaite approximation. Diagonal was chosen to estimate the covariance type for fixed effects, and identity for the random-effects factor.
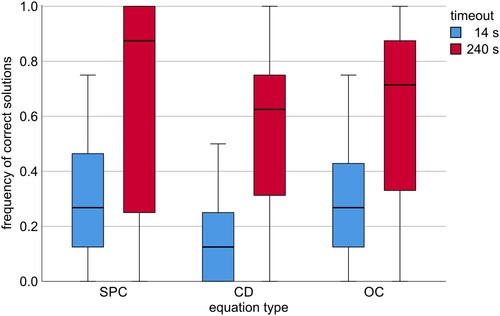
As can be seen in A, the equation types roughly showed the pattern CD (mean = .36, SE = .04) < OC (.43, .04) < SPC (.48, .05), with long presentation durations leading to higher solutions rates for all conditions (14 s timeout: .24, SE = .04; 240 s timeout: .61, .04). There was a significant main effect for EQ_type [F(2, 68.61) = 5.51, p = .006], and a significant main effect for Timeout [F(1, 104.65) = 143.19, p < .001], but no interaction [F(2, 68.61) = 0.31, p = .734].
Figure 2. Solution rate by equation type and timeout.
When further taking into account whether a specific equation type appeared for the first time (for each of the two Timeouts), and adding First_time (yes, no) as an additional fixed-effects factor, this factor showed neither main effect [F(1, 190.19) = 2.21, p = .139] nor interactions with either EQ_type, nor Timeout, nor both [all p > .55](B). Overall, mean solution rates were slightly lower for items of an EQ_type that appeared for the first time per Timeout (mean = .37, SE = .05) compared to the 14 times afterwards (.43, .04). The model was weaker than the previous one (more complex without explaining considerably more variance), as indicated by the Bayesian Information Criterion (BIC), which rose from 20.95–251.16.
Response times
Response times or rather solution times for the different equation types and timeouts were compared for correctly and incorrectly solved items. Subject (28 levels) was included as a random-effects factor, and EQ_type (SPC, CD, OC), Timeout (14 s, 240 s), and Solution (correct, incorrect) as fixed-effects factors. All other aspects were the same as above.
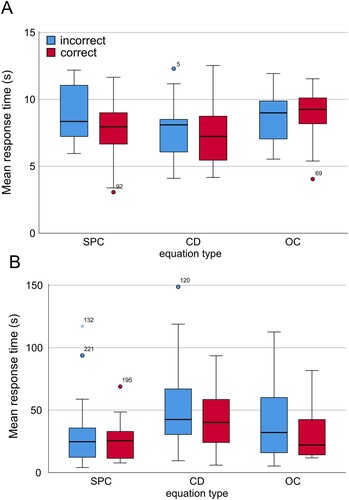
For the fixed-effects factors, we found the following: A significant main effect for EQ_type [F(2, 54.00) = 4.37, p = .017], a significant main effect for Timeout [F(1, 88.12) = 156.31, p < .001], a marginal main effect for Solution [F(1, 88.67) = 3.33, p = .071], and a significant interaction between EQ_type and Timeout [F(2, 54.00) = 5.28, p = .008]. There was no interaction between Timeout and Solution [F(2, 88.13) = 2.54, p = .115]. All other potential interactions between any two or all three factors were tested, but remained far from significance [p > .93]. The pattern for mean RTs was CD (mean = 28.1 s, SE = 2.1 s) > OC (22.5 s, 1.9 s) > SPC (19.3 s, 2.1 s). Furthermore, as depicted in B, when given more time (240 s), CD was associated with the longest mean RTs (48.3 s, 4.2 s) compared with SPC (30.1 s, 4.2 s) and OC (36.0 s, 3.8 s) items, whereas when given only 14 s (A), OC items showed the longest RTs (9.0 s, 0.4 s) compared with SPC (8.5 s, 0.4 s) and CD (7.8 s, 0.5 s). Lastly, RTs were generally somewhat longer for incorrectly solved items (25.5 s, 2.1 s) as compared to correctly solved ones (21.1 s, 1.2 s), a typical effect reflecting participants’ higher uncertainty for incorrect solutions (Kellogg, Citation1931; Pike, Citation1968). This difference can be seen by comparing blue (incorrect solutions) and red (correct solutions) boxplots in .
Figure 3. Boxplots of response times (s) by equation type, correctness and timeout. Panel A shows the data for a timeout after 14 s, panel B for a timeout after 240 s.
Aha! rating
To test our hypothesis regarding the Aha! experience associated with true, false and induced insights, we compared the mean Aha! ratings of correctly solved items (true insight), incorrectly solved items (false insight), and presented solutions after timeout (induced insight). We computed an LMM with random-effects factor Subject and fixed-effects factor Insight (true, false, induced). Considering the potential influence of EQ_type and Timeout, we further added these as fixed-effects factors. Diagonal was chosen to estimate the covariance type for fixed effects, and identity for the random-effects factor. The factor EQ_type, which we expected to reflect item difficulty (SPC < CD < OC; Knoblich et al., Citation1999, Citation2001), however, did not explain a sufficient amount of variance (neither main effect nor interactions with this factor reached significance, all p > .32). Hence, we recomputed the model without EQ_type, leading to an improved BIC (396 vs. 1027). (We provide more information on the distribution of Aha! rating categories per equation type and participant in Supplementary Figure S1.)
For exploratory purposes, and because difficulty may also be operationalised via the solution rate (the more difficult, the lower) or mean RT (the more difficult, the higher), we also tested for potential correlations between mean Aha! ratings and solution times, and between mean Aha! ratings and mean RT. The one-tailed Spearman correlation between mean Aha! rating and solution rate showed a trend towards significance [rS = .307, p = .059, N = 27], indicating that higher solution rates went along with higher Aha! ratings (see Supplementary Figure S2), while the correlation between mean Aha! rating and mean RT (of correct solutions) did not approach significance [rS = .064, p = .376, N = 27] (see Supplementary Figure S3).
There was no effect of Timeout [F(1, 25.18) = 2.76, p = .109], but a main effect of Insight [F(2, 22.56) = 3.72, p = .040]. The interaction between Timeout and Insight was not significant [F(2, 22.35) = 2.01, p = .158]. As can be seen in , insights were rated lowest for false insights (mean = 3.6, SE = 0.3), and similarly high for true (4.1, 0.2) and induced insights (4.1, 0.3).
Figure 4. Aha! ratings according to insight type and timeout. Data are presented as split per individual in A.
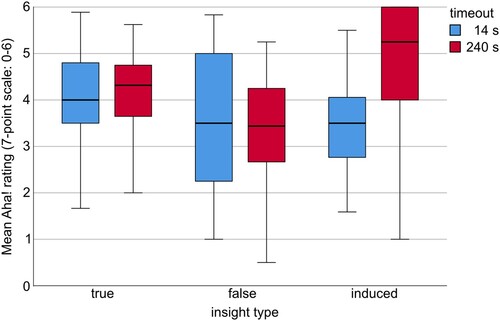
Notably, there was also a subgroup of participants, who did rate almost in the opposite direction, i.e. six subjects rated their feeling of Aha! highest for false insights on average (see A). From the comments in the post-experimental questionnaire regarding the question of how Aha! experiences felt when solutions were presented or self-generated, it seems that there were two groups of participants: those who were relieved about the revelation of the solution (strong feeling of Aha!) and those who were upset (lower feeling of Aha!). However, self-reports after the experiment did not consistently correspond to participants’ actual aha ratings. The most consistent effect of Timeout was observed for induced insights: The more time participants had to think about the solution before its presentation, the higher their Aha! ratings (with the exception of one participant, who unfortunately did not fill out the comment about the different emotional responses regarding the Aha! experiences).
Figure 5. Aha! ratings according to insight type and time of occurrence. Panel A depicts the subject-wise mean Aha! rating split by Insight (true, false, induced). Panel B shows the difference between mean participant-wise Aha! ratings for the first instance of any equation type per timeout in comparison with the mean of all instances afterwards.
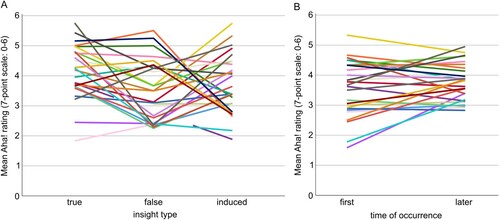
When recomputing the aforementioned model with Insight (true, false, induced) and First_time (yes, no), excluding Timeout, which did not contribute significantly to explaining the data, the model estimate BIC was raised from 418 to 478, i.e. the model was weaker. There was a weak trend-wise effect of First_time [F(1, 65.42) = 2.92, p = .092], and no interaction with Insight. Insight was again significant [F(2, 61.19) = 8.46, p = .001]. The mean Aha! Rating was slightly lower for the first time an equation type appeared (mean = 3.5, SE = 0.2) compared to afterwards (3.8, 0.1). However, when looking at the curves of individual participants, it becomes evident that the majority of participants showed no change between the first time and afterwards. Only seven participants showed a considerable increase (!) of their Aha! ratings from the first time to afterwards (see B). This effect is in the opposite direction as expected, that is, no diminishing of the feeling of Aha!, but an enhancement.
EEG results: event-related potentials
In the following, only those effects that reached significance (p < .05) will be described. The random-effects parameter was significant for all bins [Wald Z = 3.55–3.56, p < .001]. For a comprehensive list of all statistical results for the fixed effects, including also insignificant effects, please refer to . The factor Electrode yielded significant effects for all bins, suggesting that overall amplitude differed depending on electrode site.
Table 1. List of all results regarding the fixed-effects factors.
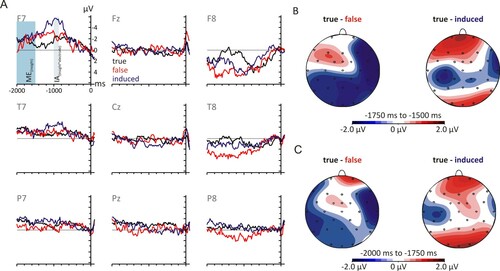
Between −2000 ms and −1500 ms before the response, there was a significant main effect of Insight. This main effect seemed to fade out between −1500 ms and −1250 ms, where it was still marginal. Interestingly, as can be seen in , true and induced insights had a lower amplitude difference compared to true and false insights. Please note that, because there is no significant interaction with Electrode in this temporal bin, this means that the effect of Insight shows the same direction at all electrode sites. Between −1000 to −750 ms before the response, a marginal interaction between Insight x Electrode was observed. For exploratory purposes, we split this bin into two smaller bins (−1000 to −875 ms, −875 to −750 ms) and computed the LMMs again. The analysis revealed that the marginal effect originated from a significant interaction between −1000 ms and −875 ms [Insight x Electrode: F(16,612) = 1.68, p = .047] while it was non-significant for −875 ms to −750 ms [F(16,612) = 1.37, p = .153]. From visual inspection (see ), it appears that the interaction may be due to the effect of Insight having different patterns depending on location: At left frontal electrodes (see F7) true and false insights are mainly overlapping, differing considerably from induced insight which shows a large negative deflection. In contrast, at right temporal to posterior electrodes (see T8, P8), false insight differs more from true and induced insights, showing a relatively more positive deflection. Please note that FDR-corrected p-values (using the Benjamini-Hochberg procedure) would be .094 and .153, respectively, and thus not significant. However, this exploratory post-hoc analysis suggests that it may be worth to look further into this temporal window in follow-up studies with a higher number of trials.
Figure 6. Event-related potential data for true, false, and induced insights. Panel A depicts weighted grand averages (according to how many segments were contributed by each participant) at the nine electrode sites included in the statistical analysis. Data were 12 Hz low-pass filtered for visualisation only. Negative is up. The right panels show topographical differences between true and false, as well as true and induced insight for the main effect of Insight in the −1750 to −1500 ms bin (B) and −2000 to −1750ms bin (C).
Discussion
The current study set out (1) to evaluate the usefulness of matchstick arithmetic items for the investigation of the cognitive and neural processes underlying insight problem solving via insight, (2) to determine whether the Aha! experience is diminished over a multitude of trials, and (3) to compare true, false, and induced insights with regard to potential neural and cognitive differences.
First encounters of a problem type are only marginally different to multiple encounters
Most previous studies had only employed matchstick arithmetic items for behavioural and eye-tracking studies (Danek et al., Citation2016; Knoblich et al., Citation1999, Citation2001), using one item per equation type (i.e. SPC, CD, and OC), or using more items, but without evaluating the question whether Aha! ratings changed over time (Derbentseva, Citation2007). Our first interest was therefore, whether the processing of an item type encountered for the first time differed from the processing of subsequent encounters with the same item type. We found marginal differences for solution rates, which increased slightly, indicating a small learning effect. Surprisingly, the Aha! rating increased slightly from the first encounter of each equation type to the encounters afterwards. It should be noted, though, that this effect was probably driven by seven of the 26 participants, pointing to individual differences in Aha! rating behaviour. We tentatively suggest that certain personality traits might underlie such inter-individual variability of Aha! ratings. It would, for example, be conceivable that participants with a high need for cognition (Furnham & Thorne, Citation2013) might have felt stronger positive emotional responses when their success rate increased. We did not assess personality traits or other indices of individual differences in the present study, but our results indicate that future investigations should be directed at the inter-individual variability of insight experiences. Individual differences in insight problem solving are currently mainly supported for cognitive abilities like spatial or verbal working memory, fluid intelligence, etc. (see Chu & MacGregor, Citation2011, for a review). Our results raise the possibility that there may be processing differences beyond cognitive ability. While the increase of Aha! ratings over time in a subgroup cannot be conclusively interpreted in the context of the current study, our results allow us to conclude that there seems to be little if any risk of the Aha! experience decreasing considerably over time with this stimulus material and multiple encounters (42, 14 encounters per equation type).
The general type of solution is not as important as the particular way of rectifying it
Regarding the different equation types (or rather solution types), we unexpectedly found a different pattern than the one expected based on previous studies employing matchstick items (Knoblich et al., Citation1999, Citation2001). Although items that could be solved via shifting a singular matchstick (SPC) were the easiest type as evident in their high solution rates, the most difficult type of equations turned out to be those solved by CD (V or X), with OC being of medium difficulty. Importantly, this pattern of difficulty was independent of whether the specific type of equation was solved for the first time or the many times afterwards.
For solution rates, this pattern (difficulty: SPC < OC < CD) was independent of the time participants had for a solution attempt. Naturally, for response times, the timeout did matter. When participants were given more time (240 s), the pattern reported above was found. However, when given only 14 s, response times showed the following unexpected pattern: CD < SPC < OC. This could potentially have to do with the nature of the particular CD items that drove the mean RT, i.e. the CD items solved most often. When looking at the five CD items solved most often (see Appendix 1), it becomes obvious that when taking apart the chunk, the matchsticks that made up the chunk (X or V) could stay next to each other, i.e. V → II, IV → III, X → II, and so on. In other words, when using only very few matchstick arithmetic items, like one item per equation type, it is extremely important to consider the particular way(s) an item can be solved, instead of merely considering the equation type alone. We thus suggest that the diverging pattern found by Knoblich and colleagues, who employed only one item per type, could be due to the particular equations chosen to represent each type. Moreover, the item categorised as OC (B: III = III + III → III = III = III; Knoblich et al., Citation2001) could also potentially be solved without changing an operator by chunk composition (VI = III + III).
The strength of the aha! experience is independent of equation type
As for our hypothesis regarding the dependence of the Aha! rating on item difficulty, there was no such effect, at least when assuming a dependence between the equation type and difficulty, neither in the previously expected hierarchy (SPC < CD < OC) nor the observed one (SPC < OC < CD). There was, however, a weak positive correlation between mean Aha! rating and solution rate, which showed the opposite pattern to the hypothesised relationship: higher Aha! ratings for easier items, that is, items solved more often. Thus, the strength of the Aha! experience appears to be independent of equation type and equation type does not reflect item difficulty sufficiently well.
Our result is at odds with the results reported by Derbentseva (Citation2007) who, also for matchstick arithmetic tasks, reported a strong dependence between the intensity of an insight and the difficulty to solve it, operationalised as the degree of restructuring necessary. The different findings could, however, be solely explained by the differing operationalizations of difficulty and insight. Insight was dichotomous, i.e. either there was an Aha! (lightbulb flashing) experience or it was absent, and difficulty was determined by a rating of the difficulty level on a 10-point rating scale when raters saw the solution and its problem at the same time. A follow-up study to ours could collect data on the difficulty of items corresponding to Derbentseva and measure Aha! strength also with a 10-point rating scale to see whether a positive relationship between difficulty and Aha! could be replicated this way. That aside, our participants might have been biased, as our instruction only explicitly stated that feelings of Aha! “may sometimes occur”. This statement does entail that they do not occur at other times, but that was implicit. Therefore, participants responses may have been biased towards Aha!.
Differences between true, false, and induced insights
Turning our focus on the differentiation between true, false, and induced insights, operationalised as correct solutions, incorrect solutions, and solutions presented after a failed attempt at problem solving, our results suggest that participants did indeed perceive a difference between false insights (mean = 3.6) as compared with true and induced insights (both mean = 4.1), because their mean Aha! ratings were lower. The higher Aha! ratings for true as compared to false insights are in line with findings reported by Danek and Wiley (Citation2017). Our results lend further support to Danek's and Salvi’s (Citation2018) notion that insight processing differs considerably for correct (true insight) and incorrect (false insight) solutions, while also adding information about the relationship between presented solutions and Aha! ratings.
Due to the relatively low number of items per condition, we could, unfortunately not split the electrophysiological data as a function of Insight (true, false, induced) and Timeout (14, 240 s) at the same time. We therefore split the data only for true, false, and induced insights. Here, we found that this factor had a main effect on the overall amplitude of the ERP between −2000 ms and −1500 ms before response button press. Interestingly, overall amplitudes differed less for true and induced insights compared to true and false insights. In a phenomenological study of insight, Danek and colleagues found that the main qualitative differences between true and false insights are that true insights are more strongly associated with relief, while for false insights the surprise component is more dominant (Danek et al., Citation2014a; Danek & Wiley, Citation2017). It may be that the relief component is similarly relevant for induced insights, as in our study the solution was only presented after a failed attempt at problem-solving. Moreover, participants may be similarly convinced about the correctness of the solution for true and induced insights, while they are less confident about their false insights. Further qualitative studies could illuminate this aspect. In a very recent study, Cui and colleagues also used response-locked ERPs in study on learning via insight using the CRAT (Cui et al., Citation2020). They incorporated a binary Aha/no Aha decision for each item and found differences between ERPs −800 ms to −400 ms before the response for items solved correctly with Aha! compared to those without. Importantly, this difference was found in the absence of behavioural differences (neither in RTs nor in solution rates). Their study adds support to our proposition that response-locked ERPs can be especially useful for the investigation of insight(-like) processing.
Until recently, there were no other ERP studies on insight that analysed response-locked ERPs, but instead, previous studies ERPs on insight-based problem solving, employed stimulus-locked approaches (Leikin et al., Citation2016; Qiu et al., Citation2008; Shen et al., Citation2013). On the one hand, because the solution times differed considerably, we refrained from this type of ERP analysis, as we could not exclude the possibility that differences could be solely explained by differences in the timing of the cognitive processes rather than the processes themselves. On the other hand, since participants were instructed to press the button as soon as they had solved an equation or comprehended a presented solution, the insight was highly likely to have occurred within the two seconds before button press, but earlier than 200 ms before button press, which is the approximate time to compute and initiate the motor response. Therefore, we are confident that a response-locked analysis was more appropriate in our study. However, in a recent EEG study that employed Wavelet analysis to analyse the time–frequency differences between items solved correctly with a subjective Aha! experience (referred to as insight condition) versus without Aha! (referred to as analysis condition), Oh et al. (Citation2020) report differences in the gamma range −142 ms to −79 ms before button press, i.e., the time window of our baseline correction. Although their conditions do not correspond to ours and we applied a 35 Hz low-pass filter, and gamma should therefore be excluded from our ERP measures, their study could indicate that cognitive and/or affective processing differences may still have taken place in the 100 ms before the response. This indicates a potential limitation of the chosen baseline.
When looking at response-locked oscillation data, Rothmaler and colleagues also found differences within a similar time interval as we did, only for alpha power (as estimated via a Wavelet decomposition). They proposed that the alpha increase in relation to endogenous true insight may reflect an increased shift from the visually presented information on the screen to internally represented information, whereas the alpha decrease in response to induced insight could reflect a stronger external focus of attention on the presented solution (Rothmaler et al., Citation2017). It would be interesting to see whether the ERP differences we found for true endogenous, false endogenous, and induced insights can also be attributed to the alpha range. However, this remains to be tested in future studies.
Conclusion
The matchstick arithmetic task seems a well-suited task for the cognitive and neuroscientific investigation of insight problem solving. No decrease of the strength of the Aha! experience could be observed for the first as compared to all following encounters of the different equation types. Otherwise, our study showed the importance of taking into account that the time a problem solver has for a solution attempt has a considerable impact not only on the solution rate, but also on the Aha! rating itself. Lastly, our behavioural and electrophysiological data show that it is important to differentiate between endogenous true (correct solutions) and false insights (incorrect solutions), as well as induced insights (presented solutions after failed problem-solving attempt).
Supplemental Material
Download PDF (501.6 KB)Acknowledgements
This study was enabled by the local research funds assigned to K. F.-S. by the University of Hildesheim.
Data availability statement
All data used for the above reported analyses have been made available as SPSS.sav files at the Open Science Framework under doi:10.17605/OSF.IO/C6PX9 or https://osf.io/c6px9/, shared under CC BY-NC-SA license. In case of interest in the raw files (behavioural logfiles from Presentation in.txt format, or raw.eeg,.vmrk,.hdr files from BrainVision Recorder), these data will be made available upon reasonable request by the first author. There is supplementary information available in a separate PDF file.
Disclosure statement
No potential conflict of interest was reported by the author(s).
Notes
1 Solution rate always refers to relative number of solutions provided. It includes correct and incorrect solutions.
2 Please note that this study is mostly exploratory in nature due to limited prior research on these issues.
3 The pictures of the items and item solutions will be provided upon request by the first author.
4 Within this interval, a masking stimulus was presented for the duration of 750 ms at 12 s for the early timeout and at 60 s for the late timeout. This procedure was included to allow for the analysis of stimulus-locked ERPs shortly before participants solved the item. However, this analysis option was abandoned in favor of response-locked analyses that seemed more promising (see e.g., Rothmaler et al., Citation2017). We therefore chose to leave out this display from the exemplary trial in B to simplify it.
References
- Akbari Chermahini, S., Hickendorff, M., & Hommel, B. (2012). Development and validity of a Dutch version of the remote associates task: An item-response theory approach. Thinking Skills and Creativity, 7(3), 177–186. https://doi.org/https://doi.org/10.1016/j.tsc.2012.02.003
- Auble, P. M., Franks, J. J., & Soraci, S. A. (1979). Effort toward comprehension: Elaboration or “aha”? Memory & Cognition, 7(6), 426–434. https://doi.org/https://doi.org/10.3758/BF03198259
- Aziz-Zadeh, L., Kaplan, J. T., & Iacoboni, M. (2009). “Aha!”: The neural correlates of verbal insight solutions. Human Brain Mapping, 30(3), 908–916. https://doi.org/https://doi.org/10.1002/hbm.20554
- Bowden, E. M., & Jung-Beeman, M. (2003). Normative data for 144 compound remote associate problems. Behavior Research Methods, Instruments, & Computers, 35(4), 634–639. https://doi.org/https://doi.org/10.3758/BF03195543
- Bowden, E. M., Jung-Beeman, M., Fleck, J., & Kounios, J. (2005). New approaches to demystifying insight. Trends in Cognitive Sciences, 9(7), 322–328. https://doi.org/https://doi.org/10.1016/j.tics.2005.05.012
- Cabeza, R., Anderson, N. D., Locantore, J. K., & McIntosh, A. R. (2002). Aging gracefully: Compensatory brain activity in high-performing older adults. NeuroImage, 17(3), 1394–1402. https://doi.org/https://doi.org/10.1006/nimg.2002.1280
- Chu, Y., & MacGregor, J. N. J. (2011). Human performance on insight problem solving: A review. The Journal of Problem Solving, 3(2), 119–150. https://doi.org/https://doi.org/10.7771/1932-6246.1094
- Cui, C., Zhang, K., Du, X. m., Sun, X., & Luo, J. (2020). Event-related potentials support the mnemonic effect of spontaneous insight solution. Psychological Research, 2017. https://doi.org/https://doi.org/10.1007/s00426-020-01421-1
- Danek, A. H., Fraps, T., von Müller, A., Grothe, B., & Öllinger, M. (2013). Aha! experiences leave a mark: Facilitated recall of insight solutions. Psychological Research, 77(5), 659–669. https://doi.org/https://doi.org/10.1007/s00426-012-0454-8
- Danek, A. H., Fraps, T., von Müller, A., Grothe, B., & Öllinger, M. (2014a). It’s a kind of magic - what self-reports can reveal about the phenomenology of insight problem solving. Frontiers in Psychology, 5(December), 1–11. https://doi.org/https://doi.org/10.3389/fpsyg.2014.01408
- Danek, A. H., Fraps, T., von Müller, A., Grothe, B., & Öllinger, M. (2014b). Working wonders? Investigating insight with magic tricks. Cognition, 130(2), 174–185. https://doi.org/https://doi.org/10.1016/j.cognition.2013.11.003
- Danek, A. H., & Salvi, C. (2018). Moment of truth: Why Aha! experiences are correct. The Journal of Creative Behavior, 54, 484–486. https://doi.org/https://doi.org/10.1002/jocb.380
- Danek, A. H., & Wiley, J. (2017). What about false insights? Deconstructing the Aha! experience along Its multiple dimensions for correct and incorrect solutions separately. Frontiers in Psychology, 7(JAN), 1–14. https://doi.org/https://doi.org/10.3389/fpsyg.2016.02077
- Danek, A. H., Wiley, J., & Öllinger, M. (2016). Solving classical insight problems without Aha! experience: 9 Dot, 8 coin, and matchstick arithmetic problems. Journal of Problem Solving, 9(April), 47–57. https://doi.org/https://doi.org/10.7771/1932-6246.1183
- Derbentseva, N. (2007). The intensity of the insight experience in problem solving: Structural and dynamic properties. University of Waterloo.
- Furnham, A., & Thorne, J. D. (2013). Need for cognition. Journal of Individual Differences, 34(4), 230–240. https://doi.org/https://doi.org/10.1027/1614-0001/a000119
- Jasper, H. H. (1958). The ten-twenty electrode system of the international federation. Electroencephalography and Clinical Neurophysiology, 10(2), 370–375. https://doi.org/https://doi.org/10.1016/0013-4694(58)90053-1
- Jentzsch, I., & Leuthold, H. (2002). Advance movement preparation of eye, foot, and hand: A comparative study using movement-related brain potentials. Cognitive Brain Research, 14(2), 201–217. https://doi.org/https://doi.org/10.1016/S0926-6410(02)00107-6
- Jung-Beeman, M., Bowden, E. M., Haberman, J., Frymiare, J. L., Arambel-Liu, S., Greenblatt, R., Reber, P. J., & Kounios, J. (2004). Neural activity when people solve verbal problems with insight. PLoS Biology, 2(4), E97. https://doi.org/https://doi.org/10.1371/journal.pbio.0020097
- Kellogg, W. N. (1931). The time of judgment in psychometric measures. The American Journal of Psychology, 43(1), 65. https://doi.org/https://doi.org/10.2307/1414239
- Kizilirmak, J. M., Galvao Gomes da Silva, J., Imamoglu, F., & Richardson-Klavehn, A. (2016). Generation and the subjective feeling of “aha!” are independently related to learning from insight. Psychological Research, 80(6), 1059–1074. https://doi.org/https://doi.org/10.1007/s00426-015-0697-2
- Kizilirmak, J. M., Schott, B. H., Thürich, H., Richter, A., Sweeney-Reed, C. M., & Richardson-Klavehn, A. (2019). Learning of novel semantic relationships via sudden comprehension is associated with a hippocampus-independent network orchestrated by the mPFC. Consciousness and Cognition, 69(January), 113–132. https://doi.org/https://doi.org/10.1016/j.concog.2019.01.005
- Kizilirmak, J. M., Thuerich, H., Folta-Schoofs, K., Schott, B. H., & Richardson-Klavehn, A. (2016). Neural correlates of learning from induced insight: A case for reward-based episodic encoding. Frontiers in Psychology, 7(NOV), 1–16. https://doi.org/https://doi.org/10.3389/fpsyg.2016.01693
- Kizilirmak, J. M., Wiegmann, B., & Richardson-Klavehn, A. (2016). Problem solving as an encoding task: A special case of the generation effect. The Journal of Problem Solving, 9(1), 59–76. https://doi.org/10.7771/1932-6246.1182
- Knoblich, G., Ohlsson, S., Haider, H., & Rhenius, D. (1999). Constraint relaxation and chunk decomposition in insight problem solving. Journal of Experimental Psychology: Learning, Memory, and Cognition, 25(6), 1534–1555. https://doi.org/https://doi.org/10.1037/0278-7393.25.6.1534
- Knoblich, G., Ohlsson, S., & Raney, G. E. (2001). An eye movement study of insight problem solving. Memory & Cognition, 29(7), 1000–1009. https://doi.org/https://doi.org/10.3758/BF03195762
- Köhler, W. (1917). Intelligenzprüfungen an anthropoiden. Royal Prussian Society of Sciences.
- Kounios, J., Frymiare, J. L., Bowden, E. M., Fleck, J. I., Subramaniam, K., Parrish, T. B., & Jung-Beeman, M. (2006). The prepared mind: Neural activity prior to problem presentation predicts subsequent solution by sudden insight. Psychological Science, 17(10), 882–890. https://doi.org/https://doi.org/10.1111/j.1467-9280.2006.01798.x
- Landmann, N., Kuhn, M., Piosczyk, H., Feige, B., Riemann, D., & Nissen, C. (2014). Entwicklung von 130 deutschsprachigen Compound Remote Associate (CRA)-worträtseln zur untersuchung kreativer prozesse im deutschen sprachraum. Psychologische Rundschau, 65(4), 200–211. https://doi.org/https://doi.org/10.1026/0033-3042/a000223
- Lang, S., Kanngieser, N., Jaśkowski, P., Haider, H., Rose, M., & Verleger, R. (2006). Precursors of insight in event-related brain potentials. Journal of Cognitive Neuroscience, 18(12), 2152–2166. https://doi.org/https://doi.org/10.1162/jocn.2006.18.12.2152
- Leikin, R., Waisman, I., & Leikin, M. (2016). Does solving insight-based problems differ from solving learning-based problems? Some evidence from an ERP study. ZDM - Mathematics Education, 48(3), 305–319. https://doi.org/https://doi.org/10.1007/s11858-016-0767-y
- Mednick, S. A. (1962). The associative basis of the creative process. Psychological Review, 69(3), 220–232. https://doi.org/https://doi.org/10.1037/h0048850
- Metcalfe, J. (1986). Feeling of knowing in memory and problem solving. Journal of Experimental Psychology: Learning, Memory, and Cognition, 12(2), 288–294. https://doi.org/https://doi.org/10.1037/0278-7393.12.2.288
- Oh, Y., Chesebrough, C., Erickson, B., Zhang, F., & Kounios, J. (2020). An insight-related neural reward signal. NeuroImage, 214(March), 116757. https://doi.org/https://doi.org/10.1016/j.neuroimage.2020.116757
- Paynter, C. A., Kotovsky, K., & Reder, L. M. (2010). Problem-solving without awareness: An ERP investigation. Neuropsychologia, 48(10), 3137–3144. https://doi.org/https://doi.org/10.1016/j.neuropsychologia.2010.06.029
- Pike, A. R. (1968). Latency and relative frequency of response in psychophysical discrimination. British Journal of Mathematical and Statistical Psychology, 21(2), 161–182. https://doi.org/https://doi.org/10.1111/j.2044-8317.1968.tb00407.x
- Qiu, J., Li, H., Yang, D., Luo, Y., Li, Y., Wu, Z., & Zhang, Q. (2008). The neural basis of insight problem solving: An event-related potential study. Brain and Cognition, 68(1), 100–106. https://doi.org/https://doi.org/10.1016/j.bandc.2008.03.004
- Roskies, A. L. (2010). How does neuroscience affect our conception of volition? Annual Review of Neuroscience, 33(1), 109–130. https://doi.org/https://doi.org/10.1146/annurev-neuro-060909-153151
- Rothmaler, K., Nigbur, R., & Ivanova, G. (2017). New insights into insight: Neurophysiological correlates of the difference between the intrinsic “aha” and the extrinsic “oh yes” moment. Neuropsychologia, 95(December 2015), 204–214. https://doi.org/https://doi.org/10.1016/j.neuropsychologia.2016.12.017
- Salvi, C., Bricolo, E., Kounios, J., Bowden, E., & Beeman, M. (2016). Insight solutions are correct more often than analytic solutions. Thinking & Reasoning, 22(4), 443–460. https://doi.org/https://doi.org/10.1080/13546783.2016.1141798
- Sandkühler, S., Bhattacharya, J., & Zak P. (2008). Deconstructing insight: EEG correlates of insightful problem solving. PLoS ONE, 3(1), e1459. https://doi.org/https://doi.org/10.1371/journal.pone.0001459
- Schielzeth, H., Dingemanse, N. J., Nakagawa, S., Westneat, D. F., Allegue, H., Teplitsky, C., Réale, D., Dochtermann, N. A., Garamszegi, L. Z., & Araya-Ajoy, Y. G. (2020). Robustness of linear mixed-effects models to violations of distributional assumptions. Methods in Ecology and Evolution, 11(9), 1141–1152. https://doi.org/https://doi.org/10.1111/2041-210X.13434
- Shen, W., Liu, C., Zhang, X., Zhao, X., Zhang, J., Yuan, Y., & Chen, Y. (2013). Right hemispheric dominance of creative insight: An event-related potential study. Creativity Research Journal, 25(1), 48–58. https://doi.org/https://doi.org/10.1080/10400419.2013.752195
- Tik, M., Sladky, R., Luft, C. D. B., Willinger, D., Hoffmann, A., Banissy, M. J., Bhattacharya, J., & Windischberger, C. (2018). Ultra-high-field fMRI insights on insight: Neural correlates of the Aha!-moment. Human Brain Mapping, 39(June 2015), 3241–3252. https://doi.org/https://doi.org/10.1002/hbm.24073
- Topolinski, S., & Reber, R. (2010). Gaining insight into the “Aha” experience. Current Directions in Psychological Science, 19(6), 402–405. https://doi.org/https://doi.org/10.1177/0963721410388803