
ABSTRACT
Many decisions require prioritising relevant over less relevant information. In risky environments, probabilities provide the weights to use information according to their relevance. We investigated whether participants with high ability and motivation are able to use probabilities effectively for prioritising relevant information and, therefore, decide accurately and achieve better outcomes. A variant of the standard probabilistic inference paradigm of decision research was used for which interindividual variability has been demonstrated. We assessed whether participants’ statistical-methodological competence can explain thesedifferences in decision accuracy.
Findings show that even highly capable and motivated participants had difficulty in consistently prioritising relevant information. Participants looked up twice the amount of information necessary. In explicit decision contexts, participants achieved high decision accuracy, yielding high monetary gains. When information was conflicting, the overuse of less relevant information led to a deviation from accurate behaviour and, therefore, inferior decision outcomes. Statistical-methodological competence could not explain the deviation.
In most real-life decisions, outcomes are not certain. Imagine, for example, that you want to invest in a stock – you can never be certain about its return. A large part of decision making research thus investigates decisions that involve risk (e.g. Eeckhoudt et al., Citation2011; Festjens et al., Citation2015; Kahneman & Tversky, Citation1979; Levin et al., Citation2007; Schulze & Newell, Citation2018; Tversky & Kahneman, Citation1981, Citation1986; Vlaev et al., Citation2007). In such decisions, decision makers choose between different options for which outcomes and outcome probabilities are known and can be specified (e.g. decision between a 10€ gain for Lottery A with a .6 probability vs. a 20€ gain for Lottery B with a .4 probability). This allows one to investigate how probabilities are integrated into the decision process. In addition, comparison to normative expectations derived from expected utility theory (Savage, Citation1954; Von Neumann & Morgenstern, Citation1944) helps to evaluate the quality of decisions. For many years, the principles of utility theory were considered the benchmark for assessing rationality in decision making. Utility theory assumes that decision makers use probabilities as weights. Moreover, a rational decision maker is expected to apply only one rule for the integration of probabilities and values – i.e. the weighted additive rule (Costello & Watts, Citation2014; Frisch & Baron, Citation1988; Levin et al., Citation2007; Newell et al., Citation2015; Schulze & Newell, Citation2018). With the rise of the bounded rationality approach (Simon, Citation1982), the notion of rationality was replaced by adaptivity. Accordingly, individuals are assumed to apply not only one rule for decision making but rather possess a repertoire of decision strategies. Some reduce cognitive effort to a minimum by ignoring information and avoiding integration. In certain environments, those simple strategies lead to a remarkable level of accuracy in decision making. Thus, with regard to adaptivity, it would then be a waste of resources to apply unconditionally effortful strategies that require processing all the information given. Hence, an adaptive decision maker must be responsive to the environment – i.e. capable of differentiating situations to adapt strategy selection contingent upon their characteristics (Beach & Mitchell, Citation1978; Bhatia, Citation2017; Gigerenzer, Citation2008; Gigerenzer & Selten, Citation2001; March, Citation1978; Payne, Citation1982; Payne et al., Citation1988, Citation1993).
Payne and colleagues (Citation1988) distinguished between compensatory and non-compensatory environments. In the latter, the dispersion of the weights is large so that high-probability outcomes cannot be compensated by low-probability outcomes – resulting in relevant versus less relevant information. In decision research, such environments are often studied with probabilistic inference tasks (e.g. Bröder, Citation2000; Glöckner & Betsch, Citation2008). Those tasks consist of probabilistic cues that make predictions about the outcomes of decision options. The cues differ with regard to their cue validity, which is the probability that a cue’s predictions are correct.
For illustration purposes, assume that there is a soccer game with Team A and Team B playing against each other. You encounter three soccer fans in the stadium who consider themselves to be experts. Jack predicts that Team A will win the game, whereas the other two, Tim and Tom, swear that Team B will make it. Hence, their predictions are in conflict. In the past, however, Tim and Tom scored only slightly above chance level (50%) in their predictions − they predicted 60% of their bets correctly. Jack, in turn, did quite well. The majority of his past bets turned out to be correct − he was correct in 80% of his bets, which is thirty points above chance level. In formal terms, the validities of the cues (Tim, Tom, and Jack) are .6, .6. and .8. Due to the structure of the task (outcomes: win vs. loss; options: Team A vs. Team B), their chance-corrected cue validities (.1, .1, .3) form a non-compensatory environment (cf. Jekel et al., Citation2012). Hence, the dispersion of probabilities is so large that the weighted value of Jack’s prediction will always be higher than those of Tim and Tom, even if the latter converge in their predictions. If you were to bet on a team and rely on the three fans’ predictions, you can use utility theory’s weighted additive rule to calculate the expected value for each of the two teams. The pay-off will be 100 Euros for a bet on the winner and no gain (0 Euro) for a bet on the loser. For Team A – for which Jack predicts a win and the others predict a loss – the expected value is 30€ (100€ x .3 + 0€ x .1 + 0€ x .1). For Team B, it is only 20€ (0€ x .3 + 100€ x .1 + 100€ x .1). Hence, Jack’s predictions are not compensated by those of Tim and Tom even in a conflicting prediction situation.
The structure of this environment has strong implications on decision behaviour. Knowing the cues’ predictions and validities, one can make an informed decision. A homo economicus will make a rational decision by applying the weighted additive rule, multiplying each outcome with its probability, summing products up to calculate the expected values, and finally choosing the option with the highest expected value (Bhatia, Citation2017; Newell et al., Citation2015; Payne et al., Citation1988; Schulze & Newell, Citation2018). An adaptive decision maker, however, will make a decision by applying a simple strategy to arrive at the same decision and beneficial outcomes. One simply follows the predictions of the high-validity cue (which is Jack in the example above) while ignoring the others (Bhatia, Citation2017; Bröder, Citation2003; Gigerenzer & Goldstein, Citation1996; Gigerenzer et al., Citation1999; Payne et al., Citation1988). Following Jack’s predictions is an example of the well-known lexicographic strategy or take-the-best heuristic (Gigerenzer & Goldstein, Citation1996; Gigerenzer et al., Citation1999; Payne et al., Citation1988). Such a simple strategy requires no arithmetic skills but a sensitivity to probabilities. As a prerequisite for applying this simple strategy, one must realise that probabilities are highly dispersed and that it is reasonable to focus only on the high-validity cue (Payne et al., Citation1988). Note that both the normative rule and the simple strategy will lead to the same level of decision accuracy in such a non-compensatory environment. Hence, decision accuracy is maximised by prioritisation of information with using either the normative rule or the simple strategy, which both result in choosing the same option. The simple strategy however, requires less effort, i.e. decision time and cognitive capacity (Gigerenzer, Citation2008). In contrast, strategies that ignore probabilities are maladaptive in such environments. For example, an individual might be tempted to rely on an equal weight or majority rule (e.g. Russo & Dosher, Citation1983; Zhang et al., Citation2006), i.e. following the advice of the majority of experts while neglecting their validities. If the majority consists of the low validity cues only, decisions will be inaccurate in a non-compensatory environment (Bröder, Citation2003).
There is ample evidence that decision makers decide accurately in non-compensatory environments and are able to apply simple strategies (e.g. Bergert & Nosofsky, Citation2007; Gigerenzer et al., Citation1999; Lee et al., Citation2017; Payne et al., Citation1988; Rieskamp & Hoffrage, Citation2008; Rieskamp & Otto, Citation2006). At the same time, not all decision makers do this equally consistently (e.g. Ayal & Hochman, Citation2009; Betsch et al., Citation2014, Citation2016, 2018; Bröder, Citation2000; Bröder & Gaissmaier, Citation2007; Lee & Cummins, Citation2004; Newell & Shanks, Citation2003; Newell et al., Citation2003). These findings show not only that some adults sometimes fail to adapt but also that there are interindividual differences in applying simple strategies. For example, Betsch and colleagues (Citation2014, Citation2016, Citation2018) found that approximately one third of adult decision makers failed to decide in line with the high-validity cue in a non-compensatory environment, leading to suboptimal decision outcomes. In addition, Bröder and Gaissmaier (Citation2007) found that only less than half of their almost 500 participants made decisions by prioritising the most relevant information.
Three different explanations have been discussed for this non-adaptivity to the environmental structure: paradigm complexity, lacking incentives for adaptive decisions, and lacking ability of decision makers. Decision paradigms often suffer from high complexity, presenting participants with a large set of options and cues, or use a complex display of information that might hinder successful decision making (Hoffrage et al., Citation2015). They also contain probabilistic information that must be used to understand the hierarchy of cue validities (see also Dougherty et al., Citation2008; Juslin & Persson, Citation2002). Further, decision research often does not sufficiently incentivize successful decisions. For example, if incentivized, participants were paid 0.10 to 0.15€ for each correct decision (Kämmer et al., Citation2013; Rieskamp & Otto, Citation2006), received fixed amounts between 6 and 10€ independent of correct decisions (Bröder & Schiffer, Citation2006), or could gain a bonus payment of $3 for those who achieve at least 80% correct decisions (Bergert & Nosofsky, Citation2007). Accordingly, decision makers simply might not be motivated to increase decision quality. In addition, some decision makers might lack the necessary cognitive abilities. Research shows that cognitive ability influences decision accuracy (e.g. Bröder, Citation2003; Bröder & Newell, Citation2008; Bruine de Bruin et al., Citation2007; Cokely & Kelley, Citation2009; Jackson et al., Citation2017; Stanovich & West, Citation2000).
This research aims to investigate whether highly capable and motivated decision makers prioritise relevant information in a non-compensatory environment. Specifically, we approached the high-performers of our educational system – university PhD students, postdocs, and lecturers – as participants. We ensured that they were motivated to show the best possible performance with high rewards for each successful decision. We paid all participants contingent upon performance on a level that could greatly exceed their individual hourly income. Moreover, we confronted them with an environment that is low in complexity, since it has been used in prior research with children.
With this study, we do not aim to classify strategies or test specific assumptions on strategy application. Rather, the central goal is to assess whether decision makers high in ability and motivation will succeed in effectively adapting to the environment. We will analyse decisions outcome-based in terms of accurate decisions. Accurate decisions are those in line with the predictions of the high-validity cue, which are simultaneously also those with the highest expected value. Thus, decision accuracy maximises gains and thereby also monetary gains.
We investigated whether statistical-methodological competence can explain further differences between individuals. There is a bulk of evidence showing that (statistical) numeracy, reasoning, and related abilities, e.g. scientific thinking and critical thinking, profoundly influence the quality of decision making (e.g. Ashby, Citation2017; Butler, Citation2012; Butler et al., Citation2017; Cokely et al., Citation2012; Cokely et al., Citation2018; Ghazal et al., Citation2014; Jasper et al., Citation2017; Lehman & Nisbett, Citation1990; Leshowitz et al., Citation2002; Pertl et al., Citation2017; Peters et al., Citation2006; Reyna & Brainerd, Citation2008; Stanovich, Citation2016; Stanovich & West, Citation1998).
We thus expected that high-performers with a high level of statistical-methodological competence will prioritise the most relevant information and thus decide more accurately than high-performers with a low level of statistical-methodological competenceFootnote1 in a non-compensatory decision environment independent of presentation format (open and closed information matrix, see below). Additionally, we hypothesised that high-performers with a high level of statistical-methodological competence will prioritise the most relevant information and thus decide more accurately than high-performers with a low level of statistical-methodological competence, especially when the most relevant information is in conflict with less relevant information (pattern with high conflict between the high-validity cue and the other cues).Footnote2
Method
Sample
We aimed to collect data from the high performers of our educational system to ensure a high level of ability. High performers were university PhD students, postdocs, and lecturers. They were recruited through inquiries per e-mail, in colloquia, and in person at different universities in Germany. We aimed to obtain a sample size of 102 participants based on G*Power calculations (Faul et al., Citation2007) to be able to find group differences related to their level of statistical-methodological competence. As the budget for the study was 1,300€ and participants performed better than expected, we were required to end data collection after 52 participants. Therefore, we did not reach the preregistered sample size. In addition, three participants were excluded due to technical problems, so that the final sample includes 49 participants (35% female, mean age = 30.43 years, SD = 6.13). Participants should vary in terms of their statistical-methodological competence; we thus recruited participants based on their research field. Seventeen participants are trained in the arts & humanities, whereas thirty-two participants are trained in natural sciences. Participants were paid contingent upon their performance to ensure a high level of motivation for decision accuracy. They earned 25€ on average for approximately 45 min of participation (45% above the hourly average gross income of a PhD candidate with a 50% position).
Paradigm
We adopted an information board paradigm for studying probabilistic inference decisions. A variant of this low-complex task has been previously applied in research on child decision making (Betsch et al., Citation2014; Citation2016). It provides a structural equivalent to standard paradigms used in adult research (e.g. Bröder & Schiffer, Citation2006; Glöckner & Betsch, Citation2008; Newell et al., Citation2003).
Decision environment
The non-compensatory decision environment was presented as an information matrix containing three cues that make binary outcome predictions for three options. The cues differed regarding their validity of making correct predictions.
Cue validity
Previous research showed that people sometimes have difficulty understanding cue validities (e.g. Bergert & Nosofsky, Citation2007; Newell & Shanks, Citation2003). We conveyed probabilistic information in two formats: experienced based and stated as a visual representation on the information board (adopted from prior child research with the paradigm). In a learning phase, participants sequentially experienced the relative frequency with which a cue made correct predictions. The result of this was subsequently presented in graphical formats as relative frequencies (see Procedure section). Moreover, the cues’ validities were reinforced by the outcome distribution during the decision phase.
The dispersion of validities (.56; .56; .86) was sufficiently high to create a non-compensatory environment. Accordingly, the weighted predictions of the low-validity cues could formally not compensate the predictions of the high-validity cue. Thus, decision makers striving for high decision accuracy should prioritise the most relevant information – the predictions of the high-validity cue – over less relevant information – the predictions of the other cues.
We also varied two additional factors, presentation format and cue prediction patterns, to provide conditions under which participants might deviate from accurate decision making.
Presentation format
Prior research has shown that presentation format influences decision making (Glöckner et al., Citation2014; Söllner et al., Citation2013). In a closed matrix, information (i.e. predictions of cues) is hidden. To search information, participants must sequentially open the covered cells in the matrix. In an open matrix, all cells are uncovered, so that predictions are visible right from the beginning of each decision. Generally, individuals are prone to use more and even less relevant information if it is visible without active search (Glöckner & Betsch, Citation2008; Söllner et al., Citation2014).
Conflict in cue prediction patterns
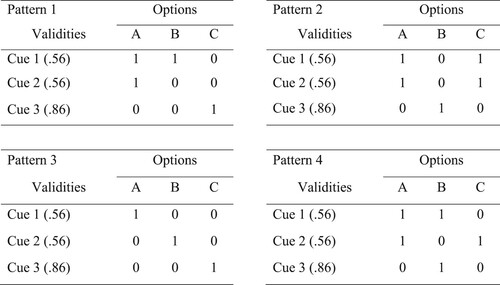
The paradigm allows us to vary the pattern of cue predictions. We created four different types of prediction patterns (). In Pattern 1 and 2, the cue information was in conflict: the high-validity cue pointed to a different option than the low validity cues. Pattern 3 and 4 were less conflicting – in Pattern 3 each cue predicted a different option, whereas in Pattern 4 the high-validity cue and one of the low validity cues predicted the same option. Each pattern was shown six times with rotations in each presentation format.
Figure 1. The Four Types of Prediction Patterns Used in the Decision Trials. Note. The rows contain the predictions of the three cues differing in cue validity (p = .56; .56; .86). Each cue makes outcome predictions (1 = gain; 0 = no gain) for the three options depicted at the top of each column.
Importantly, in the non-compensatory environment, deciding according to the predictions of the high-validity cue will yield optimal decisions regardless of pattern type. Participants were immediately informed about their outcomes, which reinforced the cue validities.
Measuring statistical-methodological competence
Our approach to measure statistical-methodological competence was two-fold. First, we approached high performers trained in either natural sciences or the arts & humanities. We expected the former to have more statistical-methodological competence than the latter, which we controlled for by asking the participants to report their experiences with statistical analyses and empirical research. In addition, we assessed numeracy by using the 4-item version of the Berlin Numeracy Test. This is a robust instrument for the assessment of statistical numeracy and risk literacy that has also been validated for use in highly educated samples (Cokely et al., Citation2012).
Design
We used a 4 (cue prediction patterns: 1 vs. 2 vs. 3 vs. 4) x 2 (presentation format: open vs. closed) x 2 (statistical-methodological competence: high vs. low) factorial design with the first and second factor manipulated within participants.
Participants performed 48 decisions. Each of the four cue prediction patterns was used six times in both presentation formats. The cue information was completely shown to participants in 24 trials (open information matrix, ). In the other 24 trials, participants were presented with a closed information matrix. Participants could search for as many cue predictions as they wished and as often as they liked. The trial block order was counterbalanced.
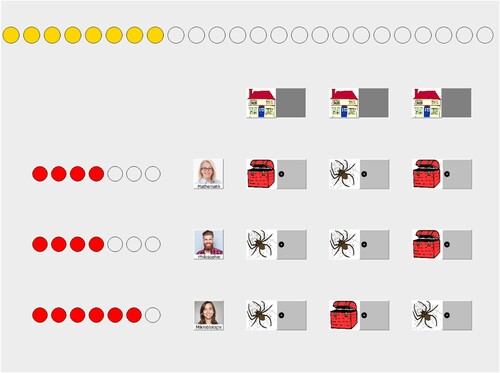
Figure 2. Decision Within the Open Information Matrix. Note. The houses represent the decision options. The three persons are the cues. The red dots next to them are their cue validities, displayed as “smart circles”. In the open matrix, all predictions are visible (in the closed matrix, which is not depicted here, the predictions are covered by the grey doors and can be opened via mouse-click). Participants make their decision by clicking on one house. Then, either a treasure or a spider appears in the house. The circles at the top represent the treasure points. They become coloured with every treasure found. Every treasure is traded into a monetary gain, whereas a spider yields no gain.
Procedure
The tool is an adaption of MouseKids used in Betsch et al.’s studies (e.g. Citation2014, Citation2016, Citation2018). The only difference here was that the cues are persons and not animals. All other aspects of the tool remained unchanged. Data collection was realised in individual settings. A trained experimenter supervised each participant, explained the procedure of the study, and introduced the participant to the MouseKids adaptation. To ensure that the participants’ goal was to find as many treasures as possible, they were informed that each treasure equals 0.625€ and the sum of treasures found will be traded into money at the end of the study. Additionally, they were informed that the tool is usually used for researching decision making in children.
Cue selection and learning phase
Before making the decisions, participants selected three out of eight cues, which varied regarding age, gender, and profession (all academic positions from different areas) and were asked to explain the decision of the first cue on a separate sheet. The order of cue selection was counter-founded with cue validity to compensate for subjective liking and competence assignment. Specifically, the cue chosen for the first position was later assigned the lowest cue validity.
To learn cue validities, the experimenter showed the participant the cues’ prediction by opening the box next to the person, stating whether there was a spider or a treasure in the picture, and then opening the house on top of the screen, again stating whether there is a spider or a treasure in the house and concluding whether the cues’ prediction was correct or incorrect. For each correct prediction, the cue receives a so-called smart circle. In subsequent trials, the experimenter continued to verbalise the content of each box and house. After seven trials, the experimenter summarised the performance of the cue by stating that it had received four out of seven smart circles and continued with the second cue, which also received four out of seven smart circles. The learning phase closed with the observation of predictions by the high-validity cue, which received six out of seven smart circles.
Decision phase
After completing the learning phase and one training trial, the experimenter left the room and the participant conducted the first 24 trials of the decision phase within either an open or closed information matrix. After finishing the first block of trials, the experimenter returned to start the second block – containing an additional 24 trials – with the other presentation format of the information matrix and then left the room again.
During the trials of the decision phase, participants always received immediate feedback concerning their decision. They received the information about outcomes by opening the house and finding either a treasure or a spider.
Questionnaire
After decision making, participants filled out an online questionnaire asking for demographic data and personality variables, which we do not address in this paper, as well as questions to infer their level of statistical-methodological competence. We asked whether they had training in inferential statistics and personal experience conducting and evaluating quantitative empirical studies. In addition, a manipulation check concerning the understanding of cue validities was assessed. The participants’ task was to estimate for each cue how often a treasure would be in the house if the cue predicted a treasure in 100 decisions.
At the end of the study, participants were paid contingent on their performance in the 48 decision trials. Their monetary gains were rounded up to the nearest ten cents when necessary and ranged from 17.50€ to 27€.
Results
We first analysed the decisions of the whole sample to investigate whether highly capable and motivated decision makers prioritised relevant information in a non-compensatory environment and made accurate decisions.
Cue learning
As a fundamental prerequisite for accurate decision making, participants must be responsive to the weight structure in the environment. The experienced and stated validities of the cues were .56, .56, and .86, reflecting the probability for correct predictions. In the manipulation check, participants were asked to transfer their impressions of the cues’ validities in a specific percentage value. We used Bröder’s approach to analyse the individuals’ ratings (Bröder, Citation2000, p. 1336). Accordingly, we first assessed the median of the ratings, which were .57, .57 and .85. Secondly, we calculated the correlation of stated and estimated (median) cue validities, which showed a perfect correlation with r = .99, p < .001. Obviously, our threefold induction of probabilistic information (experience during learning, stated validities in a graphical format, reinforcing cue validities by outcome feedback on decisions) was effective and established the adequate hierarchy of cue validities.
Decision accuracy
Overall, accurate decisions – i.e. those following the predictions of the high-validity cue – varied between 12 and 48 with an average of 36.49 (SD = 10.04) across all 48 decisions. In a second step, we investigated whether the cue prediction patterns and the presentation format affected decision accuracy.
shows the average number of accurate decisions by patterns. In a conflicting situation (Patterns 1 and 2), participants deviated from accurate behaviour and based their decisions strikingly less often on the most relevant information than in non-conflicting situations (Patterns 3 and 4).
Table 1. Descriptive Statistics of Accurate Decisions by Patterns.
This deviation appeared in both the open information matrices, where all information was directly shown and the patterns were visible immediately, as well as in the closed information matrices, where information was hidden and the patterns were not directly recognisable. displays results for each pattern separately for closed and open presentation formats.
Table 2. Descriptive Statistics of Accurate Decisions by Patterns Dependent on Presentation Format.
A repeated measures ANOVAFootnote3 with patterns and presentation format as repeated measure factors supported that the accurate decisions differed significantly between patterns, F(3,144) = 38.86, p < .001, ηp2 = .447. The pattern effect was observable in the open as well as in the closed presentation format. There was an interaction effect of patterns and presentation format, F(3,144) = 3.62, p = .015, ηp2 = .07, indicating that the presentation format influenced the extent of the pattern effect. The main effect of presentation format was not significant, F(1,48) = .85, p = .36.
Altogether, this suggests that decision accuracy of high performers was affected by cue prediction patterns – with more conflicting patterns leading to less accurate decision making in both presentation formats – but not by presentation format itself.
Information search
In the closed presentation format, participants’ search for information can be analysed. They looked up more information, on average, than necessary for an accurate decision (M = 141, SD = 54). Participants assessed mainly new pieces of information − only few participants opened a cell twice during some trials. However, those were exceptional cases. Prioritising only the predictions of the high-validity cue with 72 pieces of information in total would have been sufficient to maximise decision accuracy while minimising effort. Accordingly, results show that the participants looked up twice as much information, on average, as needed. Due to the significant overuse of information, t(43) = 8.36, p < .001, they were able to encode the patterns partly in the closed information matrices.
Monetary gains
In general, the chance level of gain per trial was 1/3, meaning that guessing would lead to a gain in 16 trials. All participants performed substantially above chance level (gains: M = 39.49, SD = 2.83, range: 28–43). We additionally explored participants’ monetary gains. Monetary gains ranged from 17.50€ to 27€ with an average of approximately 25€ and are highly correlated with decision accuracy, r = .79, p < .001. Prioritising the most relevant information and deciding according to the predictions of the high-validity cue led to gains in 86% of decisions. Most of the money gained was due to accurate decisions (i.e. gained in decisions following the predictions of the high-validity cue, M = 20.17€, SD = 5.27€), whereas strikingly less was gained due to non-accurate decisions (i.e. gained in decisions not following the predictions of the high-validity cue, M = 4.52€, SD = 3.97€). Thus, accurate decisions also paid off in terms of monetary gains.
Relation to statistical-methodological competence
We aimed to examine whether high performers with high levels of statistical-methodological competence show less deviance from accurate decision making than high performers with low levels of statistical-methodological competence. Consequently, the deviating behaviour presented above should be explained by differences in statistical-methodological competence between participants. This was defined as experiences with statistical analyses and empirical research. Surprisingly, participants’ self-reports revealed that their expertise in statistics and methods was not related to each other as expected. Therefore, we decided to compare the participants only regarding their field of research as a proxy to their statistical-methodological competence.Footnote4 The descriptive statistics for the relevant dependent variables are displayed in Table A (Appendix).
We hypothesised that high-performers with a high level of statistical-methodological competence will prioritise the most relevant information and thus decide more accurately than high-performers with a low level of statistical-methodological competence in our non-compensatory decision environment in the open as well as the closed information matrices. Thus, we first investigated performance of participants with training in natural science vs. the arts & humanities. Participants did not differ significantly in decision accuracy, neither in the open, t(47) = -.017, p = .987Footnote5, nor in the closed presentation format, t(47) = -.108, p = .915, nor in terms of the amount of money earned, t(47) = -.244, p = .808.
We further investigated whether participants differed in their performance in high conflicting patterns (1 and 2; ; these are the only patterns that showed substantial deviation from accurate decision making, see ). An ANOVA with Pattern 1 and Pattern 2 showed no effect of training on decision accuracy. We did not find that natural scientists decided more accurately than scientists of the arts & humanities – neither in Pattern 1, F(1,47) = 1.45, p = .234, nor in Pattern 2, F(1,47) = .29, p = .596. Altogether, statistical-methodological competence in the form of training due to research fields could not explain differences in decision accuracy.
In a next step, we analysed whether numeracy is a proper variable to compare differences concerning decision accuracy, since it was a promising factor in previous studies (cf. Ashby, Citation2017; Cokely et al., Citation2012; Cokely et al., Citation2018; Ghazal et al., Citation2014; Jasper et al., Citation2017; Peters et al., Citation2006; Reyna & Brainerd, Citation2008). We used the 4-item version of the Berlin Numeracy Test, which divided the sample into quartiles according to their scores ranging from 1 to 4. 39% of participants were low in numeracy (Quartile 1: 12.2% and Quartile 2: 26.5%), whereas 61% scored high in numeracy (Quartile 3: 18.4% and Quartile 4: 42.9%, cf. Ashby, Citation2017: Quartile 1: 23.8%, Quartile 2: 32.5%, Quartile 3: 15.9% and 27,8%; but see Ghazal et al., Citation2014 for also very highly educated samples with similarly high numeracy scores). The mean was 2.92 (SD = 1.10) and thus significantly higher than in the validation samples (Cokely et al., Citation2012; M = 2.6, SD = 1.13, t(48) = 2.03, p = .02, Cohen’s d = .29). We calculated Spearman's rank-order correlations between participants’ numeracy test scores and accurate decisions to test the relation between those variables. Numeracy did not correlate with accurate decisions in the open, rs = -.12, p = .406, nor in the closed information matrices, rs = -.14, p = .357. Additionally, there was no significant correlation between numeracy and accurate decisions in the high conflict patterns: neither in Pattern 1, rs = -.25, p = .088, nor in Pattern 2, rs = -.14, p = .322. Numeracy also did not correlate with monetary gains, rs = -.18, p = .221. Note that numeracy was indeed related to the training field – 72% (23 out of 32) of high performers with a background in natural science but only 41% (7 out of 17) of high performers with a background in the arts & humanities were high in numeracy, χ²(1) = 4.41, p = .036, φ = 0.30.
Discussion
We conducted this study based on the finding that a considerable portion of adults violates the prioritisation assumption that is fundamental for rational choice theories and models of adaptive decision making – that is, they do not consistently prioritise the most relevant information in simple probabilistic inference tasks. We examined whether people who are expected to have the ability and sufficient motivation to do so achieve optimal outcomes in a probabilistic inference task. We examined high performers of our educational system, paid them generously for successful decision making to increase their motivation, and provided an easy decision paradigm. These high performers prioritised relevant over less relevant information in a non-compensatory decision environment, yielding high decision accuracy, and achieved high monetary gains. Altogether, this provides evidence that they were able to adapt to the demands of the decision environment.
Nevertheless, if we take a closer look, we found that even high-performers with high rewards for successful decisions made mistakes and showed some deviations from accurate decision-making in a low complexity environment. Variations in cue prediction patterns influenced and sometimes biased accurate decision making. Specifically, if predictions of the high-validity cue conflicted with the predictions of the low validity cues, participants had difficulty systematically prioritising the most relevant information over the less relevant information. They might have been inclined to follow the majority opinion rather than the advice of the best cue (e.g. Russo & Dosher, Citation1983; Zhang et al., Citation2006). Note that both the application of the weighted-additive rule and the application of the simple strategy would have led to decisions in line with predictions of the high-validity cue. Overweighting the importance of the low validity cues in non-compensatory environments violates expectations from both normative and descriptive models of decision making.
We will first discuss general explanations for this result before we turn to individual differences in high performers relating to research field and associated competences.
Evidence accumulation
Evidence accumulation models (EAMs) have been the most influential models of decision-making in the past decades (Evans & Wagenmakers, Citation2020; Ratcliff et al., Citation2016). There were several variations of models derived from the general EAM framework (e.g. Drift Diffusion Model, Ratcliff, Citation1978; the leaky, competing accumulator model, Usher & McClelland, Citation2001; Multialternative Decision Field Theory, Roe et al., Citation2001). According to the evidence accumulation model from Lee and Cummins (Citation2004), the lexicographic strategies (such as take-the-best) – which define the most accurate behaviour in non-compensatory decision environments – can be treated “as a sequential-sampling process that terminates as soon as any evidence in favor of a decision is found” (Lee & Cummins, Citation2004). Thus, people need a certain amount of evidence before they make a decision driven by an individual desire for decision confidence. Specifically, decision makers set an evidence threshold, which must be exceeded by confirming information. Those who use simple strategies are assumed to set a threshold that is passed by information from any single cue, whereas others are assumed to set a threshold that guarantees the processing of all cue information (Dummel et al., Citation2016). Even if the dispersion of probabilities was sufficiently strong to clarify which information should be prioritised for the most valuable evidence, when the high-validity cue pointed to an option other than the low validity cues, the evidence was perhaps perceived less strongly. Previous research showed that some people deal with conflict by integrating all available information about the options, whereas others do not even notice the conflicting information. By examining the high-validity cue only, people will not collect any other information if the predictions of the high-validity cue allow one to make a decision by discriminating between the options. Those decision makers base their decision only on part of the available information (Lee & Cummins, Citation2004; Newell & Lee, Citation2011). Newell et al. (Citation2003) found that people tended to feel uncomfortable basing their decisions on little evidence. Instead, before they chose an option, they systematically looked for confirming evidence even when it was not needed. Some participants used a strategy that weights the evidence but not according to the classical weighted additive rule. They continued to look for further information even if they discovered the discriminating cue but still did not consider all available information. In our study, it seems that participants behaved in a similar manner. They looked up twice as much information as necessary, on average, but not the whole matrix. It is likely that participants sought additional information in order to increase their confidence about the decision. In conflicting patterns, however, the additional information did not necessarily confirm the most relevant information (predictions of the high-validity cue). Potentially, the overuse of information decreased their confidence and led to the non-accurate behaviour of not choosing an option predicted by the high-validity cue.
Preference for holistic information integration
Further, it is assumed by the adaptive toolbox approach that the use of heuristics is easy and simplifies information search (Gigerenzer et al., Citation1999). However, it is not always simple (e.g. Schulze & Newell, Citation2018). Research shows that adult decision makers are able to apply such selective and simple strategies when is it necessary. But at the same time, they dislike leaving out information and are reluctant to do so, especially, if additional information can be easily obtained. As Bröder (Citation2003) showed, “it is a deliberate decision to ignore information. […] at least some people generally appear to prefer being fully informed.”. Thus, people sometimes have problems applying simple strategies. They tend to oversample and process information holistically (Betsch & Glöckner, Citation2010; Glöckner & Betsch, Citation2008; Söllner et al., Citation2014). According to the parallel constraint satisfaction model (Betsch & Glöckner, Citation2010; Glöckner et al., Citation2014; Glöckner & Betsch, Citation2008), all information that is immediately encoded can be considered in parallel in a neural network. That is, new information is linked with information stored in memory. For the most coherent mental representation, activation mechanisms are employed. The degree of this activation is influenced by the relative weight of cues. However, even information normatively regarded to be choice-irrelevant can be spontaneously integrated. Söllner et al. (Citation2014) found that even people who are trained to use only the most relevant information have difficulty ignoring information that was randomly shown by the computer and totally irrelevant for the trained strategy. The information was either consistent or inconsistent with the predictions of the high-validity cue. Instead of ignoring the additional information, it affected the participants’ decisions to the extent that they kept looking for information more frequently and were less confident in their decisions when the additional information was inconsistent with the predictions of the high-validity cue (information intrusion effect). In our study, the predictions of the high-validity cue were inconsistent with the predictions of the lower validity cues in the conflicting patterns.
Overthinking
Some participants reported thinking much about the purpose of the whole task, including questioning their own strategy (e.g. “I tried the whole time to recognise the purpose of the game and what I should do best.”). There is evidence that introspection can decrease decision accuracy. By thinking about the reasons for a decision, the focus is also on less relevant or nonoptimal criteria, which are falsely included in the decision making process (Leisti & Häkkinen, Citation2016; Tordesillas & Chaiken, Citation1999; Wilson & Schooler, Citation1991). Participating in a study might have forced participants to adjust their behaviour by assuming the use of all presented information is the required way to behave. The ambition to maximise their monetary outcomes might have additionally encouraged them to search more information than considered necessary. The processing of additional information distracted participants by indicating conflicting patterns from the essential information and led to an inappropriate use of the decision environment.
Individual differences
A goal of the study was to investigate decision accuracy in high performers with different training fields, statistical and methodological competence, and numeracy. We assumed participants from different research fields would differ according to their experiences with statistical analyses and empirical research – and that these competences would make a difference in decision accuracy beyond intelligence. We found that our participants appear to be more homogeneous in their abilities, even interdisciplinary, than expected. The fields of research do not differ concerning their training in methods and use of statistical analysis based on the self-assessment form. Thus, the distribution of statistical-methodological competence was more skewed than initially expected. Statistical-methodological competence appears to be distinct in natural scientists as well as in humanities scientists and might not be sufficiently selective. Therefore, we cannot sufficiently assess whether these abilities influence decision behaviour to an extent that it is an additional explanation for the deviating behaviour. Numeracy was also not equally distributed. However, numeracy yielded no significant differences. This could be either due to low power for group differences or indicative of a ceiling effect, because participants decided quite accurately in general.
Manipulation of cue validities
We conveyed cue validities in a two-fold fashion, which is rather uncommon in decision making research with adults. The paradigm and procedure were adopted from prior studies with children (Betsch et al., Citation2014, Citation2016, 2018). Each individual experienced the cues’ validities in a sequential prediction-outcome sampling task.Footnote6 Thereafter, the results of this learning phase were constantly presented on the computer screen during the decision phase of the study. Specifically, each validity was stated in a relative frequency format (“smart circles”) by showing the number of correct predictions made by the cue relative to the size of the learning sample. Moreover, the cues’ validities were reinforced by the feedback structure throughout the decision trials. This is also postulated in the basic literature on probabilistic inference decision making (e.g. Bröder, Citation2000; Rieskamp & Otto, Citation2006). However, one could argue that participants perceived the decision phase as a new situation unrelated to the learning phase.Footnote7 Under this assumption, the environment would be identified as (unexpectedly) uncertain (Walker et al., Citation2021) and participants might have been tempted to explore rather than exploit (e.g. Cohen et al., Citation2007; Walker et al., Citation2021). Exploration − in our study − involves an alteration between learning about the relation between cues and outcomes (i.e. learning the cue validities). Exploitation means − in our study − that the individual maximises gains by following the predictions of the high-validity cue. We cannot definitively rule out this possibility. However, for a number of reasons, we believe that this is an unlikely interpretation. First, empirical results for exploration stem from paradigms that differ substantially from the probabilistic inference paradigm used in this study. For example, participants are presented with a cue learning environment in which probabilities were never stated or learned in advance but rather had to be figured out (e.g. Walker et al., Citation2021). Second, if participants had used the decision trials for exploration, they necessarily would have arrived at a suboptimal performance level. Yet, our participants had a high level of accuracy in non-conflicting patterns. Thus, it is difficult to explain the pattern effects under this assumption. Third, we assessed a manipulation check by examining the deliberate understanding of the cue validities. The results showed that participants learned the cue validities and their hierarchical order, since they reproduced the induced probabilities in their ratings. This result converges with others using structurally similar paradigms (e.g. Bröder, Citation2000).
Overall, we believe that other factors – such as evidence accumulation, preference for holistic information integration, and following the majority – rather than exploration were responsible for participants’ lack of prioritising the high-validity cue in prediction patterns in which the majority voted against it.
Conclusion
In conclusion, our findings showed that high performers prioritised relevant over less relevant information in a non-compensatory decision environment, yielded high decision accuracy, and achieved high monetary gains. However, consistently prioritising the relevant information was difficult – even when people were cognitively able and motivated and the environment was low in complexity. Variations in cue prediction patterns influenced decision accuracy. When the environment did not include conflicting information, prioritisation was quite simple. However, when the environment held conflicting information, participants had difficulty systematically prioritising the most relevant information over less relevant information. The overuse of information resulted in deviations from accurate decision making.
Acknowledgements.
We would like to thank our research assistants Nele-Sophie Boße, Jacqueline Elbert, Katharina Förster, and Alisa Stelzel for data collection and Heather Fiala for proofreading the manuscript.
Data availability statement
The data that support the findings of this study and the preregistration are openly available on the OSF: https://osf.io/z2cha/
Disclosure statement
No potential conflict of interest was reported by the author(s).
Additional information
Funding
Notes
1 We expect that people who professionally perform empirical research and statistical analyses should have advanced skills in statistical numeracy, critical thinking, scientific thinking, and probabilistic reasoning (cf. Cokely et al., Citation2012; Dunbar & Fugelsang, Citation2005) compared to those without such experience (cf. Kagan, Citation2009). Therefore, participants should vary concerning their statistical-methodological competence.
2 The experiment was preregistered. We also preregistered hypotheses concerning the information search and cognitive variables, which we do not address in this paper.
3 Following the suggestions of Rosenthal and Rosnow (Citation1985) and previous research (e.g., Betsch et al., Citation2014, Citation2016; Bröder, Citation2000), we preregistered the use of ANOVAs for analysing proportions.
4 As previously stated, the a priori calculated sample size for these analyses could not be reached. The post-hoc power analysis revealed a power of 53% to detect medium sized effects for this group differences.
5 Most data for both groups were not normally distributed, as assessed by the Shapiro-Wilk test (p < .05), presumably due to sample size. Consequently, we conducted both t-Tests for independent samples and Mann-Whitney-U-Tests, since t-Tests are robust to nonnormality (c.f. Wilcox, Citation2012) but the sample size of scientists from the arts & humanities is < 30. However, the analyses yielded the same overall results, which is why we only present the results of the t-Tests here.
6 The experimenter verbally stated: “First, you can find out how smart the advisors are so you know how well they can help you with your treasure hunt.”. The experimenter continued: “Here, you see a house with either a treasure or a spider hidden in it. The advisors will tell you what is hidden in there. But they are not always right, so now you can find out how often the advisors are right.”. After each learning phase the experimenter said: “So, now you know how smart advisor [1,2,3] is.”.
7 We thank an anonymous reviewer for mentioning this point.
References
- Ashby, N. J. S. (2017). Numeracy predicts preference consistency: Deliberative search heuristics increase choice consistency for choices from description and experience. Judgment and Decision Making, 12(2), 128–139.
- Ayal, S., & Hochman, G. (2009). Ignorance or integration: The cognitive processes underlying choice behavior. Journal of Behavioral Decision Making, 22(4), 455–474. https://doi.org/https://doi.org/10.1002/bdm.642
- Beach, L. R., & Mitchell, T. R. (1978). A contingency model for the selection of decision strategies. The Academy of Management Review, 3(3), 439–449. https://doi.org/https://doi.org/10.2307/257535
- Bergert, F. B., & Nosofsky, R. M. (2007). A response-time approach to comparing generalized rational and take-the-best models of decision making. Journal of Experimental Psychology: Learning, Memory, and Cognition, 33(1), 107–129. https://doi.org/https://doi.org/10.1037/0278-7393.33.1.107
- Betsch, T., & Glöckner, A. (2010). Intuition in judgment and decision making: Extensive thinking without effort. Psychological Inquiry, 21(4), 279–294. https://doi.org/https://doi.org/10.1080/1047840X.2010.517737
- Betsch, T., Lang, A., Lehmann, A., & Axmann, J. M. (2014). Utilizing probabilities as decision weights in closed and open information boards: A comparison of children and adults. Acta Psychologica, 153, 74–86. https://doi.org/https://doi.org/10.1016/j.actpsy.2014.09.008
- Betsch, T., Lehmann, A., Jekel, M., Lindow, S., & Glöckner, A. (2018). Children’s application of decision strategies in a compensatory environment. Judgment and Decision Making, 13(6), 514–528.
- Betsch, T., Lehmann, A., Lindow, S., Lang, A., & Schoemann, M. (2016). Lost in search: (Mal-)adaptation to probabilistic decision environments in children and adults. Developmental Psychology, 52(2), 311–325. https://doi.org/https://doi.org/10.1037/dev0000077
- Bhatia, S. (2017). Choice rules and accumulator networks. Decision, 4(3), 146–170. https://doi.org/https://doi.org/10.1037/dec0000038
- Bröder, A. (2000). Assessing the empirical validity of the "take-the-best" heuristic as a model of human probabilistic inference. Journal of Experimental Psychology: Learning, Memory, and Cognition, 26(5), 1332–1346. https://doi.org/https://doi.org/10.1037/0278-7393.26.5.1332
- Bröder, A. (2003). Decision making with the "adaptive toolbox": Influence of environmental structure, intelligence, and working memory load. Journal of Experimental Psychology: Learning, Memory, and Cognition, 29(4), 611–625. https://doi.org/https://doi.org/10.1037/0278-7393.29.4.611
- Bröder, A., & Gaissmaier, W. (2007). Sequential processing of cues in memory-based multiattribute decisions. Psychonomic Bulletin & Review, 14(5), 895–900. https://doi.org/https://doi.org/10.3758/BF03194118
- Bröder, A., & Newell, B. R. (2008). Challenging some common beliefs: Empirical work within the adaptive toolbox metaphor. Judgment and Decision Making, 3(3), 205–214.
- Bröder, A., & Schiffer, S. (2006). Adaptive flexibility and maladaptive routines in selecting fast and frugal decision strategies. Journal of Experimental Psychology: Learning, Memory, and Cognition, 32(4), 904–918. https://doi.org/https://doi.org/10.1037/0278-7393.32.4.904
- Bruine de Bruin, W., Parker, A. M., & Fischhoff, B. (2007). Individual differences in adult decision-making competence. Journal of Personality and Social Psychology, 92(5), 938–956. https://doi.org/https://doi.org/10.1037/0022-3514.92.5.938
- Butler, H. A. (2012). Halpern critical thinking assessment predicts real-world outcomes of critical thinking. Applied Cognitive Psychology, 26(5), 721–729. https://doi.org/https://doi.org/10.1002/acp.2851
- Butler, H. A., Pentoney, C., & Bong, M. P. (2017). Predicting real-world outcomes: Critical thinking ability is a better predictor of life decisions than intelligence. Thinking Skills and Creativity, 25, 38–46. https://doi.org/https://doi.org/10.1016/j.tsc.2017.06.005
- Cohen, J. D., McClure, S. M., & Yu, A. J. (2007). Should I stay or should I go? How the human brain manages the trade-off between exploitation and exploration. Philosophical Transactions of the Royal Society B: Biological Sciences, 362(1481), 933–942. https://doi.org/https://doi.org/10.1098/rstb.2007.2098
- Cokely, E. T., Feltz, A., Ghazal, S., Allan, J. N., Petrova, D., & Garcia-Retamero, R. (2018). Skilled decision theory: From intelligence to numeracy and expertise. In K. A. Ericsson, R. R. Hoffman, A. Kozbelt, & A. M. Williams (Eds.), Cambridge handbooks in psychology. The Cambridge handbook of expertise and expert performance (pp. 476–505). Cambridge University Press.
- Cokely, E. T., Galesic, M., Schulz, E., Ghazal, S., & Garcia-Retamero, R. (2012). Measuring risk literacy: The Berlin numeracy test. Judgment and Decision Making, 7(1), 25–47.
- Cokely, E. T., & Kelley, C. M. (2009). Cognitive abilities and superior decision making under risk: A protocol analysis and process model evaluation. Judgment and Decision Making, 4(1), 20–33.
- Costello, F., & Watts, P. (2014). Surprisingly rational: Probability theory plus noise explains biases in judgment. Psychological Review, 121(3), 463–480. https://doi.org/https://doi.org/10.1037/a0037010
- Dougherty, M. R., Franco-Watkins, A. M., & Thomas, R. (2008). Psychological plausibility of the theory of probabilistic mental models and the fast and frugal heuristics. Psychological Review, 115(1), 199–211. https://doi.org/https://doi.org/10.1037/0033-295X.115.1.199
- Dummel, S., Rummel, J., & Voss, A. (2016). Additional information is not ignored: New evidence for information integration and inhibition in take-the-best decisions. Acta Psychologica, 163, 167–184. https://doi.org/https://doi.org/10.1016/j.actpsy.2015.12.001
- Dunbar, K., & Fugelsang, J. (2005). Scientific thinking and reasoning. In K. J. Holyoak, & R. G. Morrison (Eds.), The Cambridge handbook of thinking and reasoning (pp. 705–725). Cambridge University Press.
- Eeckhoudt, L., Gollier, C., & Schlesinger, H. (2011). Economic and financial decisions under risk. Princeton University Press.
- Evans, N. J., & Wagenmakers, E.-J. (2020). Evidence accumulation models: Current limitations and future directions. The Quantitative Methods for Psychology, 16(2), 73–90. https://doi.org/https://doi.org/10.20982/tqmp.16.2.p073
- Faul, F., Erdfelder, E., Lang, A.-G., & Buchner, A. (2007). G*power 3: A flexible statistical power analysis program for the social, behavioral, and biomedical sciences. Behavior Research Methods, 39(2), 175–191. https://doi.org/https://doi.org/10.3758/BF03193146
- Festjens, A., Bruyneel, S., Diecidue, E., & Dewitte, S. (2015). Time-based versus money-based decision making under risk: An experimental investigation. Journal of Economic Psychology, 50, 52–72. https://doi.org/https://doi.org/10.1016/j.joep.2015.07.003
- Frisch, D., & Baron, J. (1988). Ambiguity and rationality. Journal of Behavioral Decision Making, 1(3), 149–157. https://doi.org/https://doi.org/10.1002/bdm.3960010303
- Ghazal, S., Cokely, E. T., & Garcia-Retamero, R. (2014). Predicting biases in very highly educated samples: Numeracy and metacognition. Judgment and Decision Making, 9(1), 15–34.
- Gigerenzer, G. (2008). Why heuristics work. Perspectives on Psychological Science, 3(1), 20–29. https://doi.org/https://doi.org/10.1111/j.1745-6916.2008.00058.x
- Gigerenzer, G., & Goldstein, D. G. (1996). Reasoning the fast and frugal way: Models of bounded rationality. Psychological Review, 103(4), 650–669. https://doi.org/https://doi.org/10.1037/0033-295X.103.4.650
- Gigerenzer, G., & Selten, R. (2001). Bounded rationality: The adaptive toolbox. MIT Press.
- Gigerenzer, G., Todd, P. M., & The ABC Research Group (1999). Simple heuristics that make us smart. Oxford University Press.
- Glöckner, A., & Betsch, T. (2008). Multiple-reason decision making based on automatic processing. Journal of Experimental Psychology: Learning, Memory, and Cognition, 34(5), 1055–1075. https://doi.org/https://doi.org/10.1037/0278-7393.34.5.1055
- Glöckner, A., Hilbig, B. E., & Jekel, M. (2014). What is adaptive about adaptive decision making? A parallel constraint satisfaction account. Cognition, 133(3), 641–666. https://doi.org/https://doi.org/10.1016/j.cognition.2014.08.017
- Hoffrage, U., Krauss, S., Martignon, L., & Gigerenzer, G. (2015). Natural frequencies improve Bayesian reasoning in simple and complex inference tasks. Frontiers in Psychology, 6(Article 1473), https://doi.org/https://doi.org/10.3389/fpsyg.2015.01473
- Jackson, S. A., Kleitman, S., Stankov, L., & Howie, P. (2017). Individual differences in decision making depend on cognitive abilities, monitoring and control. Journal of Behavioral Decision Making, 30(2), 209–223. https://doi.org/https://doi.org/10.1002/bdm.1939
- Jasper, J. D., Bhattacharya, C., & Corser, R. (2017). Numeracy predicts more effortful and elaborative search strategies in a complex risky choice context: A process-tracing approach. Journal of Behavioral Decision Making, 30(2), 224–235. https://doi.org/https://doi.org/10.1002/bdm.1934
- Jekel, M., Glöckner, A., Fiedler, S., & Bröder, A. (2012). The rationality of different kinds of intuitive decision processes. Synthese, 189(1), 147–160. https://doi.org/https://doi.org/10.1007/s11229-012-0126-7
- Juslin, P., & Persson, M. (2002). PROBabilities from EXemplars (PROBEX): a “lazy” algorithm for probabilistic inference from generic knowledge. Cognitive Science, 26(5), 563–607. https://doi.org/https://doi.org/10.1207/s15516709cog2605_2
- Kagan, J. (2009). The three cultures: Natural sciences, social sciences and the humanities in the 21st century. Cambridge University Press.
- Kahneman, D., & Tversky, A. (1979). Prospect theory: An analysis of decision under risk. Econometrica, 47(2), 263–291. https://doi.org/https://doi.org/10.2307/1914185
- Kämmer, J. E., Gaissmaier, W., & Czienskowski, U. (2013). The environment matters: Comparing individuals and dyads in their adaptive use of decision strategies. Judgment and Decision Making, 8(3), 299–329.
- Lee, M. D., Blanco, G., & Bo, N. (2017). Testing take-the-best in new and changing environments. Behavior Research Methods, 49(4), 1420–1431. https://doi.org/https://doi.org/10.3758/s13428-016-0798-x
- Lee, M. D., & Cummins, T. D. R. (2004). Evidence accumulation in decision making: Unifying the “take the best” and the “rational” models. Psychonomic Bulletin & Review, 11(2), 343–352. https://doi.org/https://doi.org/10.3758/BF03196581
- Lehman, D. R., & Nisbett, R. E. (1990). A longitudinal study of the effects of undergraduate training on reasoning. Developmental Psychology, 26(6), 952–960. https://doi.org/https://doi.org/10.1037/0012-1649.26.6.952
- Leisti, T., & Häkkinen, J. (2016). The effect of introspection on judgment and decision making is dependent on the quality of conscious thinking. Consciousness and Cognition, 42, 340–351. https://doi.org/https://doi.org/10.1016/j.concog.2016.04.008
- Leshowitz, B., DiCerbo, K. E., & Okun, M. A. (2002). Effects of instruction in methodological reasoning on information evaluation. Teaching of Psychology, 29(1), 5–10. https://doi.org/https://doi.org/10.1207/S15328023TOP2901_02
- Levin, I. P., Weller, J. A., Pederson, A. A., & Harshman, L. A. (2007). Age-related differences in adaptive decision making: Sensitivity to expected value in risky choice. Judgment and Decision Making, 2(4), 225–233.
- March, J. G. (1978). Bounded rationality, ambiguity, and the engineering of choice. The Bell Journal of Economics, 9(2), 587–603. https://doi.org/https://doi.org/10.2307/3003600
- Newell, B. R., Lagnado, D. A., & Shanks, D. R. (2015). Straight choices: The psychology of decision making. Psychology Press.
- Newell, B. R., & Lee, M. D. (2011). The right tool for the job? Comparing an evidence accumulation and a naive strategy selection model of decision making. Journal of Behavioral Decision Making, 24(5), 456–481. https://doi.org/https://doi.org/10.1002/bdm.703
- Newell, B. R., & Shanks, D. R. (2003). Take the best or look at the rest? Factors influencing "one-reason" decision making. Journal of Experimental Psychology: Learning, Memory, and Cognition, 29(1), 53–65. https://doi.org/https://doi.org/10.1037/0278-7393.29.1.53
- Newell, B. R., Weston, N. J., & Shanks, D. R. (2003). Empirical tests of a fast-and-frugal heuristic: Not everyone “takes-the-best”. Organizational Behavior and Human Decision Processes, 91(1), 82–96. https://doi.org/https://doi.org/10.1016/S0749-5978(02)00525-3
- Payne, J. W. (1982). Contingent decision behavior. Psychological Bulletin, 92(2), 382–402. https://doi.org/https://doi.org/10.1037/0033-2909.92.2.382
- Payne, J. W., Bettman, J. R., & Johnson, E. J. (1988). Adaptive strategy selection in decision making. Journal of Experimental Psychology: Learning, Memory, and Cognition, 14(3), 534–552. https://doi.org/https://doi.org/10.1037/0278-7393.14.3.534
- Payne, J. W., Bettman, J. R., & Johnson, E. J. (1993). The adaptive decision maker. Cambridge University Press.
- Pertl, M.-T., Zamarian, L., & Delazer, M. (2017). Reasoning and mathematical skills contribute to normatively superior decision making under risk: Evidence from the game of dice task. Cognitive Processing, 18(3), 249–260. https://doi.org/https://doi.org/10.1007/s10339-017-0813-x
- Peters, E., Västfjäll, D., Slovic, P., Mertz, C. K., Mazzocco, K., & Dickert, S. (2006). Numeracy and decision making. Psychological Science, 17(5), 407–413. https://doi.org/https://doi.org/10.1111/j.1467-9280.2006.01720.x
- Ratcliff, R. (1978). A theory of memory retrieval. Psychological Review, 85(2), 59–108. https://doi.org/https://doi.org/10.1037/0033-295X.85.2.59
- Ratcliff, R., Smith, P. L., Brown, S. D., & McKoon, G. (2016). Diffusion decision model: Current issues and history. Trends in Cognitive Sciences, 20(4), 260–281. https://doi.org/https://doi.org/10.1016/j.tics.2016.01.007
- Reyna, V. F., & Brainerd, C. J. (2008). Numeracy, ratio bias, and denominator neglect in judgments of risk and probability. Learning and Individual Differences, 18(1), 89–107. https://doi.org/https://doi.org/10.1016/j.lindif.2007.03.011
- Rieskamp, J., & Hoffrage, U. (2008). Inferences under time pressure: How opportunity costs affect strategy selection. Acta Psychologica, 127(2), 258–276. https://doi.org/https://doi.org/10.1016/j.actpsy.2007.05.004
- Rieskamp, J., & Otto, P. E. (2006). Ssl: A theory of how people learn to select strategies. Journal of Experimental Psychology: General, 135(2), 207–236. https://doi.org/https://doi.org/10.1037/0096-3445.135.2.207
- Roe, R. M., Busemeyer, J. R., & Townsend, J. T. (2001). Multialternative decision field theory: A dynamic connectionst model of decision making. Psychological Review, 108(2), 370–392. https://doi.org/https://doi.org/10.1037/0033-295X.108.2.370
- Rosenthal, R., & Rosnow, R. L. (1985). Contrast analysis: Focused comparisons in the analysis of variance. Cambridge University Press.
- Russo, J. E., & Dosher, B. A. (1983). Strategies for multiattribute binary choice. Journal of Experimental Psychology: Learning, Memory, and Cognition, 9(4), 676–696. https://doi.org/https://doi.org/10.1037/0278-7393.9.4.676
- Savage, L. J. (1954). The foundations of statistics. Wiley.
- Schulze, C., & Newell, B. R. (2018). Decision making under risk: An experience-based perspective. In L. J. Ball, & V. A. Thompson (Eds.), The Routledge international handbook series. The Routledge international handbook of thinking and reasoning (pp. 502–522). Routledge/Taylor & Francis Group.
- Simon, H. A. (1982). Models of bounded rationality. MIT Press.
- Söllner, A., Bröder, A., Glöckner, A., & Betsch, T. (2014). Single-process versus multiple-strategy models of decision making: Evidence from an information intrusion paradigm. Acta Psychologica, 146, 84–96. https://doi.org/https://doi.org/10.1016/j.actpsy.2013.12.007
- Söllner, A., Bröder, A., & Hilbig, B. E. (2013). Deliberation versus automaticity in decision making: Which presentation format features facilitate automatic decision making? Judgment and Decision Making, 8(3), 278–298.
- Stanovich, K. E. (2016). The comprehensive assessment of rational thinking. Educational Psychologist, 51(1), 23–34. https://doi.org/https://doi.org/10.1080/00461520.2015.1125787
- Stanovich, K. E., & West, R. F. (1998). Individual differences in rational thought. Journal of Experimental Psychology: General, 127(2), 161–188. https://doi.org/https://doi.org/10.1037/0096-3445.127.2.161
- Stanovich, K. E., & West, R. F. (2000). Individual differences in reasoning: Implications for the rationality debate? Behavioral and Brain Sciences, 23(5), 645–665. https://doi.org/https://doi.org/10.1017/S0140525X00003435
- Tordesillas, R. S., & Chaiken, S. (1999). Thinking too much or too little? The effects of introspection on the decision-making process. Personality and Social Psychology Bulletin, 25(5), 625–631. https://doi.org/https://doi.org/10.1177/0146167299025005007
- Tversky, A., & Kahneman, D. (1981). The framing of decisions and the psychology of choice. Science, 211(4481), 453–458. https://doi.org/https://doi.org/10.1126/science.7455683
- Tversky, A., & Kahneman, D. (1986). Rational choice and the framing of decisions. The Journal of Business, 59(4), S251–S278. https://doi.org/https://doi.org/10.1086/296365
- Usher, M., & McClelland, J. L. (2001). The time course of perceptual choice: The leaky, competing accumulator model. Psychological Review, 108(3), 550–592. https://doi.org/https://doi.org/10.1037/0033-295X.108.3.550
- Vlaev, I., Chater, N., & Stewart, N. (2007). Relativistic financial decisions: Context effects on retirement saving and investment risk preferences. Judgment and Decision Making, 2(5), 292–311.
- Von Neumann, J., & Morgenstern, O. (1944). Theory of gamesand economic behavior. Princeton University Press.
- Walker, A. R., Navarro, D. J., Newell, B. R., & Beesley, T. (2021). Protection from uncertainty in the exploration/exploitation trade-off. Journal of Experimental Psychology: Learning, Memory, and Cognition. Advance online publication, https://doi.org/https://doi.org/10.1037/xlm0000883
- Wilcox, R. R. (2012). Introduction to robust estimation and hypothesis testing. Statistical modeling and decision science (3. Ed.). Academic Press.
- Wilson, T. D., & Schooler, J. W. (1991). Thinking too much: Introspection can reduce the quality of preferences and decisions. Journal of Personality and Social Psychology, 60(2), 181–192. https://doi.org/https://doi.org/10.1037/0022-3514.60.2.181
- Zhang, J., Hsee, C. K., & Xiao, Z. (2006). The majority rule in individual decision making. Organizational Behavior and Human Decision Processes, 99(1), 102–111. https://doi.org/https://doi.org/10.1016/j.obhdp.2005.06.004
Appendix
Table A Means and Standard Deviations of Accurate Decisions by Research Field