
Abstract
Health care is in crisis today: costs are rising, demand exceeds supply, quality is questioned and patient wait times are excessive while providers and staff are simultaneously overworked and frustrated. No one has a comprehensive system solution to providing more, cheaper, better, and faster health care, even in primary care practices, the first link in the health care supply chain. Additionally, this link like others frequently experiences the combination of complexity, uncertainty, and local optimisation simultaneously to create a chaotic environment. Health care problems have been called ill-structured (also “wicked”) and because of their tangled web of stakeholders with different and conflicting objectives defy traditional optimisation research methodologies. Proper design and management of the provider appointment scheduling system (PASS) provides a direction for a win–win health care solution (more, cheaper, better, and faster). Our objective is to provide a generic strawman process for developing a robust PASS for most environments. A theory of constraints thinking processes (TP) analysis was conducted on the academic research using a primary care practice to validate both entity and causality existence. From this integrated analysis, a robust process for designing a PASS resulted. Last, we show that Goldratt’s TP provides a logical, rigorous framework for qualitative research and design science.
1. Introduction
Why is the outpatient appointment scheduling problem so important? Health care is in a crisis. Patient demand is increasing and far exceeds provider resources (Dettmer, Citation2018; Merritt Hawkins, Citation2017b; Thomas, Citation2015). Many health care environments are chaotic (Perez et al., Citation2017; Singh, Cohen, & May, Citation1977). Health care costs are rising worldwide. Knight (Citation2014) provides an overview of the crisis of rising health care costs across a number of countries including the US, UK, India, etc., based on newspaper articles, government reports, and other sources. To address this world-wide problem, we must provide more, faster, better, and timely health care with the same or fewer resources at the primary care level. Designing an effective appointment system (called a provider appointment scheduling (and execution) systems (PASS) by us) is the key to meeting this increasing patient demand. The use of the term PASS needs some explanation. In a medical practice, the PASS includes a schedule template (appointment book) indicating the number, types, and timing of daily appointments and extends up to a year into the future. The PASS also includes the practice rules, provider rules, and government and insurance timing restrictions on appointment types. In contrast, in academic research the PASS (called the traditional PASS where needed) usually assumes all of these restrictions are non-existent for ease of computation. Generally equal interval appointments are used with no distinction made among appointment types and their timings. The proposed PASS is based on a TOC analysis and included all of the restrictions placed on the actual practice. It also includes execution of the PASS. The reader should easily be able to distinguish the PASS being discussed by the context.
Why is primary care viewed as important? In many health care systems primary care providers are viewed as the gatekeepers of the health care system, the preferred first contact for a patient. Based on an extensive literature review and analysis to determine the contribution of primary care to health systems and health within and across countries, Starfield, Shi, and Macinko (Citation2005, p. 457) describe the importance of primary care providers in preventing “illness and death, regardless of whether the care is characterised by supply of primary care physicians, a relationship with a source of primary care, or the receipt of important features of primary care”. While the statistics vary widely and are collected from different sources and for different time periods, in US alone, as high as 80% (Doyle, Citation2013) of the 136 million patients (Faye, Citation2017) visiting the emergency department (ED) annually would not have had to go to the ED if they had a primary care provider, had seen a primary care provider in a timely manner or the federal law was changed requiring hospitals to treat any patient no matter their ability to pay! The average cost of a ED visit for a sample of “over 8000 patients across the US was $2168” (Abrams, Citation2013) versus a primary care visit cost of $160 (Saloner, Polsky, Kenney, Hempstead, & Rhodes, Citation2015). These numbers provide a rough but high estimate of the cost of this problem.
The current value of the academic appointment scheduling literature is disappointing. The appointment scheduling problem has been studied in various health care environments (primary care clinics, specialty care practices, hospitals, emergency departments, elective surgeries, for-profit, for-purpose, in various settings, private pay, universal pay in various countries) in several hundred academic articles and a couple hundred practitioner articles. Based on the volume of this literature, the existence and universality of the problem seems obvious. The search for an effective solution to this appointment scheduling problem has been conducted for 65 years and because of its ill-structured nature it remains seemingly unsolved. In the early 1950’s Lindley (Citation1952) and Bailey (Citation1954) identified and studied the problem using queuing theory to model the arrival and service patterns of patients and providers, respectively. Today, some researchers (Green & Savin, Citation2008, Citation2010; Hassin & Mendel, Citation2008; Kozlowski & Worthington, Citation2015) are still examining this problem use queuing theory while other researchers are using a variety of mathematical programming (Wright, Bretthauer, & Cote, Citation2006; Liang, Turkcan, Ceyhan, & Stuart, Citation2015, Samorani and LaGanga, Citation2015) and simulation techniques (Bard et al., Citation2016; Brailsford, Lattimer, Tarnaras, & Turnbull, Citation2004; Katz, Citation1969; Klassen & Rohleder, Citation1996). Past researchers particularly those conducting literature reviews (Ahmadi-Javid, Jalali, & Klassen, Citation2017; Cayirli & Veral, Citation2003; Wu, Khasawneh, Hao, & Gao, Citation2013) support these comments: those using mathematical programming techniques have identified and studied one or two problems (sometimes with data extracted from a real clinic setting) in isolation and have made recommendations to address that problem set (sometimes for a situation-specific environment). However, arguably no researchers have provided a simple generalisable comprehensive system solution to the many problems existing in a sometimes chaotic health care setting (an environment where complexity, uncertainty and local optima exist simultaneously).
Why is solving these problems so difficult? Some researchers (Lowes, Citation2008; Singh et al., Citation1977) call this problem chaotic; others (Robinson & Chen, Citation2003) call it intractable; still others (Peterson, Citation2016) go further and call it a wicked problem (Churchman, Citation1967; Rittel & Webber, Citation1973). In theory of constraints (TOC) terminology, a major situation that has existed a long time and still remains unsolved despite many attempts is called a chronic conflict or problem (Cox, Boyd, Sullivan, Reed, & Cartier, Citation2012).
A brief description of a medical practice environment provides a better understanding of the nature of this problem. This description is based on an actual practice and the various problems are documented in the literature review as existing in other practice environments. In a medical practice, a patient (or potential patient) calls to the practice or is exiting the practice and attempts to set a time for a new appointment. The scheduler receives the request and identifies the patient, the nature or type of appointment desired (physical, routine visit, follow-up visit, acute visit, etc.) and the desired appointment time. The scheduler then tries to schedule the patient appointment request into the existing vacancies in the provider scheduling template (appointment book). The length of time until the appointment time (sometimes called indirect wait time in the academic literature) may differ depending on whether it is a new or established patient and whether it is a Medicare or insured patient (based on regulations). The scheduling environment is constantly changing; patients cancel appointments, patients don’t show up for appointments, patients call in with acute problems and patients walk in to the practice needing immediate attention. Similarly, during the execution of today’s schedule, interruptions occur in each step of the patient-provider process from check-in to patient preparation, provider processing, and check-out, thus delaying this and following patients. Providers start a consultation to find that they are missing information. Consultations are extended to run tests, etc. Patients wait long past their designated appointment time (sometimes called direct wait time) to see the provider. All employees are working as hard as they can to do their specific tasks as efficiently as possible despite these interruptions. The environment is complex and uncertain, chaotic if these factors have high frequencies. In addition, medical schedulers and receptionists are frequently high school graduates or have passed the GED test (General Equivalency Diploma test) (Learn.org, Citation2018) and have never taken a course in scheduling or higher mathematics. Finally, patients, providers, practice partners, clinical staff, business staff, insurance companies, and government agencies are all stakeholders each with different perspectives and goals involved in arriving at a scheduling solution.
Maybe, a different approach and different methodology is needed to solve this type of problem. TOC has proven to be useful in analysing ill-defined and ill-structured chronic problems across a wide variety of organisations from a systems perspective (Mabin & Balderstone, Citation2000, Citation2003). TOC (Cox et al., Citation2012, p. 119) is
A holistic management philosophy developed by Dr Eliyahu M. Goldratt that is based on the principle that complex systems exhibit inherent simplicity, i.e., even a very complex system made up of thousands of people and pieces of equipment can have at any given time only a very, very small number of variables – perhaps only one (known as a constraint) – that actually limit the system’s ability to generate more goal units.
Change question sequence (CQS)
Buffer management (BM)
Five focusing steps (5FS)
What is the contribution of this research? In this research the final objective is to provide a strawman process (draft proposal for review, modification and improvement) for developing a robust PASS. To achieve this objective, the purposes of this paper are fourfold. First, we provide a brief and focused review and critique of past academic and practitioner contributions to identify the researcher’s objectives and requirements, the problem studied and any significant results thought useful in constructing an effective PASS. The TOC PASS represents a scheduling process providing a systems approach to effective scheduling and execution considering the various stakeholders (such as the provider supply and patient demand perspectives). Second, we use the TOC thinking processes (TP) to identify and address the core problem(s) of appointment scheduling. While most academic literature recognises the objective and requirements for an effective scheduling system, many academics then study only a specific or a few problems in isolation (a reductionist approach), while others take a wider view of the problem using simulation or cognitive mapping but none provide a generic process for designing an effective PASS for other environments. In analysing the appointment scheduling literature we separate the problems identified into those problems (called undesirable effects or UDEs in TOC terminology; they are symptoms of the system’s core problem) caused by poor schedule design and those problems caused by poor schedule execution. This is similar to Goldratt’s (with Schragenheim and Ptak) view (Citation2000 ch. 10) of treating planning and execution as separate functions. In this paper, we analyse only the schedule design UDEs (planning). In a second paper, we examine the UDEs caused by schedule execution. The academic literature fails to recognise this distinction and classifies all problems as schedule issues. Third, based on the researchers’ objectives, requirements and the problems (UDEs) studied, a causal diagram linking the core problem to the UDEs, called a current reality tree (CRT), was constructed and a case study of a large family practice medical clinic was then used to validate the existence and causality of the UDEs to provide a broad foundation (showing the universality of the UDEs across very different environments) for us to propose a robust methodology for developing a PASS for other environments. Last, we show that the use of the TOC POOGI, particularly the CQS, to design a PASS provides a logical and rigorous foundation to strengthen qualitative research and design science.
The sequence of events: Action research then academic research: A different (unplanned) research approach is presented here. The impetus for conducting this research was a need expressed by a new partner in a large family medical practice. In late summer (August 2010), the daughter and son-in-law (both MDs in a large family practice clinic) of the first author were on their summer family beach vacation. The son-in-law had recently bought into the practice as a partner only to realise that it was not a wise investment: profits were low to non-existent, health care was not viewed as timely and excellent, and employees’ morale was low. The providers asked the first author (a retired operations management faculty who had taught and researched theory of constraint (TOC) for twenty + years prior to retirement) if TOC could be applied to the practice to improve practice performance in such a chaotic environment. With an affirmative answer, the implementation started in early September and lasted about six months with the author developing new methods (based on TOC) and materials to Socratically teach the application of the three POOGI in a medical practice. The new partner (and his wife) and the author conducted workshops to involved clinical staff and the new partner championed the implementation. The organisation results were significant and almost immediate: profits went from marginal to revenues increased 36% (ordinary income 56%); partners felt the practice wasn’t providing excellent and timely health care to significant improvements with acute patients being given same-day appointments; the practice proactively seeking out chronic patients, etc.; and employees once viewed by the partners as under-educated, untrained, and unmotivated to suddenly becoming just the opposite as they were actively involved in the implementation and were financially rewarded. In the initial data gathering of the implementation, each of seven partners (four physicians completed the questionnaire; another was retiring and two physician assistants shared one partner share) was asked to complete a TOC storyline questionnaire (in their role as an owner of the practice) to determine their perceptions of the major problem blocking the practice from achieving its goal of providing excellent health care to the community at a profit. As a second part of the data gathering some of the practice’s schedulers, receptionists, providers and medical assistants were asked similar questions to identify and describe the biggest problems blocking them in their specific roles from achieving the practice’s goal. Using this qualitative information, the author and partner built logic diagrams (evaporating clouds and current reality branches and later future reality trees) to better understand different stakeholders’ perspectives concerning the problems causing the current environment. This analysis provided the solution for the practice implementation.
In 2012 the action research was presented at an international TOCICO (Theory of Constraints International Certification Organisation) conference to both validate the TOC solution and determine how better to improve it as the audience was composed of the top TOC experts in the world. After the 2012 TOCICO presentation in an attempt to improve upon the implemented TOC solution the author decided to examine the academic (and practitioner) literature to determine what established and better solutions existed. This paper describes the author’s journey after the action research presentation. Review of several hundred abstracts and articles revealed a common researcher objective and requirements were studied; fourteen problems were studied; and no systemic sustainable solutions to the PASS design and execution problem were found. The author then decided to use the action research and literature critique in a quite different approach to both developing a generic process for building an effective PASS and an approach to strengthening the generalisability of qualitative research. The author iterated back and forth (abductive logic) from the logical analysis of the literature to the medical practice to check the UDE existence and causalities (two of the categories of legitimate reservation (CLR), rules of logic used to strengthen the logic of arguments. For a detailed presentation of these rules, see Scheinkopf (Citation1999, Citation2010), Cox and Robinson (Citation2017)) of the UDEs to the core problem and from the practice solution to the future state (now after implementation the current state in the practice). In late summer of 2015 after the literature review and analysis the first author formally audited the practice to determine the sustainability of the implementation and practice improvements and to determine if the fourteen problems identified in the literature had existed prior to the TOC implementation and had been eliminated/reduced with the implementation. This analysis was performed to validate causality existence.
This approach is similar to the means and ends approach in design science (Huppatz, Citation2015) in which one determines the current and desired states and how to move from one to the other. The TOC TP use logic to surface underlying assumptions in the current state (the CRT) and by challenging the assumptions identifies primary and secondary actions (called injections) to build an effective solution to the core problem and UDEs to move to the future state (the FRT).
2. Appointment scheduling literature review
The differences between the realities of an outpatient medical practice and academic research on this environment are startling. A review of the literature on outpatient appointment scheduling identified a large number of both academic and practitioner articles. We provide a brief review of the authors’ research objectives, the requirements (necessary conditions) that must be met to achieve the objective, and the problems studied and then critique this literature.
Over the years, a number of researchers (Ahmadi-Javid et al., Citation2017; Cayirli & Veral, Citation2003; Flagle, Citation1962; Gupta & Denton, Citation2008; Macharia, Leon, Rowe, Stephenson, & Haynes, Citation1992; Mageshwari & Kanaga, Citation2012; Rais & Viana, Citation2011; Wu et al., Citation2013) have reviewed this literature and categorised it based on research methodology used and on the specific problems studied. Most optimisation researchers (Ahmadi-Javid et al., Citation2017) address one or a couple problems existing in isolation in a specific health care environment but usually fail to capture the realities of that environment (different appointment types, physician preferences for appointment mix and sequence, changes in patient demand, different time intervals for appointments, etc.). Of the numerous studies conducted few models have actually been successfully implemented and fewer operate in the studied environment or have been implemented and operate in other health care environments. Models that have been implemented are organisation-specific and not transferrable to other organisations. Researchers (Cayirli & Veral, Citation2003; Wu et al., Citation2013) criticise the current literature as failing to develop general guidelines that can be applied to design appointment scheduling systems for most environments. In an attempt to address this shortcoming, we examine the researchers’ objectives, requirements and problems studied in several appointment scheduling literature review articles and use this analysis as a basis for conducting the TP analysis.
2.1. Academic researchers’ objectives and necessary conditions
In the appointment scheduling literature the researchers’ objectives and the requirements (necessary conditions) to achieve the objective are quite similar across most academic studies: Soriano (Citation1966, p. 389) states the problem as “designing an appointment system to reduce patients’ waiting time while allowing for full use of the physicians’ time; Klassen and Rohleder (Citation1996, p. 83) as “how to schedule … in order to minimise the waiting time of the clients as well as the idle time of the service provider”; Cayirli and Veral (Citation2003, p. 519) as “Effective scheduling systems have the goal of matching demand with capacity so that resources are better utilised and patient waiting times are minimised”; Kaandorp and Koole (Citation2007, p. 217) as “The objective of appointment scheduling is trading off the interests of physicians and patients: the patients prefer to have a short waiting time, the physician likes to have as little idle time as possible, and to finish on time”; Lowes (Citation2008, p. 50) as “the art of scheduling is a balancing act between easy access for patients and a steady, but not exhausting stream of visits for doctors; Cayirli and Gunes (Citation2014, p. 513) as a “balance of the in-clinic performance measures of patients’ waiting times, physician’s idle time and overtime Chew (Citation2011, p. 1) as “The objective of these appointment systems is to minimise the average total cost function describing total costs incurred by patient waiting and by staff idle time and overtime”; Cayirli, Yang, and Quek (Citation2012, p. 682) as “the overall goal of a well-designed appointment system is to achieve a balance among the competing and conflicting goals of minimising the patients’ waiting time and the doctor’s idle time and overtime”; and more recently Wang and Fung (Citation2015, p. 33) as “the development of an appointment system that can make an outpatient department work more efficiently and improve patient satisfaction level”. Flagle (Citation1962, p. 591) summarises this scheduling problem more generally as a balance between the flows of resource supply and patient demand.
Additionally, most appointment scheduling researchers (Berg, Denton, Ayca Erdogan, Rohleder, & Huschka, Citation2014; Cees, Citation2011; Erdogan & Denton, Citation2013; Klassen & Rohleder, Citation2004; Klassen & Yoogalingam, Citation2013; Kopach et al., Citation2007) recognise the high level of uncertainty in the health care environment both on the part of the patients (early and late arrivals, no-shows, walk-ins, etc.) and on the part of the health care providers (extended consultation times, missing information, un-prepped patients, interruptions, etc.). In situations in which physicians are dedicated to providing excellent and timely health care services, most physicians cannot optimise their appointment schedule. In this context optimising the physician’s schedule means creating and executing a schedule in which the physician is utilised 100% of the time. The physician is focused on meeting the patients’ needs in an uncertain and a constantly changing environment which preclude schedule optimisation. In contrast to viewing decision-makers as optimisers, Simon (Citation1979) views decision-makers as satisficing, that is, given bounded rationality (imperfect information, uncertainty, complexity, and time constraints on making the decision), the decision-maker (the scheduler in our analysis) selects what is perceived to be a good alternative at each moment, but that alternative rarely results in 100% efficiency for the provider.
2.2. The problem: patient demand versus provider supply dilemma
Our intent is not to provide an exhaustive review of all problems related to appointment scheduling but to document that the literature suggests that certain major and persistent problems exist in health care scheduling and most have been studied in isolation (a reductionist approach). Fourteen major problems (UDEs) were identified. In contrast to the academic reductionist view of isolating one problem, in most practices a number of the UDEs exist. In reviewing these problems, we have divided the UDEs into two major categories: problems (UDEs 1–4) created in planning (poor schedule design) and problems (UDEs 5–14) created by poor schedule execution. Recall Goldratt et al. (Citation2000) (with Schragenheim and Ptak) introduced the concept of planning and execution being separate functions. Later Schragenheim, Dettmer, and Patterson (Citation2009) provided a detailed discussion of the planning (managed with drum-buffer-rope-scheduling) and execution (managed with buffer management) functions. The PASS design problems include:
SCHEDULE DESIGN UDEs (the original 14 UDEs are numbered 1–14 and italicised in all figures)
(1) The no-show rate is high.*
(2) Many patients (pts) are given appointments (appts) later than they need/desire.*
(3) The no-appointment-scheduled (NAS) slots are high; greater than 20% particularly in summers.*
(4) Providers set rules for who they want to see, when, and for how long.*
SCHEDULE EXECUTION UDEs
(5) Walk-ins are common.*
(6) Occasionally providers have an emergency patient.
(7) A number of unpunctual patients exist: some come early and some come late.*
(8) Patient wait times at practice are long.*
(9) Waiting-room congestion is high.*
(10) Sometimes providers start a session late.*
(11) Sometimes providers are interrupted during a consultation service time (11a) or session (11b).*
(12) Provider consultation times are highly variable.*
(13) Sometimes patients are called in order of arrival (FCFS) or need instead of by the schedule.*
(14) Some patients require a second consult (after tests, x-rays, etc.).*
In addition to a literature critique, action research was conducted in a medical practice. Partners, providers, the scheduling supervisor, the operations manager and the business manager were asked to validate the existence and causal relationships of the problems identified in the literature. An asterisk after each UDE indicates that the UDE also appeared in the medical practice prior to TOC implementation. The practice indicated it did not have UDE 6 as they informed all patients: in case of emergency call 911 immediately. Details on the first four UDEs are provided describing the scope of these problems and the research efforts in appointment scheduling.
2.2.1. UDE 1 the no-show rate is high*
Patient no-shows have been a major unsolved problem for forty + years (our references span 1974 to 2016). Researchers (Nazarian, Mechaber, Charney, & Coulter, Citation1974; Cayirli, Veral, & Rosen, Citation2006; LaGanga & Lawrence, Citation2007; Smith-Daniels, Schweikhart, & Smith-Daniels, Citation2007; LaGanga, Citation2011; Huang, Hancock, & Herrin, Citation2012, Samorani and LaGanga, Citation2015) report high no-show rates in outpatient clinics. Other researchers (Hassin & Mendel, Citation2008; LaGanga & Lawrence, Citation2007) describe the wide variation in no-show rates. A number of studies have provided patient no-show rates that vary significantly: Nazarian et al. (Citation1974) over 50%; Cayirli et al. (Citation2006) as high as 60% with of average 38% (simultaneously with walk-ins averaging 16%); and LaGanga (Citation2011) 17.75%. In contrast, Weingarten, Meyer, and Schneid (Citation1997) had a no-show rate of 6.7 per cent in their research. In a review of no-show rates, LaGanga and Lawrence (Citation2007) found large variations among medical specialties, geographic areas, and patient populations ranging from 2 to 80%. Hassin and Mendel (Citation2008) summarised the no-show statistics from numerous medical websites and surveys as having figures averaging approximately 40%.
The effects of no-shows (Huang & Zuniga, Citation2012; LaGanga & Lawrence, Citation2007, Citation2012) on a practice are to: reduce provider productivity decreasing practice efficiency; idle or waste medical resources thus increasing health care costs; limit the ability of a practice to serve its client population by reducing its effective capacity; and limit patient access to timely care. While no-shows occur in schedule execution, the causes link to schedule design. No shows also are such a prevalent problem that some researchers (LaGanga & Lawrence, Citation2007, Citation2008; Muthuraman & Lawley, Citation2008; Chakraborty, Muthuraman, & Lawley, Citation2010; Zeng, Turkcan, Lin, & Lawley, Citation2010; LaGanga, Citation2011; Huang & Zuniga, Citation2012; LaGanga & Lawrence, Citation2012; Samorani and LaGanga, Citation2015; Zacharias & Pinedo, Citation2014) and practices try to plan for no shows in the PASS design by trying to predict where no-shows will occur and overbooking patients for these appointment times. In contrast, Woodcock (Citation2014) provides several alternatives to reduce the no-show rate such as penalise or terminate the patient, reminder cards (letters, emails), etc.
2.2.2. UDE 2 Many patients are given appointments later than they need/desire*
This UDE is expressed in a number of different ways by researchers. Green and Savin (Citation2008, p.1526) describe this situation as “long backlogs for appointments”; Singh et al. (Citation1977) as excessive waiting time between the call for an appointment and the appointment; and Lowes (Citation2008, p. 50) as new patients must wait two or three months for an appointment (blaming the appointment book). In a survey conducted by Merritt Hawkins (Citation2017a), the average cumulative wait time to schedule a new patient appointment at a family physician was 24.1 days compared to 19.5 in 2014. Prentice, Davies, and Pizer (Citation2014, pp. 231–2) and others find a significant causal relationship between appointment delay and poorer health outcomes and patient satisfaction.
2.2.3. UDE 3 The no-appointment-scheduled (NAS) slots are high; greater than 20% particularly in the summer months*
Many practices have a number of vacant appointment slots. We call these “no-appointment-scheduled” (NAS) slots. They may occur for several reasons: cancellations (particularly late cancellations), seasonality (Cayirli & Gunes, Citation2014; Chung, Citation2002), and business recessions (The Kaiser Family Foundation, Citation2013; White, Citation2009). Most practices face annual seasonality factors for various ailments (such as flu, colds, viruses, allergies, etc.) but don’t adjust their provider schedules for this seasonality. Seasonality also occurs on different time scales and may exist in both the demand and supply of health care. Many patients avoid specific times of the day or days of the week in setting up appointments. Concurrently many providers plan vacations particularly in the summer and around holidays. On a daily horizon, providers also schedule specific appointment types such as physicals (health maintenance exams: HMEs) early in the day (8 AM, for example) and this action blocks this time for other appointment types. The result of this mismatch of timing and quantity of an appointment type of supply and demand is this “no-appointment scheduled” phenomenon and it has received little attention in the literature. One notable exception, Cayirli and Gunes (Citation2014) focus on managing the impact of the seasonality of walk-ins in their modelling efforts. While not a major topic of this research business recessions (The Kaiser Family Foundation, Citation2013) can also decrease patient demand (losing one’s job, lack of insurance, money, etc. may cause patients to ignore health concerns).
2.2.4. UDE 4 Providers set rules (using a standard template) for who they want to see, when, and for how long* to ensure high utilization
Providing and receiving treatment requires a delicate balance between supply and demand. The provider represents the supply side of the supply and demand equation while the patients’ needs represent the demand side. An appointment scheduling system has to accommodate different appointment types that occur in varying frequencies and require resources for varying amounts of time. Appointment types include wellness exams, physicals, chronic conditions, acute conditions, follow-ups, and others. In creating or adopting a scheduling template, providers in effect set rules for the total number of appointment slots, the mix of appointment types, as well as the length and timing of each type of appointment. In many practices, however, providers’ appointment books (the supply of appointments) are “seriously out of whack” with reality (Lowes, Citation2008, p. 50). The appointment book should provide the balance between supply and demand. However, the mismatch of supply and demand is apparent when in reality new patients must wait two or three months for an appointment given the current backlog of new and existing patients for all or a specific appointment type. At the same time, vacant time slots may exist for a given appointment type. The reason for this mismatch is that the schedule template is in effect a forecast of the product mix the provider will experience over the scheduling horizon. To the extent that the forecasted mix does not match the actual mix, the provider will experience unfilled slots and patients will be offered appointments that do not meet their needs.
Who is responsible for bringing the ineffective PASS into compliance with patient demand? In most environments providers are responsible for designing their PASS and basically choose an appointment template that fits their personal needs or desires. Providers choose from over a half dozen standard (std) appointment scheduling templates, each with its advantages and disadvantages. These systems (Lindh, Pooler, Tamparo, & Dahl, Citation2010) include: stream scheduling, double booking, wave, modified wave, block, and open access. Lowes (Citation2008) describes seven scheduling systems with their advantages and disadvantages. A recent innovation (Gupta & Denton, Citation2008; Murray, Citation2000, Citation2005) adopted by many primary care clinics is the advanced or open-access system which leaves numerous appointment slots vacant in an attempt to accommodate patients’ requests for same-day appointments. The downside may be that the provider has too many vacant appointment slots.
What then is a schedule that provides a good balance between supply and demand? Recall that in practice average wait times for a new patient (Merritt Hawkins, Citation2017a) was over 24 days in 2017. As previously stated research shows that the quicker the provider treats the patient the better the health outcome and the higher the probability that the patient will show up for the appointment.
2.3. Literature critique
Why hasn’t the appointment scheduling problem been solved? To answer this question let’s develop criteria to evaluate a PASS as effective and operational. First, the scheduling problem exists in an uncertain (Cayirli & Veral, Citation2003) and sometimes chaotic (Lowes, Citation2008; Singh et al., Citation1977) environment. Based on the description of a typical practice environment, uncertainty should be a key factor to be dealt with in any PASS analysis and design effort. The focus of designing a PASS should be on reducing the uncertainty therefore the problem should be viewed as a satisficing, and not an optimising problem. The PASS must have rules to reduce uncertainty and be buffered against the remaining uncertainty. Buffers protect the PASS from variability and buffer management is used to eliminate its causes. Second, the problem should be viewed from a systems perspective (Senge & Sterman, Citation1992; Singh et al., Citation1977) instead of a local one-dimensional problem (studying each of the 14 different UDEs studied in isolation). The PASS must take a systems perspective. Third, many researchers address a symptom (no-shows, interruptions and physician lateness) and do not address the core problem (poorly designed/executed PASS). Their effort is focused on designing a PASS to accommodate a specific problem. For example, Samorani and LaGanga (Citation2015) suggest the use of patient’s characteristics to predict no-show status and overbook that appointment time slot. This research should focus instead on identifying why the patient no-shows and addressing the cause of the no-show. In a similar vein of treating symptoms, Klassen and Yoogalingam (Citation2013) have developed a model to accommodate interruptions and physician lateness. Again, they are addressing a symptom of poor schedule execution instead of the core problem. The PASS must be able to identify emerging and underlying problems. Fourth, for over the past sixty-five years researchers (Mak, Rong, & Zhang, Citation2015) have developed and are developing more complex mathematical algorithms to address the scheduling problem while the typical scheduler in a medical practice is a high school graduate (Learn.org, Citation2018) with no advanced training in mathematics or scheduling. The PASS must be simple. Fifth, patient demand is constantly changing. The PASS must be flexible and responsive to changes in patient needs. Sixth, a schedule is only as effective as its execution. Any schedule will deteriorate over time if its execution is poor. Patients will arrive late or not show up for later appointments if they have to wait an hour to see the physician when they are on time. The PASS must be executable. Seventh, the PASS should be based on management by exception so that the provider can treat patients instead of responding to every change. Eighth, the PASS should be proactive so that the scheduler and provider can respond before trouble surfaces. To be effective, any PASS should meet these eight design criteria.
The PASS problem, an ill-defined and ill-structured (Holmström, Ketokivi, & Hameri, Citation2009) problem, is so difficult because three sources of disruption (UDEs) must be addressed and current academic research tends to address only a part of one source at best. Many health care environments suffer from chaos: high levels of complexity, uncertainty, and local optima. Any effective solution to the PASS problem must address all three sources of disruptions. TOC is a holistic management philosophy that includes three processes of ongoing improvement (POOGI). These three POOGI provide solutions to different types of disruptions.
3. Methodology
Eliyahu M. Goldratt (Goldratt & Cox, Citation1984) is viewed as the creator of the theory of constraints philosophy. Watson, Blackstone Jr, and Gardiner (Citation2007) provide an excellent description of the evolution of TOC. Davies, Mabin, and Balderstone (Citation2005) evaluate the TOC methodology with respect to traditional operations research/management science methodologies. Kim, Mabin, and Davies (Citation2008) provide an extensive literature review of the TOC TP. Cox III and Schleier Jr (Citation2010) edited the TOC Handbook which includes the work of forty-three TOC experts on various organisation functions and TOC tools. In the TOC Handbook, Goldratt (Citation2010, ch. 1) describes his journey of discovery in developing the TOC philosophy. The handbook also includes an extensive bibliography of Goldratt’s work.
The three POOGI are briefly explained below then applied in Section 4 Analysis.
3.1. The change question sequence: addressing complexity
The change question sequence (CQS) addresses system complexity by identifying and validating system causalities. Causality has long been recommended as the basis for applying the scientific method in management science (Regopoulos, Citation1966). Causal maps (Scavarda, Bouzdine-Chameeva, Goldstein, Hays, & Hill, Citation2006, p. 278) “can be a powerful tool to help managers to focus attention on the root causes of a problem, find critical control points, guide risk management and risk mitigation efforts, formulate and communicate strategy, and teach the fundamental causal relationships in a complex system”. Understanding system causalities particularly the connections of UDEs to the core problem provides the foundation for solving the system problems. Causality is determined using abductive logic (Josephson & Josephson, Citation1994) and contingency theory (Holmström et al., Citation2009): a search for causes and factors that provide the best explanation of a complex situation. Using the Goldratt TP (For a discussion of the various TP tools and the categories of legitimate reservation, see the TP section of the Theory of Constraints Handbook (Cox III & Schleier Jr, Citation2010).), the first POOGI, the change question sequence (CQS) (Cox et al., Citation2012) answers the following five questions:
Why change?
What to change?
To what to change?
How to cause the change?
How to measure and sustain the change?
The first question, why change, focuses on determining why a change to the system is necessary. A listing of UDEs versus the desirable effects (DEs), i.e., a gap analysis, is used to help determine the answer to this question. We described the global imbalance of patient demand versus the health care supply and listed 14 UDEs based on the academic and practitioner literature which clearly signal a need for change. Of course the desirable effects (DEs) are to increase health care supply while eliminating or reducing significantly the impact of the UDEs on the PASS.
The second question, what to change, focuses on identifying the system’s core problem. The evaporating cloud (EC) and current reality tree (CRT), two of the TP of TOC, are used to answer this question.
The third question, to what to change, focuses on determining a set of actions (called injections) that will (Scheinkopf, Citation2010) convert the UDEs to DEs. The objective of answering this question is to construct simple, practical win–win solutions (meaning that both parties to the conflict get more than what they expect). The EC, negative branch reservation (NBR), and future reality tree (FRT) are used to answer this question.
The fourth question, how to cause the change, focuses on developing an implementation plan for the buy-in and change. The prerequisite tree (PRT) and the transition tree (TRT) are used to answer this question. Buy-in involves facilitating the appropriate managers and staff to identify the core problem and use their knowledge to invent the win-win solution.
The fifth question, how to measure and sustain the change, focuses on developing mechanisms to measure the impact of changes (as a reinforcing feedforward/feedback loop) and maintain POOGI. Sustainability must be a management priority with executive involvement and follow-up in establishing, adhering to and following new policies, rules, procedures, behaviours, measures, and culture.
3.2. Buffer management: addressing uncertainty
The second POOGI buffer management (BM) addresses uncertainty. Stratton (Citation2013) provides an excellent description of BM and its functions. Two major BM functions are the location of strategic buffers to reduce the impact of variability on system operation and monitoring buffer levels to identify and eliminate sources of cross-functional/system disruptions.
In TOC, buffers are usually divided into three equal active regions: green, yellow, and red. The BM control mechanism acts similar to traffic light colours. A buffer level in the green region means that the process is flowing smoothly: do nothing (there is no need for intervention); yellow indicates that a problem may be materialising and management should plan appropriately; and red means a problem is imminent and action is needed now. A black region is sometimes used to indicate the problem has already occurred and a white region to indicate early (or unauthorised) release of an item.
Guidelines are generally established for changing the size of the buffer. For example, if three red conditions occur in a row, the buffer size should be increased by one third; and if three greens occur in a row, the buffer size should be decreased by one third.
3.3. The five focusing steps: addressing local optima
The third POOGI, the five focusing steps (Goldratt, Citation1988; Goldratt & Cox, Citation1992) (5FS) addresses local optima. The success of the five focusing steps has been well documented in the literature (Mabin & Balderstone, Citation2000, Citation2003; Watson et al., Citation2007). The 5FS are:
IDENTIFY the system’s constraint(s).
Decide how to EXPLOIT the system’s constraint(s).
SUBORDINATE everything else to the above decision.
ELEVATE the system’s constraint(s).
WARNING!!! If in the previous steps a constraint has been broken, go back to step 1, but do not allow INERTIA to cause a system’s constraint.
3.4. TOC in the context of design science
Now that the tools of TOC used to develop a solution to the PASS problem have been explained, it can be seen that their application is similar to a design science approach (Dresch, Lacerda, & Antunes Jr, Citation2015; Holmström et al., Citation2009; Romme, Citation2003; van Aken, Citation2004). Traditional reductionist research in OR/MS sometimes uses case data as input into their optimisation modelling efforts. As pointed out by Holmström et al., this approach is ineffective when successful practices do not yet exist. Design science seeks to address this problem by exploring new solutions to problems while explaining and improving the exploration process (Holmström et al., Citation2009). Denyer et al’s (2008) approach to design science is based on a “CIMO” framework for prescriptive knowledge formulation in which a problematic Context (C) is addressed through an Intervention (I) that results in a desired Outcome (O) through a Mechanism (M). The PASS problem we are addressing in this paper is clearly a problematic context and the TOC processes of ongoing improvement are well-developed interventions for problematic environments (field research on real organisation problems). The TOC TP elucidate, using abductive logic, the Mechanisms by which the POOGI (the Interventions) change the original Context to the desired Outcome.
To frame the CIMO process in TOC terms, the current system context is described using cause-and-effect logic with underlying assumptions in the EC and CRT. The EC and CRT provide the assumptions or conditions (policies, procedures, rules, and behaviours) that extend causally from the core problem to the UDEs. The intervention is a high-level term describing the primary and secondary injections required to change the context to outcome in CIMO terminology and the CRT to the FRT in TOC terminology. The EC and CRT and its relationship to the context of the CIMO methodology are shown in (a). The CRT (including the rotated EC) is read from bottom to top using “If-Then” logic. In a CRT all entities are complete sentences so that the logic reads properly. Three major benefits are realised using the TP as the foundation of the CIMO methodology. One, surfacing and connecting the UDEs using causality adds significant rigour to the analysis. Two, by identifying the core problem of the system a better solution can be developed. Three, by including the assumptions they are visible and available for scrutiny. An injection (action) can then be devised that breaks the assumption thus eliminating or lessening the current effect or strengthen the assumption to reinforce the results.
Figure 1. Relationships of TOC TP to design science CIMO. (a) Relationship of EC and CRT (micro) to current context (macro). (b) CIMO relationship of CRT, injections, and FRT (micro) to Desired Outcome (macro).
The relationship of moving from the CRT or current context to the FRT or desired outcome through interventions and the mechanisms (the logic of how the intervention causes the outcome) is provided in (b). Under the CIMO process, an intervention (a set of primary and secondary injections) is used to change the current context (CRT) to a desired outcome (FRT). The mechanism explains the logic of the intervention. In TOC, this process is reflected in a FRT.
Someone reading the CRT could legitimately ask under what conditions (assumptions) is the causality true, or if the causality exists under any conditions. The second major benefit of surfacing assumptions is that this is a prerequisite for the next step of the TOC change questions sequence – answering the question of “To what to change?” (i.e., what is the proposed solution?) The relationship between assumptions and creativity is well established. Russell Ackoff (Detrick, Citation2002), for example, said that “All creativity begins with the breaking of an assumption that you normally make and exploring the consequences of doing so”. This assumption-surfacing and -challenging aspect of the TP will be discussed further.
This short introduction to the TP is to show how it provides rigour to a design science framework, specifically the CIMO framework and more generally qualitative research. The next section will demonstrate the use of the TP in developing a solution to the PASS problem.
The purpose of the TOC approach is to develop solutions that address multiple, ideally the majority of, UDEs (symptoms) at one time by addressing the core problem or the core conflict in the system. This logic which Goldratt (Citation2008) described as inherent simplicity is that the core problem is at the root of many cause-and-effect chains that lead to many of the UDEs in the system and that “solving” the core problem will eliminate many UDEs at once. He describes this search for inherent simplicity as the scientific method.
In our view, a major contribution of the TOC approach to design science is the TP provides a logical graphic structure for not only problem definition and analysis and but also for solution generation and implementation. The primary injection (PI) of the proposed solution or intervention would be placed in the EC at the bottom of a FRT and cause-and-effect logic would be used to build the FRT to ensure that (1) the desired effects (DEs) would be achieved and (2) no unacceptable new UDEs would occur.
Another TP, the EC (Cox et al., Citation2012, pp. 71–2) is used to precisely define a problem. In Goldratt’s view, significant, chronic system problems are frequently, possibly always, the result of a core conflict in the system, a situation in which one party or part of the system is in conflict with another part of the system. Many times these conflicts arise when different parts of the system have different goals and different performance measures. Pursuit of their own goals by different parts of the system results in chronic problems, in some cases lasting decades. Goldratt developed the EC to (1) precisely define conflicts, (2) identify erroneous assumptions underlying each side of the conflict, and (3) resolve the conflict with a win–win solution. The EC includes the common objective A that both sides are trying to achieve, two requirements (B and C) that both must be met in order to achieve A (each side in the conflict feels their requirement must be met to achieve the objective), and two prerequisites (D and D′) that express the specific actions that are directly in conflict. Each party to the conflict feels that the only way to achieve their requirement (B or C) is to take the action described in their prerequisite, D or D′, respectively. The structure of the EC is shown in (a) below.
Figure 2. WHAT TO CHANGE – EC structure and EC of outpatient scheduling dilemma. (a) EC structure. (b) Core conflict EC: patient (pt) demand versus provider supply dilemma.
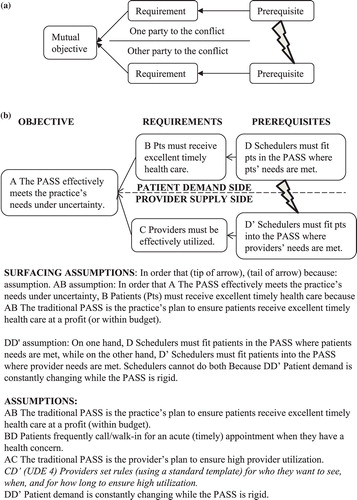
The cloud represents necessity rather than sufficiency logic. This means that an entity at the base of an arrow in an EC is necessary but not necessarily sufficient to cause the entity at the head of the arrow. The cloud is read from left to right starting with the top of the cloud as follows: “In order to have A, we must have B. In order to have B we must have D”. The bottom of the cloud is read the same way, and the conflict arrow is read “On one hand we must have D. On the other hand we must have D′. We cannot have both”. We use this framework to check the EC logic and to surface conflict assumptions on both sides. This is illustrated in the next section.
4. Analysis
In this section, the PASS problem is analysed using the TP. The results of the literature review in Section 2.1 Researchers’ Objectives and Necessary Conditions were used to build the EC in Section 4.1 below. The UDEs (traditional problems studied) identified in Section 2.2 were then connected to the base (EC) of the CRT using abductive logic. To check for entity and causality existence in the CRT the medical practice previously studied was audited (described in Section 4.2) and a brief summary is provided in Section 4.3.
4.1. Problem analysis: patient demand versus provider supply dilemma
In converting the PASS problem to an EC, the literature review clearly brings out the core conflict inherent in the system, i.e., that on one hand patients must be scheduled in a way that meets their needs, while on the other hand providers must be scheduled in a way that maximises their utilisation and in most cases the schedulers are unable to do both. Because we know the core conflict (the D and D′) before we begin the TOC analysis, we can immediately construct the core conflict EC, shown in (b).
Also based on Section 2.1 Researchers’ Objectives and Necessary Conditions, the common objective of most previous studies is to develop an effective PASS. The term “uncertainty” is included in the objective as numerous studies describe the high uncertainty in the environment. The objective for the EC is: A The PASS effectively meets the practice’s needs under uncertainty. The term practice is used here to indicate the needs of the practice owners (which is generally a subset of the providers and as an owner looks on the practice holistically; the term department head, hospital administrator, etc., might provide that holistic perspective in other health care environments.). The requirements that must be met to achieve this objective also come from the academic research literature, one related to satisfying health care demand, i.e., the patient side of the cloud (A←B←D), and one related to supplying health care or the provider side of the cloud (A←C←D′).
The demand side is: B Patients (pts) must receive excellent timely health care and in order to do this D Schedulers must fit patients in the PASS where patients’ needs are met. “Timely” is expressed as a separate characteristic from excellent based on its critical importance in health care environments. Many researchers recognised the timeliness on appointments (appts) in both improving health care and in reducing “no-shows”. Timely also relates to meeting government and insurance regulations for payment of the provider. If the provider treats the patient within the required time window then the provider is paid; otherwise the provider may be penalised or not paid at all. For example, a hospital follow-up visit must be within seven days of release from the hospital.
The supply side is: C Providers must be effectively utilised and in order to do this D′ Schedulers must fit patients into the PASS where providers’ needs are met. The conflict then is described as: D Schedulers must fit patients in the PASS where patients’ needs are met versus D′ Schedulers must fit patients in the PASS where providers’ needs are met. We cannot do both. As the UDEs described in Section 2.2 suggest, the appointment times needed by patients and the time available in the provider’s schedule are seldom the same. Academic research (Norris et al., Citation2014) recognises the paradox that traditional scheduling systems designed to ensure full utilisation of a provider for future appointments also contribute to provider underutilisation (idleness) by increasing the probability that patients will not show.
Creating an EC accomplishes three things: (1) It clearly defines the conflict and, in particular, it clearly separates interests from positions as described by Fisher and Ury (Citation1983); (2) it allows all parties to examine the necessity relationships between the objective, requirements and prerequisites and surface underlying assumptions, and (3) it can be used to form the base of a CRT linking the core problem to the system UDEs. We will demonstrate this latter purpose in the next section, but first we will surface assumptions for each necessity relationship in the EC by adding a “because” after reading each arrow. Based on the necessity logic of the EC, the format is “In order to have (entity at tip of arrow), we must have (entity at tail of arrow) because: assumption”. For example: In order that A The PASS effectively meets the practice’s needs under uncertainty, B Patients must receive excellent timely health care because A←B The traditional PASS is the practice’s plan to ensure patients receive excellent timely health care at a profit (or within budget). The assumptions underlying the B←D, A←C, and C←D′ arrows are surfaced in a similar manner. Assumptions underlying the D←→D′ are surfaced using: “On one hand D on the other hand D′. We cannot do both because: assumption”. DD′ Patient demand is constantly changing while the PASS is rigid. Assumptions underlying each arrow are provided in (b). Note the assumption BD Patients frequently call/walk-in for an acute (timely) appointment when they have a health concern, can be replaced by similar assumptions concerning the timing of various appointment types such as annual physicals, hospital follow-ups, etc., where the appointment timing must fit within a given window of time.
Invalidating an assumption with an action, “injection”, is the first step in solving the problem. It is useful to generate several assumptions for each causal (necessity) relationship in the EC to determine different actions that might be taken to solve the core problem with a win-win solution.
4.2. Moving from complexity (UDEs) to inherent simplicity (Core problem)
The UDEs result from the core conflict between patients’ needs (UDEs 1, 2, and 3) and providers’ needs (UDE 4). The first step is to rotate the EC 90 degrees counterclockwise. The CRT base is provided in with the four UDEs and some explanatory entities (48, 49, 50, 56, and 57). Note the slight difference in wording in moving from the EC to the CRT base caused by moving from necessity to sufficiency logic. This diagram has what is referred in TOC terminology as long arrows. Long arrows are used to provide a high level view of UDEs to their source (a forest or system perspective) before getting into the details of how and under what conditions each UDE is linked to other UDEs and the EC (the tree or detailed perspective). Long arrows allow one to see a relationship between the entities at the base and tip of the arrow but the detailed logic is not explicated. While not a topic of this research the long-arrowed diagrams are quite useful in building the detailed logic diagrams. In studying this diagram one can also see the relationship between the TOC diagrams and the CIMO diagrams. The CRT provides the current context. Five interventions are needed to address this chronic problem. First, to address the AB assumption an intervention to align the schedulers’ tasks/ PASS with the practice goal is required. Second, to address the AC assumption an intervention to align the clinical staff tasks with the practice goal is required. Third, to address the BD assumption an intervention to align patient responsibilities to the practice goal is required. Fourth, to address the CD′ assumption an intervention to align provider responsibilities to the practice goal is required. Fifth, to address the DD′ assumption an intervention to provide PASS feedback/responsiveness is required. The detailed CRT will show the assumptions underlying the current imbalance.
Figure 3. WHAT TO CHANGE – CRT with long arrows showing overview of EC assumptions and scheduling UDEs.
Once the core conflict is well defined, we can create a CRT to elucidate and validate the cause-and-effect relationships between the core conflict and the four schedule design UDEs (Reid & Cormier, Citation2003). Because the EC incorporates necessity logic, we can use it as the basis of the CRT but need to add additional entities to move from necessity-based logic to sufficiency-based (cause-and-effect) logic. Again, the first step is to rotate the EC 90 degrees counterclockwise. We place the UDEs at the top of the page and insert assumptions and other causal links representing facts about the system to provide sufficiency to logically connect the core conflict to the UDEs. The causal linkages from the EC to each UDE are developed using “If-Then” and “If-And-Then” sufficiency logic to build upward to the UDEs or to build downward from the UDE (by repeatedly asking and answering the question “Why?”) to the CRT base. See . Regardless of whether a CRT is built from top or bottom, it is read from bottom to top. The entity numbers are used for identification only and provide an easy way of determining where in the tree one is reading for others to follow along. Reading conventions are that the entity at the base of the arrow is the IF statement, the entity at the tip of the arrow is the THEN statement and a line across two or more incoming arrows represents an AND connector meaning all the “IF” causal entities are required together for the “THEN” effect to occur.
Figure 4. WHAT TO CHANGE – CRT base: Provider supply side with UDEs 3 & 4.
In the CRT base and its causal relationships of the supply side (PASS) and to UDE 3 (shown in italics) are provided. For illustrative purposes let’s read a portion of this CRT starting at the base. If AB The traditional PASS is the practice’s plan to ensure patients receive excellent timely health care at a profit (or within budget) and A The goal of the PASS is to effectively meet the practice’s needs under uncertainty then B Patients need to receive excellent timely health care. If B Patients need to receive excellent timely health care and BD Patients frequently call/walk-in for an acute (timely) appointment when they have a health concern then D Schedulers feel pressure to fit patients in the PASS where patients’ needs are met. Since we have an “and connector” above this point we must go back down to the base and build the other side up before proceeding upward of the connector. If A The goal of the PASS is to effectively meet the practice’s needs under uncertainty and AC The traditional PASS is the provider’s plan to ensure high provider utilisation then C Providers need to be effectively utilised. If C Providers need to be effectively utilised and CD′ (UDE 4) Providers set rules (using a standard template) for who they want to see, when, and for how long to ensure high utilisation then D′ Schedulers feel pressure to fit patients in the PASS where providers’ needs are met. If D Schedulers feel pressure to fit patients in the PASS where patients’ needs are met and D′ Schedulers feel pressure to fit patients in the PASS where providers’ needs are met then DD′ Patient demand is highly uncertain and constantly changing while the PASS is rigid. This represents the EC portion of the CRT.
Let’s now develop the logic of the supply side of the problem. If CD′ (UDE 4) Providers set rules (using a standard template) for who they want to see, when, and for how long to ensure high utilisation then 20 Providers’ template/rules define the PASS with respect to patient type, appointment type, quantity, timing and length (and seldom change).
If DD′ Patient demand is highly uncertain and constantly changing while the PASS is rigid and D′ Schedulers feel pressure to fit patients in the PASS where providers’ needs are met and 20 Providers’ template/rules define the PASS with respect to (wrt) patient type, appointment type, quantity, timing and length (and seldom change) then 47 The PASS is seldom effective. Entities 25 and 26 describe the impact of poor schedule design on PASS effectiveness. If 25 PASS doesn’t provide feedback on effectiveness and problems to manage and modify the PASS and 26 PASS assumes a close balance between appointment supply and patient demand (quantity/type) then 47 The PASS is seldom effective. If 47 The PASS is seldom effective and 25 PASS doesn’t provide feedback on effectiveness and problems to manage and modify the PASS and 26 PASS assumes a close balance between appointment supply and patient demand (quantity/type) then 27 Many providers don’t understand that their PASS creates many of their own problems. If 21 Most providers are interested in healing patients not effective scheduling then 27 Many providers don’t understand that their PASS creates many of their own problems. If 44 PASS execution is quite poor then 27 Many providers don’t understand that their PASS creates many of their own problems. If 27 Many providers don’t understand that their PASS creates many of their own problems then 20 Providers’ template/rules define the PASS with respect to patient type, appointment type, quantity, timing and length (and seldom change). Note the 20-47–27-20 loop; this loop signifies that over time the situation gets worse without some external action being taken. Note the rigidness in the schedule and the lack of responsiveness and protection against demand uncertainty in the provider supply. Many times providers and schedulers extend the backlog several days in the future thinking a full schedule provides protection against demand uncertainty.
Continuing, if 21 Most providers are interested in healing patients not effective scheduling then 22 Schedulers are hired to respond to patient appointment requests based only on the PASS. If 22 Schedulers are hired to respond to patient appointment requests based only on the PASS then 23 Schedulers don’t actively solicit patients for empty appointment slots. Note entity 23 is also connected to an off-page connector (entity 43) which links this figure to . If 23 Schedulers don’t actively solicit patients for empty appointment slots and 24 Cancellations, seasonality and recessions impact patient demand then 3 The NAS (no appointment scheduled) slots are high;>20% particularly in the summer months. If 3 The NAS slots are high;>20% particularly in the summer months then 56 Providers are frequently idled. Under-demand D < S. These causal relations describe the passive behaviour of the supply side of the problem. Note BD (through 57) and 56 also link to DD′ and describe the patient demand side of the problem.
Figure 5. WHAT TO CHANGE – CRT: Patient demand side and UDEs 1 & 2.
The major causes of schedule disruption of patient demand are described in (Please read using If-Then logic before continuing). The major causes of 57 Providers are frequently rushed over-demand D > S are: 6 Occasionally providers have an emergency patient; 47 The scheduler overbooks the provider; 5 Walk-ins are common; and BD Patients frequently call/walk-in for an acute (timely) appointment when they have a health concern. The major cause of 56 Providers are frequently idled D < S under-demand is: UDE 1 The no-show rate is high which in turn is caused by 43 The practice is unable to fill many imminent empty slots; 41 Frequently patients don’t cancel, they just don’t show up; and 42 Patients forget appointment, have to work, are on vacation, etc. Poor appointment execution is also a source and is studied in the second paper. Entity 44 PASS execution is quite poor is used here to link to the CRT of schedule execution (second paper). Note Figures and provide the detailed causal relationships suggested in the systems view provided in . This CRT (Figures and ) represents the current context as described in CIMO.
4.3. Summary of patient demand versus provider supply dilemma
The existence of the four UDEs is well documented in the literature and validated in the medical practice studied. Figures and summarise the scheduling dilemma: the high uncertainty (variability) creates both over-demand, in the form of emergency patients, walk-ins and call-ins; and under-demand, in the form of empty appointment (NAS) slots, no-shows and late cancellations. In the longer term, seasonality has a significant impact on both over- and under-demand. Additionally, the provider’s inability to address these causes of uncertainty effectively plus the inflexibility of the PASS and its vulnerability to uncertainty make any schedule ineffective in meeting the needs of either patients or providers. The CRT helps us validate our intuition that the conflict we have identified in D versus D′ is indeed the core conflict in the PASS because it leads, through cause-and-effect logic, to both the original UDEs and a number of other UDEs (low profits, acute patients going to emergency department, etc.) in the system.
5. Direction of the solution
The direction of the solution is provided by the five primary injections (PIs) in the EC shown in . Please compare Figures and . Note D* replaces both D and D′. Our objective to solve this chronic conflict is to find a win–win solution that allows us to achieve both requirements B and C. Ashlag (Citation2014, ch. 3) defines a solution that includes primary injections to change the BD, CD′, and DD′ as a change in the mode of operation for the organisation. The DD′ conflict of “D Schedulers must fit patients in the PASS where patients’ needs are met” versus “D” Schedulers must fit patients into the PASS where providers’ needs are met is replaced by the system solution D* Implement a new mode of operation for PASS design based on POOGI. To support the practice’s change in its mode of operation replacing both the AB and AC assumptions (mode of strategic planning) is also required to insure the sustainability. Thus, five PIs are used in developing the direction of the solution (interventions) as the practice owners, schedulers’, patients’, staff’s, and providers’ roles and measures (and supporting culture) have to be aligned and redefined to support the TOC PASS in achieving the practice goal.
Figure 6. TO WHAT TO CHANGE – Injections to illustrate the direction of solution of EC: patient (pt) demand vs. provider supply dilemma & UDE 4 (CD′ assumption).
5.1. TOC-CIMO approach to the solution
There is no simple formula for solving major, chronic (ill-defined, ill-structured, wicked) problems such as that of the PASS; solving such problems requires creativity and diligence. The quote from Russell Ackoff above that creativity begins with the breaking of an assumption and exploring the consequences of doing so gives us a hint as to the direction that TOC takes to develop a solution: the assumptions surfaced in the EC are examined and, if possible, challenged and invalidated. A primary injection (PI) that invalidates an underlying assumption of the EC provides the base for a potential intervention (the primary injection and supporting secondary injections) to address the EC core conflict and the UDEs in the CRT. In most conflict ECs one, two and at most three assumptions are addressed. The AB and AC assumptions are assumed to be correct and therefore seldom challenged. Recall from the EC discussion that the B and C are requirements that must be met to achieve the EC objective A; while the D and D′ are actions believed to achieve the requirements. In challenging the AB and/or AC assumptions we are challenging the very way we organise and manage the practice to accomplish the objective A. For some chronic conflicts, three, four, or even five PIs may be required to break the various assumptions in the EC and supporting injections (Is) inserted in the CRT to develop a full sustainable solution. See the five PIs and long arrows to the DEs in . We build the five interventions (PIs and Is) to develop the full solution in the following sections.
Figure 7. TO WHAT TO CHANGE: FRT with long arrows showing overview of the EC primary injections (PIs) and scheduling DEs.
Recall the general relationships of the TP and CIMO expressed in . In 1a, the core conflict is represented by the EC and its underlying assumptions at the base and the entry point assumptions in the CRT to create the UDEs. This CRT represents the current Context in CIMO terminology. In 1b, the general structure of the CIMO is provided. The Intervention is comprised of the primary injection (PI) and its supporting secondary injections (Is) required to change (or strengthen) that portion of the EC base and CRT in moving the organisation to the desired outcome (the FRT is constructed to achieve the objective A, both EC requirements B and C and the DEs, a close opposite of the UDEs) below.
A The PASS effectively meets the practice’s needs under uncertainty.
B Patients must receive excellent timely health care.
C Providers must be effectively utilised.
DE 1 The no-show rate is low.
DE 2 All patients are given appointments at times that meet their needs.
DE 3 The no-appointment-scheduled (NAS) slots are minimal.
DE 4 The PASS effectively meets both patients’ and providers’ needs.
The practice solution is to implement the new strategic planning direction (PIAB, PIAC) and D* Implement a new mode of operation (PIBD, PICD′ and PIDD′) for PASS design based on POOGI, which is comprised of the five primary injections identified in . To achieve and sustain the desired outcome (or future reality) all five interventions must be implemented. We replace the appropriate EC assumption with its PI and build the logic upward to the DEs to determine the supporting or secondary Is.
Let’s examine the CIMO structures based on the two sides of the EC dilemma: the patient demand side (PIAB and PIBD) and the provider supply side (PIAC and PICD′). As part of strategic planning for patient demand, new job descriptions, priorities and measures for schedulers and check-in staff must be permanently implemented to respond effectively to patient demand to achieve the practice goal. See (a). The Context (CRT): UDEs caused by AB The traditional PASS is the practice’s plan to ensure patients receive excellent timely health care at a profit (or within budget) is changed to the Desired Outcome (FRT): The TOC PASS effectively meets patients’ needs under uncertainty by implementing Intervention: PIAB Align staff roles, behaviour and measures to proactively schedule to provide excellent timely health care at a profit (or within budget). The mechanism of how this intervention causes the desired outcome is: Align / redefine schedulers’ and patients’ roles & design PASS to reduce uncertainty.
Figure 8 . CIMO structures of strategic planning, execution, and feedback primary injections (PIs). (a) Patient demand strategic planning: Scheduler task-goal alignment intervention (A ← B). (b) Patient demand execution: Patient responsibility-goal alignment intervention (B ← D). (c) Provider supply strategic planning: Clinical staff-goal alignment intervention (A ← C). (d) Provider supply execution: Provider responsibility-goal alignment intervention (C ← D′). (e) Patient demand-provider supply execution: PASS feedback /responsiveness intervention (D ←→ D′).
Additionally, patients must also be educated and held responsible in their role in using the practice. In (b), the CIMO structure for the PIBD intervention concerning patient responsibility-goal alignment is provided. The context is the environment that includes the UDEs that are partially caused by assumption BD Patients frequently call/walk-in for an acute (timely) appointment when they have a health concern. To change this environment to the Desired Outcome (FRT): Acute patients know that by calling immediately the provider will see them that day; management needs to implement the Intervention: PIBD Have walk-ins and call-ins call immediately to schedule a same-day acute appointment. The Mechanism of how this intervention creates the desired outcome is: The PASS/schedulers are responsive (use session buffers) to daily patient demand.
The provider supply side of the EC is provided in (c) and (d) and is read similarly to the patient demand side. The strategic planning (clinical staff goal alignment intervention) defines clinical staff/ providers’ new job descriptions, priorities, and measures to achieve the practice goal. See (c). The mode of operation intervention for the provider and clinical staff is defined by provider responsibility-goal alignment ((d)). The provider must accommodate small daily changes to the PASS as demand changes.
Over time patient demand and provider supply change, the PASS feedback/responsiveness intervention accommodates these changes ((e)). Please read these CIMO structures. These five interventions are comprised of the five EC PIs and Is surfaced in building the FRT.
Before examining the five interventions required to solve this chronic PASS problem, a brief discussion about the practice objective (A The PASS effectively meets the practice’s needs under uncertainty) is required, specifically the term, uncertainty. How to address uncertainty is quite different in TOC compared to traditional thinking. In traditional thinking academics assume certainty to apply their mathematical model or assume some type of distribution and build a model around that distribution. In TOC, first, we try to reduce or eliminate the uncertainty directly and second, we try to reduce the impact of the remaining uncertainty. It may not be immediately obvious how to accomplish this but it will become apparent when we build the detailed solution.
5.2. Scheduler task-goal alignment intervention (A←B)
To identify the strategic planning needed to support satisfying patient demand let’s investigate the assumption underlying the A←B relationship. Recall it is surfaced in the following manner: In order that A The PASS effectively meets the practice’s needs under uncertainty, B Patients must receive excellent timely health care because AB The traditional PASS is the practice’s plan to ensure patients receive excellent timely health care at a profit (or within budget). This assumption links the practice goal (whether for-profit or for-purpose) to the practice (owners) through the PASS to both patients and employees. This assumption is valid: the desire to provide excellent timely health care to enough patients to make a profit (or spread the budget over more patients). But this assumption is not necessarily true (existing in reality) in most practices. Traditional job descriptions, tasks, measures, etc., focus on all employees doing the best they can at their own specific tasks. This doesn’t necessarily align employees working as a team to achieve the practice goal. All employees (direct support and clinical staff) must accept this practice goal and their roles, behaviours and measures (and thus the practice culture) must be redefined to support this goal from a systems perspective. For example, note as we built the FRT and ultimately the PASS we were actually redefining the roles of the scheduler, check-in/check-out staff (direct support) and patients to align them with this organisation goal. Specifically, we are attempting to create an organisation where the intervention is based on the primary injection (PI):
PIAB Align staff roles, behaviour and measures with the practice goal of excellent timely health care at a profit (or within budget).
This PI requires that the following secondary injections called the engines of harmony in the TOCICO Dictionary are implemented (not shown in a figure):
I Each person knows exactly how he or she and other staff contribute to the practice and knows that his or her contribution will be recognised;
I All policies, rules and employees’ tasks are aligned with the practice goal and strategy;
I Gaps between staff responsibility and authority are systematically identified and removed; and
I A Process of On-going Improvement (POOGI) is implemented.
The mechanisms for this practice goal intervention are to align schedulers’ and patients’ roles with practice goal and design PASS to reduce uncertainty.
5.3. Patient responsibility-goal alignment intervention (B←D)
Let’s now examine the mode of operation of the schedulers and patients in addressing patient demand. One assumption surfaced might be: BD Patients frequently call/walk-in for an acute appointment when they have a health concern. Timeliness to different types of patients means different levels of urgency. Timely to an acute patient generally means same-day treatment. It’s not clear that this is an assumption we would want to challenge or invalidate. We in fact want to create this responsiveness in our scheduling to improve the health care outcome of acute patients. The reality, however, is that schedulers don’t already schedule patients when they need to be treated. In fact, if schedulers were already scheduling patients when needed, this entire conflict wouldn’t exist. Is there a way to invalidate this assumption? Actually, we already know, in a general way, how to invalidate it: when a patient either walks in or calls, we can immediately schedule them for a same-day appointment. This primary injection (PI) then is: PIBD Have walk-ins and call-ins call immediately to schedule a same-day acute appointment This PI provides the direction for the intervention. Now let’s examine the supporting injections developed in the FRT in which provide the details of the patient demand intervention.
Figure 9. TO WHAT TO CHANGE – FRT: Demand side with injections (I) and DEs 1 & 2.
The entry points (22, DD′, 32, 34, 6, 35, BD, 37, 38, 44, and 45 are bolded rectangles in ; 22, 23, 44, 56, 57, DD′ are off-page connectors identified with bolded text from ) are examined to determine how they impact UDEs 1 (high no-show rate) and 2 (Many patients are given appointments later than they need/desire). In constructing this intervention the following PIs and Is are identified:
PIBD Have walk-ins and call-ins call immediately to schedule a same-day acute appointment.
I6 Have emergency patients call 911.
I1 Check-in asks for and validates patient contact information; patient is given a reminder card; called a week and again a day ahead of the appointment and encouraged to cancel/change appointment early when necessary so that other patients can use the vacated appointment slot.
I32 Session buffer is used.
I46 No-shows are called that day to determine and eliminate the cause.
5.4. Clinical staff task-goal alignment intervention (A←C)
Let’s now examine the strategic planning intervention for the provider supply side by examining the relationship between the EC objective A and requirement C. Recall we had assumption AC The traditional PASS is the provider’s plan to ensure high provider utilisation. Again, this seems to be a valid assumption and one we don’t really want to invalidate because the providers being the constraint should be the most highly utilised resources in the practice, and therefore should be the practice’s constraints. Traditional medical practices recognise this fact by attempting to fill the appointment schedule far into the future to fully utilise the provider time. In contrast, the TOC approach is to implement the primary injection, PIAC Implement five focusing steps (5FS) and buffer management (BM) to improve provider utilisation. This translates to first identify the constraint then manage both the constraint and the rest of the system around it in such a way as to maximise system performance. The detailed actions (secondary injections) of this intervention of how to increase provider utilisation and patient flow redefine the roles (tasks and priorities) of all clinical staff and are provided in the schedule execution paper. Implementing steps 2 and 3 involves such actions as ensuring that the provider is never idle, full kit (prepped patient, information and supplies are immediately available to provider) and that the provider never performs work that can be performed by staff. Creating a buffer (of waiting patients) in front of providers help ensure that they are never idle and protect them from both uncertainty in demand and variability in provider processing times. The mechanism to support this intervention is to align/redefine clinical staff roles and design the PASS to support increased provider utilisation.
5.5. Provider responsibility-goal alignment intervention (C←D′)
One viable assumption that arises for the CD′ relationship is: CD′ (UDE 4) Providers set rules (using a standard template) for who they want to see, when, and for how long to ensure high utilization. This is broken by:
PI4CD′ Providers set/use/modify rules/buffers/BM (and a TOC template) for who they want to see, when and for how long to insure high utilisation.
To build the FRT in we revisit inserting injections (proposed actions identified by the sharp corner rectangles) to eliminate/reduce UDE 3 and UDE 4 (CD′ assumption also). Read from the base of the FRT to its top using If-Then logic similar to reading previous sufficiency logic diagrams. In the entry points (shown in bolded rectangles) are: AB, AC, BD, 4CD′, 21, 24, 25, and 26 represent assumptions that cause the current reality. Entry points represent nodes where actions can be taken to strengthen an assumption or substitute an injection to eliminate/reduce the UDEs. In , the assumption, CD′ (UDE 4) is replaced with PI4CD′ then we build upward in the FRT identifying additional secondary injections which provide the details for constructing the TOC PASS to eliminate UDEs 3 and 4 and achieve requirements B and C.
Figure 10. TO WHAT TO CHANGE – FRT base: Provider side with injections (I) and DEs 3 & 4.
Secondary injections (I) required to develop the intervention include:
I19 The PASS is simple.
I22 Schedulers are hired/trained to manage using a TOC PASS.
I23 Schedulers actively solicit patients for imminent empty appointment slots using a scheduling buffer.
I25 The PASS provides feedback on effectiveness and problems to manage and modify the PASS.
I26 The PASS measures the balance between appointment supply and patient demand (quantity/type).
The details of the TOC PASS are discussed later after strategic buffering and buffer management are presented. The mechanism for this intervention is proactive management.
5.6. PASS responsiveness/feedback intervention (D←→D′)
Our objective is to keep patient demand and the PASS in balance and synchronised over time. For the assumption DD′ Patient demand is constantly changing while the PASS is rigid, we identified these primary and supporting injections to construct the intervention.
PIDD′ Schedulers use rules/buffers/BM to modify the PASS for changing patient demand.
I30 Backlog buffer is used.
I31 Appointment mix buffer is used.
PI44 Execution is seamless.
Recall we have already introduced schedule and session buffers in the PASS and Patient Demand Interventions. We also must monitor these buffers to determine how and when to change the PASS to accommodate patient demand. PI44 represents the set of Interventions (PIs and supporting injections) solving the major execution problems identified in the second paper. The mechanism in this intervention is: Feedback aligns PASS (design and execution) with patient demand and provider utilisation.
5.7. Moving towards a PASS design process
The TP has led to a strawman PASS Design Process to the outpatient scheduling problem which changes the practice’s goal alignment and mode of operation and is summarised in the following six steps:
Redefine the PASS and supporting staff roles in achieving the practice goal based on a system/TOC perspective.
Identify the biggest scheduling problem(s) blocking achievement of the practice goal of providing excellent timely patient health care at a profit (within budget).
Eliminate/reduce patient demand uncertainty using a session buffer and modifying policies and rules to accommodate patient demand.
Use proactive scheduling to increase provider utilisation based on a schedule buffer.
Provide schedule design effectiveness feedforward and feedback system measures and trends using backlog and appointment mix buffers and buffer management.
Apply the change question sequence, five focusing steps, strategic buffers and buffer management to manage schedule execution (discussed and expanded in a separate paper on schedule execution).
1. Redefine the pass and supporting staff roles in achieving the practice goal based on a system/toc perspective. PIAB
Revised definition: The TOC PASS (Provider Appointment Scheduling System) is a buffered provider appointment scheduling template with supporting policies, procedures, rules, measures, strategic buffers and a buffer management system to proactively manage the patient demand and the provider schedule and its execution in the achievement of the practice goal of providing excellent timely patient health care at a profit (or within budget).
As can be seen by the definition, our PASS takes a comprehensive systems approach which uses TOC to focus attention on causes that if eliminated would result in significant system improvement. Many providers/practices have policies, procedures, rules and measures to govern patient scheduling. Many (Molfenter, Citation2013) use reminder cards, phone calls, emails, etc. Many penalise patients for missed appointments. Additionally, many use overbookings to accommodate call-ins and walk-ins at the expense of delaying current patients. Policies, procedures, rules and measures must be formalised and studied to determine the impact on patient health care and provider utilisation. When a policy, procedure, rule, or measure is ineffective in addressing a problem then someone must determine why it didn’t work and the staff, working as a team, should determine a solution to the problem.
In selecting a TOC schedule template, providers can use their existing appointment template or book. This action reduces provider resistance to change, and once buffer management is implemented providers can determine how to change their schedule (the provider supply) to best accommodate patient demand. The provider can then add/convert/move acute appointment slots to the end of each session (morning and afternoon session buffers) to accommodate acute patients. Acute appointment slots are held vacant until the current day and are only used for same-day appointments for sick patients.
Strategic buffers are integral parts of buffer management and serve to reduce the causes of under- and over-demand. Strategic buffers are used in the scheduling process to guard against uncertainty and buffer management focuses attention on what appointment time slots, patients, tasks, etc., to prioritise, expedite, identify as problems, and provide buffer management feedback for schedule improvement. Four types of strategic buffers are the scheduling buffer, the session buffer, the backlog buffer and the appointment mix buffer. Each is discussed below in the appropriate step. The scheduler/provider should be trained in setting up and using the TOC PASS.
2. Identify the biggest scheduling problem(s) blocking achievement of the practice goal of providing exellent timely patient health care at a profit (within budget). PIAC
In industry when confronted with a possible solution to their problems, many managers state: “we are unique, that won’t work here”. They are probably correct! As long as they hold that view it won’t work. To counter this argument, have the providers and staff identify what they believe is their biggest problem blocking them from achieving the practice goal. Construct an open-ended questionnaire similar to the ones described in the case background in the introduction to identify the practice, department, and personal goal; their responsibilities in achieving these goals; the biggest problem blocking goal achievement; the cause of the problem, the effects created by the problem; the conflict that is blocking them from solving the problem; etc. A new problem that is not discussed in this paper might be identified and the strawman process should be expanded to address this new problem.
3. Eliminate/reduce patient demand uncertainty using a session buffer and modifying policies and rules to accommodate patient demand. I, PIBD, I6, PI4CD′, PIDD′, I32
These primary and secondary injections redefine the roles and priorities of the providers, schedulers, check-in/ check-out personnel, patients, and others to align with the practice goal and to eliminate or reduce patient demand uncertainty. For example, PI4CD′ Providers set/use/modify rules/buffers/BM (and a TOC template) for who they want to see, when and for how long then schedulers/staff use rules/buffers/ BM to reduce/eliminate uncertainty and accommodate change. Is include:
Check-in (schedulers for call-ins) asks for and validates patient contact information (name, date of birth, telephone number (have patient give the number), address (same), email address, contact person (person to contact if cannot contact patient) (I1).
Patient is (sent) given a reminder card; called (text message) a week and again a day ahead of the appointment and strongly encouraged (in all communications) to cancel/change appointment early when necessary so that other patients can use the vacated appointment (I1 expanded).
Have walk-ins and call-ins call immediately to schedule a same-day acute appointment (PIBD).
Have emergency patients call 911 (I6).
Call no-show patients the day of the missed appointment to determine and eliminate the cause of the no-show (I46).
Appointment mix buffer is used (I31).
Have sick walk-ins and call-ins call immediately to schedule a same-day acute appointment. Session buffers are used to accommodate these sick patients (meeting EC requirement B excellent timely health care). The session buffer is defined as empty appointment slots strategically placed at session’s end (morning and afternoon) to protect the whole session against acute patient disruptions (call-ins and walk-ins). See (a). The scheduler filled the first available acute slot if possible, then the next, etc. If all slots are not used then the provider can end the session early. In the short term (today), other vacant slots (if imminent) and overbooking are used to accommodate over-demand of acute patients.
Figure 11. Strategic buffers. (a) Session buffer for acute appointments. (b) Schedule buffer for daily appointment schedules.
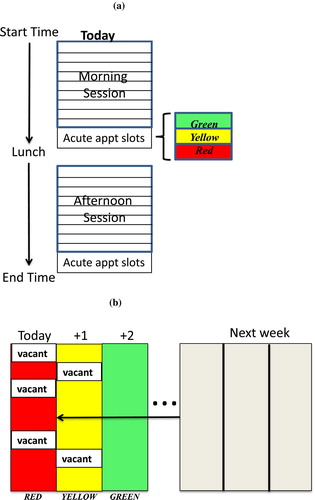
No-shows are a difficult problem for most practices; many practices charge the patient for the missed appointment, dismiss the patient from the practice after multiple no-shows, etc. In the practice studied, the contact information of about 20% of patients had changed; hence the need to proactively ask for the patient contact information on check-in for each patient. To improve any situation one must first identify the cause of the problem. For example, suppose a practice has a high no-show rate. Why? Call each patient and determine why each patient no-showed and how to prevent it from occurring again. Discuss the need to let the practice know immediately if the patient wants to cancel the appointment so that the appointment slot can be used by someone needing the appointment. Calling also lets the patient know that the practice takes no-shows seriously. Keep a list of the reasons for no-shows and determine how to address them to improve the PASS. In the practice studied, reserving same-day acute appointment slots, having other timely slots available and executing the schedule flawlessly helps reduce the probability of no-shows from over 20% to about 2% (this includes no-shows, late cancellations, and no-appointment-scheduled appointment slots).
In the longer term, how many acute slots are needs? See (a). Buffer management is used to determine and adjust this number of acute slots as patient demand changes. If session appointment slots are not used then the number of slots is reduced with the session’s first acute slot being converted to a regular appointment. If the session acute slots are consistently over-subscribed (the black region means that actual acute appointment demand is greater than the number of acute slots allocated; it is lunch time or quitting time) the appointment slot above the session buffer is converted to an additional acute appointment slot. If all acute appointment slots are used for a day then the provider is in the red region. If one acute appointment slot is unfilled then the provider is in the yellow region. If the provider has three consecutive days in red or is overbooked consistently (black) then the recovery plan might be to add an acute slot. Three green in a row means convert the first acute slot to a regular appointment slot. Be cautious as daily seasonality may exist; more acute patients call on Mondays and fewer acute patients call on Fridays, or more acute for mornings than afternoons. Once the scheduler and provider are familiar with buffer management, they can adjust the buffer regions to meet the patients’ and provider’s needs. Recall: the scheduler objectives are to maintain a full PASS and meet all same-day acute patient demand.
4. Use proactive scheduling to increase provider utilisation based on a schedule buffer. I23
The schedule buffer guards against disruptions (provider idleness, S > D) caused by no appointment scheduled (NAS), late cancellations and seasonality. Schedulers should use the schedule buffer to pull patients forward in the schedule to fill the vacant slots. The schedule buffer is defined as the provider’s appointment schedule for the next three days. The first day (today) is considered the red region; the second day (tomorrow) the yellow region; and the third day (day after tomorrow) the green region. The black region is penetrated when the scheduler’s actions failed and an unfilled appointment slot has occurred. The purpose of the schedule buffer is to increase provider utilisation (EC requirement C) by filling imminent appointment slots (the red region) with patients having appointments in greater than three days to a week into the future. See (b). This pulling patients forward also creates vacant slots in the near future thus providing opportunities for other patients to set up appointments in the near term (for example, hospital follow-up appointments). Each day the scheduler contacts patients with later appointments to determine if they would like to move their appointment forward to fill empty slots today (red region). The scheduler tries to fill the earliest empty appointment slot available first, then the next (without using acute appointment slots). Historically, about 80% of patients prefer to move forward. A given number of patients are unable to move to today but some move to tomorrow (yellow region).
Seasonality of demand exists: fewer appointments are needed by patients in summers (20 + % vacant slots in the practice studied) and more acute appointments are needed in winters. The PASS should be flexible to accommodate this seasonality by providing many more physicals slots (and also less acute slots) in the schedule in summers (this action also provides a better patient health baseline) and by providing more acute appointment slots (less physicals slots) in the schedule in winters (this action allows same-day treatment of acute patients thus reducing emergency room visits and hospital admissions).
5. Provide schedule design effectiveness feedforward and feedback systems measures and trends using backlog and appointment mix buffers and buffer management. PIDD′, I30, I31, I25, I26, I46
Recall we discussed the session and schedule buffers under steps 3 and 4, respectively. The PASS also uses buffers to provide feedback on schedule effectiveness and in the identification of problems to assist in managing and modifying the PASS. The backlog buffer and appointment mix buffers serve as feedback systems to determine when an imbalance exists between provider supply and patient demand. The backlog and appointment mix buffers measure the size (measured as the number of days of work) of the filled or committed appointments against buffer region boundaries set by the provider.
Suppose the provider sets the yellow-red boundary at 15 days (3 weeks) of committed appointments (crossing this boundary means providers want the scheduler to notify them that the backlog is unacceptable and the recovery plan should be implemented immediately) and the green-yellow boundary at 10 days for the backlog buffer (crossing this boundary means that the scheduler and provider should develop the recovery plan in case the backlog grows to 15 or more days). The actual backlog of the provider is then measured based on the committed provider capacity of existing appointments. An example of a backlog buffer is provided in (a). The backlog buffer represents the theoretical polar ends of the two scheduling requirements: appointment timeliness and provider utilisation. Traditional thinking is that on one hand timeliness correlates with having a small backlog while on the other hand high provider utilisation correlates with having a big backlog. Interestingly, reality is the bigger the backlog the higher the probability that the patient will find an alternative treatment source then no-show.
Figure 12. Backlog and appointment mix buffers. (a) Backlog buffer for daily appointment schedules. (b) Appointment mix buffer: Example of hospital follow-up appointment buffer.
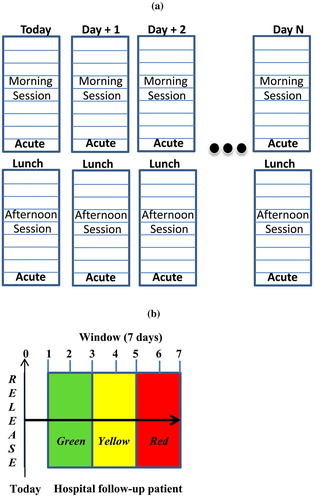
TOC breaks this dilemma by having the scheduler use a schedule buffer to manage provider utilisation and a session buffer to insure patient timeliness. How big should the backlog of filled appointments be to meet both requirements? It depends on the appointment type and patient needs. Where should the provider/ practice set red–yellow–green boundaries for the buffer regions and what are the recovery plans for each appointment type? What is the soonest that a new or current patient can get an appointment with the provider? What is an acceptable appointment backlog (green–yellow boundary)? What is an unacceptable appointment backlog (yellow–red boundary)? Recall Oppenheim, Bergman, and English (Citation1979) suggest that a time interval greater than two weeks between scheduling the appointment and the appointment date increases the probability of the patients failing to keep the appointment. This two-week interval might be a good starting yellow-red boundary and through the use of buffer management these boundaries should be reduced as the practice, providers, schedulers and patients become comfortable with their new roles.
Action plans should be devised for each region boundary. For example when a provider moves into the red region what is the recovery plan? The recovery plan may include the provider working overtime; the provider not accepting new patients; or the practice shifting patients to another provider. At the practice level, if all providers have a significant backlog should an additional provider be hired? Recall that the backlog of patients for family practice providers was 19.5 days in 2014 and 24.1 days in 2017 with no or only reactive management of the appointment schedule.
For each appointment type, the backlog should be measured and monitored by the scheduler. The boundaries for the appointment mix buffer should be set by the provider (given government/ insurance regulations) and should not be the same for all appointment types. For example, recall many insurance companies dictate that hospital follow-up appointments must be within 7 days of the patient being released from the hospital. Set the release date to today as in (b). The provider probably doesn’t want to see the patient in the first days after release therefore the green zone might be days 2 and 3; the yellow zone days 4 and 5 and the red zone days 6 and 7. Similarly, the government or insurance companies require a minimum interval between annual physicals of say 12 months. Less than 12 months is the black region, an unauthorised physical (no reimbursement).
The backlog for a specific type of appointment is measured by asking: what is the soonest a patient can schedule a physical, for example? This response provides the backlog for physicals and is measured against the provider appointment mix buffer for physicals. The provider sets the green–yellow, yellow–red boundaries and red–black boundaries answering: what is an acceptable backlog of physicals (green–yellow boundary)? What is an unacceptable backlog of physicals (yellow–red boundary)? Is the provider in the green, yellow, red, or black region? The provider should have established action plans for each boundary. Of course if the patient has a serious health concern then schedule an acute appointment to address that concern today and based on that visit potentially schedule a physical. The scheduler should know the current backlog, buffer regions and actions by appointment type.
What are the recovery plans for each type of appointment? For physicals the plans might include converting other appointment types to physicals; or planning a day (or time segment) of overtime for only physicals or in the longer term more physicals can be scheduled in the summer. The practice can offload some physicals to another provider having idle capacity. Many options exist for solving a problem; the critical issue is that providers know ahead of time that their schedule is getting into trouble and the source of the trouble. They can then proactively manage their schedule while more options are available.
6. Apply the change question sequence, 5 focusing steps, strategic buffers and buffer management in schedule execution. PIAC
Schedule execution is discussed in a separate paper. In addition to completing the currently now full schedule on time, by improving patient flow, significant capacity for additional appointments is freed up.
6. Summary and discussion
6.1. Brief summary
Many ill-structured wicked chronic problems exist in health care (emergency departments, admissions, staffing, operating room, etc.) and other vital industrial sectors (government, education, etc.). In contrast to traditional highly sophisticated mathematical modelling (reductionist) methodologies TOC focuses on finding a satisficing and simple common-sense solution to these problems. TOC provides three POOGI for identifying and addressing these types of problems. It provides a systems view of the situation focusing on identifying the core problem and its causal linkages to the UDEs thus allowing a comprehensive solution to the problem. TOC also differs from system dynamics in that TOC POOGI provide strategic focusing mechanisms to both rapidly and significantly improve system performance.
In the literature critique Section 2.3, eight criteria were proposed to evaluate the TOC or any proposed PASS. Since we have only discussed the schedule design in this paper, the evaluation of the process must wait until the schedule execution research is presented. In that second paper we discuss how to improve schedule execution (staying on schedule) by again using the three TOC POOGIs. Interestingly, in the practice studied the implementation of the TOC execution solution in the patient-provider flow allowed four TOC providers to increase the number of slots available in their schedules by 3–5 slots per day and two providers to virtually eliminate after hours work in a few months. This 15–25% increase in capacity was realised in addition to executing a now full schedule (2% combined no-show, late cancellation and no-appointment-schedule rate versus pre-implementation a 20 + % no-show rate and a 20 + % summer seasonality) with providers and patients generally starting and finishing on time! PASS limitations are discussed in the execution paper.
6.2. Implications of results for practitioners
The research results offer a comprehensive solution to this chronic problem. Frustration among clinical staff based on fire-fighting daily problems is high. No solution seems apparent. By implementing the solution described providers start with their existing appointment schedule and buffer management identifies the various system problems. The provider is able to understand the source of the problem and a direction of a solution. One change at a time in both design and execution is recommended so that everyone can see the impact of the change and modify the actions if needed. This approach to addressing the biggest system problem first each week rapidly accelerates improvement. After 6–8 weeks the schedule is stabilised.
A warning is required: both scheduling design and scheduling execution must be implemented to achieve organisation success. If one eliminates the empty slots and no-shows in the schedule then the provider and staff will be overwhelmed with patients. Appointments will get further off schedule and frustrations will increase causing both patients and providers to revert to past habits. The patient flow must simultaneously be addressed as scheduling changes are made.
Change is very uncomfortable for everyone. Providers must recognise that their PASS is the source of many practice problems. Each provider must be willing to modify the PASS to achieve a balance between supply and demand. Clinical staff (and other staff involved in the patient flow) must recognise that their job is not to do the best that they can at their own jobs but to do the best job they can at supporting and improving patient flow and provider focus. This new paradigm is in direct opposition to local optima (doing the best I can at my job).
6.3. Implications of results for academics
We were asked by a reviewer to discuss the role of the operations researcher with respect to using optimisation methods on these ill-structured problems. We were asked by another reviewer to include a discussion of “wicked problems”. In a Management Science editorial, Churchman (Citation1967 B141–2) discussed a seminar Rittel gave on wicked problems and stated: “one is led to conclude from the discussion that the membership in the class of nonwicked problems is restricted to the arena of play: nursery school, academia and the like”. Further, in discussing the operations researchers’ approach to taming wicked problems Churchman stated: “Sometimes, as in OR, it consists of “carving off” a piece of the problem and finding a rational and feasible solution to this piece. In the latter case, it is up to someone else (presumably a manager) to handle the untamed part… A better way of describing the OR solution might be to say that it tames the growl of the wicked problem: the wicked problem no longer shows its teeth before it bites…”. Churchman then asked: “To what extent are we morally responsible to inform the manager in what respect our “solutions” have failed to tame his wicked problems?”.
While Churchman questions the moral character of operations researchers, the TOC view is that people are good; systems are the cause of illogical actions. Probably the tenure and promotion systems of most academic institutions in support of their college’s goal of accreditation and/or improvement in the best colleges’ rankings promote the publishing of “scientific” research in top tier academic journals. This objective is then translated by academics into publishing “highly sophisticated” mathematical models as this is viewed as “scientific” by the academic journal editors. It is a self-perpetuating system! Relevance to practitioners in solving real ill-structured wicked chronic problems plays no part in research evaluation.
Maybe a different approach to conducting research and a different research methodology are required. First, the recognition that the problem exists in a highly uncertain environment and that under this condition, optimisation is not appropriate. Second, answer the question: How can one eliminate the uncertainty and causalities of the environment to allow the researcher to focus on only one or two factors? Third, objectively assess the value of the research contribution to advancing a real organisation’s performance. What assumptions and conditions have the researcher made to simplify the problem for the sake of constructing a sophisticated mathematical model? Perhaps research value criteria should be established a priori by knowledgeable practitioners.
With respect to using non-optimisation models to address wicked problems, simulation methodologies might be quite useful if based on the CQS. Modelling the causal relationships found in the CRT and then extended these causal relationships to measure the impact of the proposed actions (defined in the FRT) to determine if the causal model is valid. This approach might also be effective in building robust models to increase the generalisability of model recommendations.
More generally the TOC TP might also provide a bridge to address the debate over rigour or relevance by providing more rigour to qualitative research. The evolution of qualitative business research is marked by the application of more rigour over time. Jackson (Citation1926) described the development of and teaching with cases at Harvard University. For decades, case studies provided descriptions of a situation without any emphasis on research. Eisenhardt (Citation1989) describes case study research as a process of inducting theory based on case studies “from specifying the research questions to reaching closure”. Action research (Coghlan, Citation2011; Coughlan & Coghlan, Citation2002), design science (van Aken, Citation2004; Dresch et al., Citation2015; Holmström et al., Citation2009), and action design science (Sein, Henfridsson, Puarao, Rossi, & Lindgren, Citation2011) are similar problem-solving methodologies (as opposed to case study research) used in organisations to determine actions to change the current situation to a desired situation. Design science is supported by a means-ends analysis to determine how to achieve a specific goal (or what the results would be if a specific means is implemented). As a stage in continuing this evolution, the CQS (and the Goldratt thinking processes) offers a logic-based methodology to strengthen action research and design science. CQS uses a form of abductive logic to provide guidance in identifying the core problem (Q2 what to change) that must be addressed (Design science might be addressing symptoms of the core problem); linking surface problems to the core problem (still Q2); identifying primary and supporting actions to address the problem (Q3); developing a project plan for achieving the desired state (Q4); and determining how to measure and sustain the change (Q5). In determining the core problem, the researcher is using abductive logic to determine the best explanation (of the cause or effect) in surfacing the contingency factors (the underlying assumptions) that must be addressed to change the situation. These assumptions can then be challenged and actions taken to ensure the desired state (the FRT) is achieved. A primary function of building the FRT is to determine what can go wrong and what supporting actions are needed to block this negative outcome.
This research is a theory-building effort; as such, it like all prototypes has flaws. According to Goldratt (Citation2008) a major purpose of a prototype is to identify what works and what doesn’t so that one can improve the process. Using the academic research to establish that the UDEs were universal of many outpatient practices helped provide a solid foundation to an otherwise case-like application. Each medical practice is different; note from your own past experience in almost every implementation, the manager says: “that won’t work here, we are unique!” They are unique and that uniqueness may make a completely generalised solution inappropriate. Maybe 80% of this strawman process applies to all practices (but this 80% might be different for each practice); hence the need exists to check the underlying assumptions related to the various parameters (factors) to determine what is needed and not needed for an effective solution in a specific environment.
While not the purpose of this research, the TP offer potential for improving the application of design science. To support their discussion of moving from practice to theory in research (Holmström et al., Citation2009) provide an excellent discussion of design science and exploratory and explanatory research stages in an attempt to strengthen qualitative research in supporting problem solving. The CQS has been used effectively in thousands of organisations by consultants and practitioners to address chronic problems by diving from symptoms to core problem. Perhaps the CQS should be integrated into this design science methodology to include a methodology to identify core problems and their causal relationships to other organisation problems. This use of logic strengthens the problem-solving aspects of design science. Holmström et al. (Citation2009) point out that solving an organisation’s problem doesn’t constitute a scientific breakthrough. However, when a chronic, ill-defined and ill-structured problem exists and has been studied by academic and practitioner researchers for decades and no viable solution has been found then a new problem-identification and solution approach is warranted. The UDEs uncovered when conducting the action research were later determined to exist in numerous research efforts conducted by both academics and practitioners. This finding supported the existence of the UDEs in many outpatient environments. Next, taking these UDEs back to the practice to confirm their existence and causalities to other UDEs, to the core problem, and to actions to address the problem contributed to the generalisability of the findings. A generic strawman process is proposed in this research for further testing in different outpatient PASS environments. Using the CQS and the TP the strawman process can be refined and modified to apply to a larger range of different environments.
TOC offers a different way of looking at real organisation problems. It uses framing (Mabin & Davies, Citation1995, Citation2001) to gain different stakeholders’ (note in our case application, partners, providers, certified medical assistants, check-in, schedulers, business managers, and others were queried) perspectives to determine and address the organisation’s core problem. Maybe these TOC tools could provide the foundation for teaching and researching business problem identification and solving.
One limitation is noteworthy. The TP are easy to learn but not easy to apply. One must ask again and again: “Why does this effect exist?” Once the cause is determined, under what conditions (assumptions) does the effect occur? Validation of the causal relationships is the key to effective causal diagrams. Challenging the way one perceives a situation is extremely difficult. In teaching the TP to managers, academics, and students, many times I have heard the comment that I have never thought so hard for so little (one sheet of paper and three days of work). I am reminded of a discussion I had with several managers at a large company about this same topic of using logic for solving an ill-structured problem. I asked them how long the problem had existed. Their response after some discussion was: over thirty years! My response was: isn’t investing three days’ time of a room full of executives worth the elimination of a major chronic problem that has existed thirty years. There was no more complaining. The problem was solved. Ironically, once the problem was analysed using logic, the solution was obvious and common sense.
Acknowledgements
The authors wish to acknowledge the partners, providers, clinical support staff, scheduling supervisor (Linda Buff) particularly Tim and Laurie Robinson MDs who lead the TOC implementation in 2010 and to the individuals involved in the practice audit six years later. We would also like to thank the anonymous reviewers (one giving a traditional OR perspective and the other a TOC perspective; both helped us clarify and document many points in the paper) and two editors who have provided valuable objective comments. The editing staff also did an excellent job in assisting us.
Disclosure statement
No potential conflict of interest was reported by the authors.
References
- Abrams, L. (2013). How much does it cost to go to the ER? Health. Retrieved April 8, 2017, from https://www.theatlantic.com/health/archive/2013/02/how-much-does-it-cost-to-go-to-the-er/273599/
- Ackoff, R. L. (2002). Russell L. Ackoff. Interviewed by G. Detrick. Academy of Manugement Learning and Education, 1(1), 56–63.
- Ahmadi-Javid, A., Jalali, Z., & Klassen, K. J. (2017). Outpatient appointment systems in healthcare: A review of optimization studies. European Journal of Operational Research, 258(1), 3–34.10.1016/j.ejor.2016.06.064
- Ashlag, Y. (2014). TOC thinking: Removing constraints for business growth. Barrington, MA: The North River Press Publishing Corporation.
- Bailey, N. T. J. (1954). Queuing for medical care. Journal of the Royal Statistical Society, 16, 80–87.
- Bard, J., Shu, Z., Morrice, D., Wang, D., Poursani, R., Leykum, L., … Wang, D. E. (2016). Improving patient flow at a family health clinic. Health Care Management Science, 19(2), 170–191.10.1007/s10729-014-9294-y
- Berg, B.P., Denton, B. T., Ayca Erdogan, S., Rohleder, T., & Huschka, T. (2014). Optimal booking and scheduling in outpatient procedure centers. Computers and Operations Research, 50, 24–37.10.1016/j.cor.2014.04.007
- Brailsford, S.C., Lattimer, V. A., Tarnaras, P., & Turnbull, J. C. (2004). Emergency and on-demand health care: Modelling a large complex system. Journal of the Operational Research Society, 55, 34–42.10.1057/palgrave.jors.2601667
- Cayirli, T., & Gunes, E. D. (2014). Outpatient appointment scheduling in presence of seasonal walk-ins. Journal of the Operational Research Society, 65(4), 512–531.10.1057/jors.2013.56
- Cayirli, T., & Veral, E. (2003). Outpatient scheduling in health care: A review of the literature. Production and Operations Management, 12(4), 519–549.
- Cayirli, T., Veral, E., & Rosen, H. (2006). Designing appointment scheduling systems for ambulatory care services. Health Care Management Science, 9(1), 47–58.10.1007/s10729-006-6279-5
- Cayirli, T., Yang, K. K., & Quek, S. A. (2012). A universal appointment rule in the presence of no-shows and walk-ins. Production and Operations Management, n/a–n/a.
- Cees, D. S. (2011). An empirical investigation of scheduling performance criteria. Journal of Operations Management, 29(3), 181–193.
- Chakraborty, S., Muthuraman, K., & Lawley, M. (2010). Sequential clinical scheduling with patient no-shows and general service time distributions. IIE Transactions, 42(5), 354–366.10.1080/07408170903396459
- Chew, S. F. (2011). Outpatient appointment scheduling with variable interappointment times. Modelling & Simulation in Engineering, 2011, 1–9.
- Chung, M. K. (2002). “Tuning up your patient schedule.” Journal of Family Practice Management, 41, 41–45.
- Churchman, C. W. (1967). Guest editorial: Wicked problems. Management Science, 14(4), B141–B142.
- Coghlan, D. (2011). Action research: Exploring perspectives on a philosophy of practical knowing. Academy of Management Annals, 5, 53–87.10.1080/19416520.2011.571520
- Coughlan, P., & Coghlan, D. (2002). Action research for operations management. International Journal of Operations & Production Management, 22(2), 220.10.1108/01443570210417515
- Cox, J. F., III, Boyd, L. H., Sullivan, T. T., Reed, R. A., & Cartier, B. (2012). The TOCICO dictionary. New York, NY: McGraw-Hill Companies.
- Cox, J. F., & Robinson, E. G. (2017). Applying Goldratt’s thinking processes to prevent mistakes. Human Systems Management, 36(4), 315–340.10.3233/HSM-17116
- Cox III, J. F., & Schleier Jr, J.G. (2010). Theory of constraints handbook. New York, NY: NY, McGraw-Hill Publisher.
- Davies, J., Mabin, V.J., & Balderstone, S.J. (2005). The theory of constraints: A methodology apart?—A comparison with selectedOR/MS methodologies. Omega, 33, 506–524.10.1016/j.omega.2004.07.015
- Dettmer, J. (2018). Britain’s national health service engulfed in crisis. Washington, DC: Voice of America. Retrieved from https://www.voanews.com/a/britain-heath-service-engulfed-in-crisis/4198252.html
- Doyle, D. (2013). Emergency rooms continue to serve as patients’ primary-care provider. Physicians Practice. Retrieved from http://www.physicianspractice.com/blog/emergency-rooms-continue-serve-patients-primary-care-provider.2017
- Dresch, A., Lacerda, D. P., & Antunes Jr, J. A. V. (2015). Design science research: A method for science and technology advancement. Basel: Springer International Publishing.
- Eisenhardt, K. M. (1989). Building theories from case study research. Academy of Management Review, 14(4), 532–550.
- Erdogan, S. A., & Denton, B. (2013). Dynamic appointment scheduling of a stochastic server with uncertain demand. INFORMS Journal on Computing, 25(1), 116–132.10.1287/ijoc.1110.0482
- Faye, B. (2017). Emergency rooms vs. urgent care centers. Retrieved April 8, 2017, from https://www.debt.org/medical/emergency-room-urgent-care-costs/
- Fisher, R., & Ury, W. L. (1983). Getting to yes: Negotiating agreement without giving in. New York, NY: Penguin Books.
- Flagle, C. D. (1962). Operations research in the health services. Operations Research, 8(5), 591–603.10.1287/opre.10.5.591
- Goldratt, E. M. (1988). Computerized shop floor scheduling. International Journal of Production Research, 26(3), 443–455.10.1080/00207548808947875
- Goldratt, E. M. (2008). The choice. Great Barrington, MA: The North River Press.
- Goldratt, E. M. (2010). Chapter 1 Introduction to TOC–My perspective. In Theory of constraints handbook. J. F. Cox III & J. G. Schleier Jr. New York, NY: McGraw-Hill Publisher.
- Goldratt, E. M., & Cox, J. (1984). The goal: Excellence in manufacturing. Croton-on-Hudson, NY: North River Press.
- Goldratt, E. M., & Cox, J. (1992). The goal: A process of ongoing improvement. Croton-on-Hudson, NY: North River Press.
- Goldratt, E. M., Schragenheim, E., & Ptak, C. A. (2000). Necessary but not sufficient. Great Barrington, MA: North River Press Publishing Corp.
- Green, L. V., & Savin, S. (2008). Reducing delays for medical appointments: A queueing approach. Operations Research, 56(6), 1526–1538.10.1287/opre.1080.0575
- Green, L. V., & Savin, S. (2010). Reducing delays for medical appointments: A queueing approach. Operations Research, 56(6), 1526–1538.
- Gupta, D., & Denton, B. (2008). Appointment scheduling in health care: Challenges and opportunities. IIE Transactions, 40, 800–819.10.1080/07408170802165880
- Hassin, R., & Mendel, S. (2008). Scheduling arrivals to queues: A single-server model with no-shows. Management Science, 54(3), 565–572.10.1287/mnsc.1070.0802
- Holmström, J., Ketokivi, M., & Hameri, A.-P. (2009). Bridging practice and theory: A design science approach. Decision Sciences, 40(1), 65–87.10.1111/deci.2009.40.issue-1
- Huang, Y.-L., Hancock, W. M., & Herrin, G. D. (2012). An alternative outpatient scheduling system: Improving the outpatient experience. IIE Transactions on Healthcare Systems Engineering, 2(2), 97.10.1080/19488300.2012.680003
- Huang, Y., & Zuniga, P. (2012). Dynamic overbooking scheduling system to improve patient access. Journal of the Operational Research Society, 63(6), 810–820.10.1057/jors.2011.83
- Huppatz, D. J. (2015). Revisiting Herbert Simon's “science of design”. Design Issues, 31(2), 29–40.10.1162/DESI_a_00320
- Jackson, J. H. (1926). The case method. Accounting Review, 1(1), 108–111.
- Josephson, J.R., & Josephson, S.G. (1994). Abductive inference: Computation, philosophy, technology. Cambridge: Cambridge University Press.10.1017/CBO9780511530128
- Kaandorp, G. C., & Koole, G. (2007). Optimal outpatient appointment scheduling. Health Care Management Science, 10, 217–229.10.1007/s10729-007-9015-x
- The Kaiser Family Foundation. (2013). Assessing the effects of the economy on the recent slowdown in health spending. The Henry J. Kaiser Family Foundation.
- Katz, J. H. (1969). Simulation of outpatient appointment systems. Communications of the ACM, 12(4), 215–222.10.1145/362912.362930
- Kim, S., Mabin, V. J., & Davies, J. (2008). The theory of constraints thinking processes: Retrospect and prospect. International Journal of Operations & Production Management, 28(2), 155–184.10.1108/01443570810846883
- Klassen, K. J., & Rohleder, T. R. (1996). Scheduling outpatient appointments in a dynamic environment. Journal of Operations Management, 14(2), 83–101.10.1016/0272-6963(95)00044-5
- Klassen, K. J., & Rohleder, T. R. (2004). Outpatient appointment scheduling with urgent clients in a dynamic, multi-period environment. International Journal of Service Industry Management, 15(2), 167–186.10.1108/09564230410532493
- Klassen, K. J., & Yoogalingam, R. (2013). Appointment system design with interruptions and physician lateness. International Journal of Operations & Production Management, 33(3–4), 394–414.10.1108/01443571311307253
- Knight, A. (2014). Pride and joy. Church Farm, Aldbury, Hertz: Linney Group Ltd.
- Kopach, R., DeLaurentis, P.-C., Lawley, M., Muthuraman, K., Ozsen, L., Rardin, R., … Qu, X. (2007). Effects of clinical characteristics on successful open access scheduling. Health Care Management Science, 10(2), 111–124.10.1007/s10729-007-9008-9
- Kozlowski, D., & Worthington, D. (2015). Use of queue modelling in the analysis of elective patient treatment governed by a maximum waiting time policy. European Journal of Operational Research, 244(1), 331–338.10.1016/j.ejor.2015.01.024
- LaGanga, L. R. (2011). Lean service operations: Reflections and new directions for capacity expansion in outpatient clinics. Journal of Operations Management, 29(5), 422–433.10.1016/j.jom.2010.12.005
- LaGanga, L. R., & Lawrence, S. R. (2007). Clinic overbooking to improve patient access and increase provider productivity. Decision Sciences, 38(2), 251–276.10.1111/deci.2007.38.issue-2
- LaGanga, L. R., & Lawrence, S. R. (2008). Clinic no-shows and overbooking: Reflections and new directions in appointment yield management. Decision Sciences Institute Conference, Baltimore, MD, Decision Sciences.
- LaGanga, L. R., & Lawrence, S. R. (2012). Appointment overbooking in health care clinics to improve patient service and clinic performance. Production and Operations Management, 21(5), 874–888.10.1111/poms.2012.21.issue-5
- Learn.org. (2018). World's largest education & career help desk. Retrieved January 18, 2018, from https://learn.org/.
- Liang, B., Turkcan, A., Ceyhan, M. E., & Stuart, K. (2015). Improvement of chemotherapy patient flow and scheduling in an outpatient oncology clinic. International Journal of Production Research, 53(24), 7177–7190.10.1080/00207543.2014.988891
- Lindh, W. Q., Pooler, M., Tamparo, C. D., & Dahl, B. M. (2010). Delmar’s comprehensive medical assisting: Administrative and clinical competencies. Stamford, CT: Cengage Learning.
- Lindley, D.V. (1952). The theory of queues with a single server. Proceedings Cambridge Philosophy Society, 48, 277–289.10.1017/S0305004100027638
- Lowes, R. (2008). Smarter scheduling puts YOU in control. (cover story). Medical Economics, 85(2), 50–57.
- Mabin, V. J., & Balderstone, S. J. (2000). The world of the theory of constraints: A review of international literature. Boca Raton, FL: St. Lucie Press.
- Mabin, V. J., & Balderstone, S. J. (2003). The performance of the theory of constraints methodology: Analysis and discussion of successful TOC applications. International Journal of Operations & Production Management, 23(6), 568–595.10.1108/01443570310476636
- Mabin, V. J., & Davies, J. (1995). Decision framing as a creative problem structuring aid. Proceedings of the 31st Annual Conference of ORSNZ, Wellington.
- Mabin, V. J., & Davies, J. (2001). Mistaken identity or multiple identities? A case for multiple frames. Proceedings Twenty Naught One, 36th Annual Conference of the ORSNZ, Christchurch.
- Macharia, W. M., Leon, G., Rowe, B. H., Stephenson, B. J., & Haynes, R. B. (1992). An overview of interventions to improve compliance with appointment keeping for medical services. Journal of the American Medical Association, 267(13), 1813–1817.10.1001/jama.1992.03480130129038
- Mageshwari, G., & Kanaga, E. G. M. (2012). Literature review of patient scheduling techniques. International Journal on Computer Science and Engineering, 4(3), 397–401.
- Mak, H.-Y., Rong, Y., & Zhang, J. (2015). Appointment scheduling with limited distributional information. Management Science, 61(2), 316–334.10.1287/mnsc.2013.1881
- Merritt Hawkins. (2017a). 2017 Survey of physician appointment wait times. Dallas, TX: Merritt Hawkins.
- Merritt Hawkins. (2017b). Physician supply considerations: The emerging shortage of medical specialists. White Paper Series. Dallas, TX: Merritt Hawkins.
- Molfenter, T. (2013). Reducing appointment no-shows: Going from theory to practice. Substance Use & Misuse, 48(9), 743–749.10.3109/10826084.2013.787098
- Murray, M. (2000). Same-day appointments: Exploding the access paradigm. Journal of Family Practice Management, 7(8), 45–50.
- Murray, M. (2005). Answers to your questions about same-day scheduling. Journal of Family Practice Management, 59–64.
- Muthuraman, K., & Lawley, M. (2008). A stochastic overbooking model for outpatient clinical scheduling with no-shows. IIE Transactions, 40(9), 820–837.10.1080/07408170802165823
- Nazarian, L. F., Mechaber, J., Charney, E., & Coulter, M. P. (1974). Effect of a mailed appointment reminder on appointment keeping. Pediatrics, 53(3), 349–352.
- Norris, J.B., Kumar, C., Chand, S., Moskowitz, H., Shade, S. A., & Willis, D. R. (2014). An empirical investigation into factors affecting patient cancellations and no-shows at outpatient clinics. Decision Support Systems, 57, 428–443.10.1016/j.dss.2012.10.048
- Oppenheim, G. L., Bergman, J. J., & English, E. C. (1979). Failed appointments: A review. The Journal of Family Practice, 8(4), 789–796.
- Perez, H. R., Beyrouty, M., Bennett, K., Baier Manwell, L., Brown, R. L., Linzer, M., & Schwartz, M. D. (2017). Chaos in the clinic: Characteristics and consequences of practices perceived as chaotic. Journal for Healthcare Quality, 39(1), 43–53.10.1097/JHQ.0000000000000016
- Peterson, T. (2016). Healthcare in America is a wicked problem. Stakeholder Health Reflection. Retrieved Stakeholder Health from https://stakeholderhealth.org/wicked-problem/
- Prentice, J. C., Davies, M. L., & Pizer, S. D. (2014). Which outpatient wait-time measures are related to patient satisfaction? American Journal of Medical Quality, 29(3), 227–235.10.1177/1062860613494750
- Rais, A., & Viana, A. (2011). Operations research in healthcare: A survey. International Transactions in Operational Research, 18(1), 1–31.10.1111/itor.2010.18.issue-1
- Reid, R. A., & Cormier, J. R. (2003). Applying the TOC TP: A case study in the service sector. Managing Service Quality: An International Journal, 13(5), 349–369.10.1108/09604520310495831
- Regopoulos, M. (1966). The principle of causation as a basis of scientific method. Management Science, 12(8), C135–C139.
- Rittel, H. W. J., & Webber, M. M. (1973). Dilemmas in a general theory of planning. Policy Sciences, 4, 155–169.10.1007/BF01405730
- Robinson, L. W., & Chen, R. R. (2003). Scheduling doctors' appointments: Optimal and empirically-based heuristic policies. IIE Transactions, 35(3), 295–307.10.1080/07408170304367
- Romme, G. L. (2003). Making a difference: Organization as design. Organization Science, 14(5), 558–573.10.1287/orsc.14.5.558.16769
- Saloner, B., Polsky, D., Kenney, G. M., Hempstead, K., & Rhodes, K. V. (2015). Most uninsured adults could schedule primary care appointments before the ACA, but average price was $160. Health Affairs, 34(5), 773–780.10.1377/hlthaff.2014.1258
- Samorani, M., & LaGanga, L.R. (2015). Outpatient appointment scheduling given individual day-dependent no-show predictions. European Journal of Operational Research, 240(1), 245–257.10.1016/j.ejor.2014.06.034
- Scavarda, A. J., Bouzdine-Chameeva, T., Goldstein, S. M., Hays, J. M., & Hill, A.V. (2006). A methodology for constructing collective causal maps. Decision Sciences, 37(2), 263–283.10.1111/deci.2006.37.issue-2
- Scheinkopf, L. (1999). Thinking for a change: Putting the TOC thinking processes to use. Boca Raton, FL: St. Lucie Press.10.1201/CRCSLPCONMGT
- Scheinkopf, L. (2010). Chapter 25 thinking processes including S&T trees. In J.F. Cox III and J.G. Schleier (ed.), Theory of constraints handbook. New York, NY, McGraw-Hill.
- Schragenheim, E., Dettmer, H. W., & Patterson, J.W. (2009). Supply chain management at warp speed: Integrating the system from end to end. Boca Raton, FL: CRC Press.10.1201/9781420073362
- Sein, M. K., Henfridsson, O., Puarao, S., Rossi, M., & Lindgren, R. (2011). Action design research. MIS Quarterly, 35(1), 37–56.10.2307/23043488
- Senge, P. M., & Sterman, J. D. (1992). Systems thinking and organizational learning: Acting locally and thinking globally in the organization of the future. European Journal of Operational Research, 59(1), 137–150.10.1016/0377-2217(92)90011-W
- Simon, H. A. (1979). Rational decision making in business organizations. American Economic Review, 69(4), 493–513.
- Singh, A. J., Cohen, J., & May, P. R. A. (1977). The experiences of a management scientist in a health care system. Columbia Journal of World Business, 12(3), 58–65.
- Smith-Daniels, V. L., Schweikhart, S. B., & Smith-Daniels, D. E. (2007). Capacity management in health care services: Review and future research directions. Decision Sciences, 19, 889–919.
- Soriano, A. (1966). Comparison of two scheduling systems. Operations Research, 14(3), 388–397.10.1287/opre.14.3.388
- Starfield, B., Shi, L., & Macinko, J. (2005). Contribution of primary care to health systems and health. The Milbank Quarterly, 83(3), 457–502.10.1111/milq.2005.83.issue-3
- Stratton, R. (2013). Buffer management in context (Encore). TOCICO International Conference: 11th Annual Worldwide Gathering of TOC Professionals, Bad Nauheim, Germany, Theory of Constraints International Certification Organization.
- Thomas, T. (2015). Staffing shortages keep vets waiting at SORCC. Medford, OR: Mail Tribune.
- van Aken, J.E. (2004). Management research based on the paradigm of the design sciences: The quest for field-tested and grounded technological rules. Journal of Managment Studies, 41(2), 219–246.10.1111/joms.2004.41.issue-2
- Wang, J., & Fung, R. Y. K. (2015). Adaptive dynamic programming algorithms for sequential appointment scheduling with patient preferences. Artificial Intelligence in Medicine, 63, 33–40.10.1016/j.artmed.2014.12.002
- Watson, K. J., Blackstone Jr, J.H., & Gardiner, S.C. (2007). The evolution of a management philosophy: The theory of constraints. Journal of Operations Management, 25, 387–402.10.1016/j.jom.2006.04.004
- Weingarten, N., Meyer, D. L., & Schneid, J. A. (1997). Failed appointments in residency practices: Who misses them and what providers are most affected? The Journal of the American Board of Family Practice/American Board of Family Practice, 10(6), 407–411.
- White, B. (2009). Health care isn’t recession-proof, says survey. Noteworthy: A family practice managment blog http://blogs.aafp.org/fpm/noteworthy/entry/health_care_isn_t_recession2014
- Woodcock, E. W. (2014). Mastering patient flow. Engelwood, CO: MGMA.
- Wright, P. D., Bretthauer, K. M., & Cote, M. J. (2006). Reexamining the nurse scheduling problem: Staffing ratios and nursing shortages. Decision Sciences, 37(1), 39–70.10.1111/deci.2006.37.issue-1
- Wu, X. D., Khasawneh, M. T., Hao, J. and Gao, Z. T. (2013). Outpatient scheduling in highly constrained environments: A literature review. 19th International Conference on Industrial Engineering and Engineering Management: Assistive Technology of Industrial Engineering.
- Zacharias, C., & Pinedo, M. (2014). Appointment scheduling with no-shows and overbooking. Production and Operations Management, 23(5), 788–801.10.1111/poms.2014.23.issue-5
- Zeng, B., Turkcan, A., Lin, J., & Lawley, M. (2010). Clinic scheduling models with overbooking for patients with heterogeneous no-show probabilities. Annals of Operations Research, 178, 121–144.10.1007/s10479-009-0569-5