
ABSTRACT
Data science, machine learning and artificial intelligence applications impact clinicians, informaticians, science journalists, and researchers. Most biomedical data science training focuses on learning a programming language in addition to higher mathematics and advanced statistics. This approach is appropriate for graduate students but greatly reduces the number of individuals in healthcare who can be involved in data science. To serve these four stakeholder audiences, we describe several curricular strategies focusing on solving real problems of interest to these audiences. Relevant competencies for these audiences include using intuitive programming tools that facilitate data exploration with minimal programming background, creating data models, evaluating results of data analyses, and assessing data science research reports, among others. Offering the curricula described here more broadly could broaden the stakeholder groups knowledgeable about and engaged in data science.
1. Introduction
A large amount of biomedical and health informatics education in data science (DS), machine learning (ML), and artificial intelligence (AI) focuses on technical aspects of these areas, such as programming languages, higher mathematics, and advanced statistics. These skills are necessary for a degree in biomedical data science, but limit involvement by many others interested in data science. As applications of ML/AI are used increasingly by clinicians, researchers, and others, there must be broader education that goes beyond the technical aspects. Some use cases may include clinicians wanting to apply ML/AI analyses to their patients and their data, informaticians being called on to implement ML/AI applications in operational informatics settings, journalists covering contemporary healthcare and interpreting innovations for lay audiences, and researchers who apply ML/AI methods in their investigations.
The recent development of visual and other “no-code” programming tools has led to the democratisation of data science. The average clinician, informatician, journalist and researcher can now apply ML/AI analyses to medical datasets of interest. Data science programs are available that minimise the need for programming or the application of mathematics approaches such as linear algebra. However, users must be cognisant of the optimal use and limitations of these tools. Regardless of the approach taken, users of ML/AI must understand important issues, such as how it is applied with vigilance (Embi, Citation2021), fairness (Kusner & Loftus, Citation2020), and responsibility in clinical care (Dorr et al., Citation2023) and clinical education (Masters, Citation2023).
It is important to develop educational approaches that are available to diverse audiences in healthcare and not just those with a background in engineering or computer science. Domain knowledge is imperative to collect appropriate data and to intelligently interpret ML/AI models. In this paper we discuss the perspectives of four groups of individuals interested in medical ML/AI (clinicians, applied informaticians, science journalists and biomedical researchers/trainees) and describe curricula developed to allow each to learn relevant competencies. This group of stakeholders is not exhaustive but represent the experiences of the authors. Other groups for whom health-domain educational experiences have been developed include senior staff and clinicians of the United Kingdom (UK) National Health Service (Gartner et al., Citation2022) and a business school (Parks, Citation2020).
2. Stakeholder Group 1: clinicians
2.1. Clinician perspective and barriers to training
ML and AI have become pervasive in healthcare. A growing number of clinicians wish to use ML/AI to explore and analyse patient data, but they may not have the programming skills, mathematics and statistics background. Asking clinicians to learn medicine, data science and a programming language is like asking them to be trilingual, no minor undertaking.
In addition to the challenge of finding knowledgeable instructors who understand data science and clinical medicine, it is challenging to find data science tools that are affordable, comprehensive and easy to use. While some clinicians may have site licences for SPSS,Footnote1 SAS,Footnote2 or JMP Pro,Footnote3 many lack access. Moreover, these statistical data science packages are expensive. For example, a licence for JMP Pro for one student is about $7,600 annually.Footnote4
2.2. Our approach
We sought a free or low-cost and highly intuitive data science platform to use for intensive workshops that would include data science: exploratory data analysis, visualisation, supervised and unsupervised learning, computer vision and text mining. Coauthor REH tested the programs listed in for several months using medical data.
Table 1. Free and open-source data science platforms, rated on scale from 0 (minimal) to 3 (maximal) functionality. (EDA = exploratory data analysis).
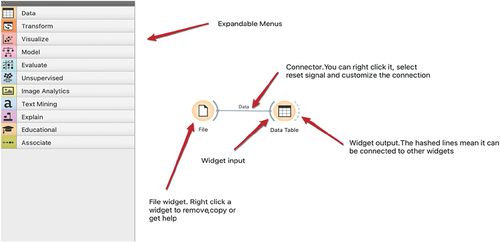
Three of the platforms are examples of visual programming: Orange,Footnote5 Knime,Footnote6 and RapidMiner.Footnote7 Users move widgets or operators around to perform data science functions, such as creating a histogram or a classification model. demonstrates Orange expandable modules on the left and an example of workflow on the right.
Figure 1. Orange menu and workflow (courtesy of Orange Data Mining).
The final decision was to use Orange as the main data science platform and use JASP to supplement Orange in certain areas of statistics where the features are not currently available in Orange. The following is a description of the two selected programs.
2.3. Orange
Orange is based on the Python programming language. It is a free and open-source program from the University of Ljubljana, Slovenia. It is used by more than 300 universities worldwide and two medical schools in the US, and continues to be updated and expanded. Orange is available for all operating systems and is fast and intuitive. Widgets are used as computational units that are used to read, process, and visualise data. Widgets are connected to each other to pass information on to the next data processing activity. The platform can perform many data preparation tasks, exploratory data analytical methods, plus supervised and unsupervised learning, image, and text mining. There are many user-friendly short cuts to save time. For example, a user can run multiple algorithms (13 algorithm categories plus stacking) at the same time and compare results. Data transformation options include:
Pivot table
Imputation
Rank
Duplicates
Merge
Group
Split data
Randomize
Continuize
Discretize
Modify columns
Modify rows
Among the algorithms available in Orange are:
Algorithms
Baseline
Decision tree
K nearest neighbour
SVM
Logistic regression
Linear regression
Naïve Bayes
Neural network
Random forest
Xgboost
Gradient boosting
Catboost and Adaboost
Stacking
A user can toggle between model training and test performance results with no additional steps. Orange workflows can be saved as.ows files in the local Documents folder so the workflow can be shared between faculty and students. Process results can also be saved as an annotated report. Most algorithms have hyperparameters that can be optimised. Models can be saved and uploaded for use with new data. Orange has 38 instructional videos and each widget has a help menu. Orange was designed as an educational tool and has been used as the analytical program in published articles in the medical literature (Peker et al., Citation2018; Vaishnav & Rao, Citation2018).
Several limitations should be noted. Orange can do image classification but cannot perform image segmentation. Orange offers several neural networks but does not include recurrent neural networks (RNNs), nor generative adversarial networks (GANs). Orange maintains all data in random-access memory (RAM) and thus is not intended for “big data”.
2.4. JASP
The acronym JASP is derived from Jeffrey’s Amazing Statistics Program, named after Sir Harold Jeffrey, a famous British statistician. This stats program was created and maintained by the University of Amsterdam in the Netherlands. JASP is available for Windows, Mac, and Linux operating systems, as well as a cloud option.Footnote8 The computational engine is the R language in the background. This program is used by more than 250 universities in 63 countries. JASP will accept Comma Separated Values (.csv), Plain text files (.txt), SPSS (.sav, but not.zsav,por) and Open Document Spreadsheet (.ods). The program is updated frequently.
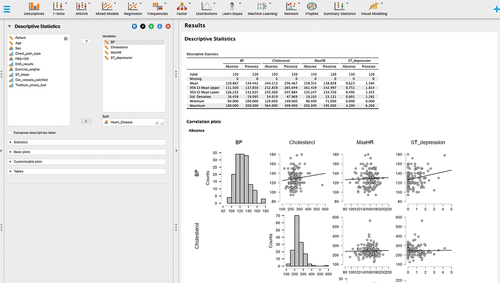
JASP is like other statistical programs, but it has several unique features. It includes both Bayesian and classical (frequentist) statistical approaches. JASP includes algorithms for supervised and unsupervised learning. JASP is a member of the Open Science Framework (OSF) so results can be shared on this collaborative platform. Data and workflow can be saved as a.jasp file. There are multiple plug-in modules to expand functionality, such as machine learning, time series, quality control and meta-analyses. Plots and graphs are publication quality. Lastly, JASP has connectivity with multiple databases. displays JASP descriptive statistics options including visualisation.
Figure 2. JASP Descriptive statistics and visualisation (courtesy of JASP).
2.5. Experience to date
REH and colleague David Patrishkoff, have used these programs since 2021 to teach monthly data workshops for clinicians in the United States. In addition, these programs are essential components in a website and forthcoming textbook, No Code Data Science.Footnote9
3. Stakeholder Group 2: applied informaticians
3.1. Perspective of applied informaticians and barriers to training
Another group of professionals who increasingly encounter ML/AI are those who work in health and clinical informatics (HCIN). While some who work in these fields have backgrounds in mathematics and computer science that enable them to carry out advanced work in wrangling and modelling, many do not. Yet almost all who work in HCIN at the present encounter ML/AI techniques and applications. They may be implementing an ML/AI tool in a clinical setting or evaluating it in a research manner. As such, an HCIN professional must have some knowledge of ML/AI to implement or evaluate tools most effectively.
3.2. Our approach
As such, co-authors SC and WRH developed a course in the Oregon Health & Science University (OHSU) Biomedical Informatics Graduate ProgramFootnote10 for such students. Entitled, Applied Data Science and Machine Learning, the course provides an overview of the application of ML/AI in health care settings. Students with modest backgrounds in programming and advanced mathematics are introduced to a wide range of topics, including identifying health care issues that can be addressed with machine learning solutions, machine learning model development and data source identification, machine learning model implementation, critical appraisal of machine learning literature, and ethical considerations for the application of ML/AI in health care. Students also identify an issue in health and develop their own machine learning model to address this issue. With some constraints, they are welcome to use their own data set.
The course is particularly aimed at HCIN students who will need to implement and critically evaluate the impact of AI systems in health care. It is designed for those who may not have the mathematics background that is required to develop machine learning applications. The course has a prerequisite of an introductory computer science course with Python programming. The topical outline of the course includes topics such as data preparation, data exploration, and model development, implementation, and evaluation. Additional topics include critical assessment of ML/AI literature, discussion of data quality issues such as data drift, and ethical considerations. The course includes content providing programming and modelling skills development. There are weekly assignments in Python or use of automated model development software, such as Orange. The course aims to give students the necessary skill development for application to each phase of the class project.
The topical outline of the course includes the following:
Overview of biomedical data science
Overview of biostatistics, machine learning and artificial intelligence
Critical assessment of machine learning literature – both development and implementation
Introduction to data sources and programming languages
Data preparation
Data exploration
Machine learning algorithms – kNN, logistic regression, decision trees, random forest, support vector machines, and neural networks
Model implementation
Ethical considerations
Learning modalities include many of those used in all courses in OHSU’s online HCIN program. These include:
Weekly voice-over-PowerPoint lectures
Textbook readings (Hoyt & Muenchen, Citation2019)
Selected articles
Programming and modelling skills development
Weekly assignments in Python or visual programming tool
Necessary skill development for application to each phase of the class project
The course also includes the option to complete model-building either using Python or a visual programming environment. While we began the course using RapidMiner, we migrated to Orange recently. While Orange is a robust tool for ML/AI, its open-source status and large global community supporting it are highly appealing.
An important part of the course is development of a project that parallels the material presented in class as well as the skills learned through homework assignments. The intent of the project is to provide a realistic machine learning model development experience. This includes not only creating the models themselves, but the selection of raw data sources, the preparation of a modelling dataset, and an implementation plan with an ethics assessment.
Another purpose of the project is to teach students to reproduce and possibly improve a published machine learning model in the literature. Students are given several papers to choose from for this purpose. We try to choose a range of topics so that at least one will be of interest. These papers use either one of two data sources for their models: Medical Information Mart for Intensive Care (MIMIC)-IVFootnote11 (which consists of de-identified electronic health care data) (Johnson et al., Citation2023) or the CDC National Health and Nutrition Examination Survey (NHANES).Footnote12 These two data sources require very different approaches for data wrangling and modelling dataset preparation. We encourage all students to obtain access to MIMIC-IV so they can do the programming exercises for EHR, even if they do not choose this source for their project.
3.3. Course project
The course project consists of four steps as follows.
Step 1. Choosing the paper and creating variable lists
A portion of this class is spent learning to prepare a modelling dataset. This process involves merging and summarising data from possibly many different files to create a single final file, which has one record per patient (this could be different for other types of models).
There are many measures, or variables, in these files. They fall into two general categories: outcome (target), and predictors. They can go by other names, such as dependent and independent. Primarily, there is one outcome variable, which is some kind of binary classification (categorical variable with two values). It is defined by the paper and does not change for a student’s model, unless it is necessary to adapt it to the techniques taught in class. The rest of the variables, predictors, are used to predict this outcome, and could be continuous, discrete or categorical.
In this step, students first create a list of the predictors and outcome variables defined in the paper as best they can. This is not always perfectly clear in these papers. They then create a list of additional predictors that they think might improve the model performance. Students need to use the data definitions for these sources to make sure it is feasible to create the predictor. Some of the techniques used in these papers are not taught in this class, so the outcome variable may need to be adapted. One example is survival outcome, which is in one of the papers. We adapt that to a binary categorical variable. Students are provided with the base dataset that has the target variable, and then prepare the predictors.
Step 2. Download data and create a data dictionary
By this step, students should know what their variables and data source are. They download the data source of their choice and create a data dictionary with the definitions of the variables that are in the proposed dataset, both from the paper and additional suggestions. They also map the predictors to the source data fields from which they are derived. Students are provided feedback on their ideas.
Step 3. Exploratory data analysis (EDA)
Implicit in this step is also the data preparation step. EDA is a set of preliminary descriptive and analytical techniques to assess and clean up the modelling dataset that students have created. This includes univariate and bivariate analyses, evaluating missing data and assessing data distributions for the modelling assumptions. They prepare a report to be turned in and will require Python programming.
Step 4. Final report
In the final report, students use their final modelling dataset to train machine learning models using six different algorithms, and select the best performing model. They do this two times, once using the original predictors published in the paper, and once using their new variables. The goal is to see if they can improve upon the published model. This report should be formatted as a journal article, with an additional implementation and ethics assessment. This model development will be done using an automated tool.
3.4. Experience to date
The course is currently an elective in our HCIN program but is likely to become a required course. It may also be expanded to additional courses as the role of ML/AI evolves in informatics education. It is likely that courses in this area will become part of the core curriculum of informatics and viewed as essential by those who accredit educational programs. Given that applied informaticians will likely be teaching the other stakeholder groups described in the paper, their understanding of the learning needs of those other groups will also be essential.
4. Stakeholder Group 3: science journalists
4.1. Science journalist perspective and barriers to training
Many professionals who do not do data science themselves nevertheless need to use and interpret its results. Journalists and science writers disseminating data science results need to be able to interpret and apply data-intensive results, without necessarily getting into data analysis themselves.
4.2. Our approach
At Columbia University Journalism School, Master of Arts students take a required semester-long course, Evidence and Inference, which introduces basic methods from several different scientific disciplines, including statistics. The course is intended to help journalists develop their critical thinking skills, under the assumption that applying styles of reasoning used by scientists can be helpful for journalists working in any domain.
Coauthor JSA developed the biostatistics module of Evidence and Inference over the course of the last 15 years. There are five learning objectives:
To describe and explain several typical approaches used to collect data relevant to public policy (study designs);
To interpret several essential descriptive statistics, and explain what they tell us about a data set;
To interpret several essential inferential statistics, and explain what they tell us about a population;
To apply these skills to reading data findings and writing about them for a public audience;
To formulate a set of critical questions to be used to interrogate new data science findings.
Although journalism students identify as sceptics and welcome the opportunity to learn how to improve their ability to critically evaluate current events, many have little formal exposure to scientific methods. As a result, the course includes lessons of different study designs (learning objective 1 above) common in epidemiology, educational research, weather prediction, and other fields. To avoid appearing too abstract, all lessons are tied to case examples from recent news events. Not surprisingly, COVID has been a terrific source of examples in recent years (Ancker, Citation2020).
Over the years, it has become clear that many journalists have mathematics anxiety. We try to develop self-efficacy in several ways. First, we conduct very simple hands-on data collection and analysis exercises using heart rates and demographics to help them start to feel familiar with basic descriptive statistics. We conduct a group walk-through of a hypothetical randomised trial to assess the impact of stress on journalist heart rates, which introduces inferential statistics and hypothesis testing. Throughout these didactic sessions, we use analogies to shape intuition before introducing any mathematical formulas (Ancker & Begg, Citation2017).
Finally, we conduct repeated practice sessions to read and interpret findings, drawing from epidemiology, informatics, census data analyses, educational research, and other fields. Every exercise involves putting numbers into English. In the first stage of these exercises, learners are coached to come up with accurate descriptions of the data, and in the second, to develop less technically accurate but more understandable descriptions for a general readership.
In one recent example, we analysed a misleading statement by the FDA Commissioner Stephen Hahn about convalescent plasma in 2020 (Harris, Citation2020). We traced it to a study from the early months of the pandemic that reported a 7-day mortality rate of 8.9% (95% CI: 6.8% − 11.7%) (Joyner et al., Citation2020). Students practice explaining the confidence interval to each other to acknowledge the inherent uncertainty in generalising from a sample to a population. For example, they might be encouraged to say: “By the end of 1 week, 8.9% of patients in the sample had died. We don’t know exactly how many would die if the treatment were given to the entire population of similar COVID patients. It would probably be somewhere around 8.9%, but we wouldn’t be very surprised it were as low as 6.8% or as high as 11.7%”. Because students recognise that this level of detail is not needed for an article for the general public, they also experiment with simpler ways of describing the data: “The research suggests that about 9% of severely ill COVID patients who receive this treatment would die within a week, although the true figure might be a little higher or a little lower”.
The most important interpretation step is to help the reader place the 9% in context. Is this a high mortality rate? A low one? To help learners think this through, we emphasise that they do not need to know the answer, but they always need to ask the question. A powerful question to ask is, “Compared to what?” (Zikmund-Fisher, Citation2019; Zikmund-Fisher & Ancker, Citation2022) For example, they might ask the researcher or another respected scientist in the field to compare the mortality rate from this study to the mortality rate that would be expected for similar COVID patients who hadn’t received the treatment. We also provide examples of types of comparisons that are useful for the reader: a study finding can be compared to the average effect, to the largest or smallest conceivable effect, or to the smallest effect that would actually benefit people in practice.
4.3. Experience to date
The statistics module of Evidence and Inference continues to be a required core course for students in the journalism MA program at Columbia. It has also been taught as an intensive for the MIT Knight Science Journalism Fellowship program, the Online News Association, and the National Association of Science Writers.
5. Stakeholder Group 4: biomedical researchers and trainees
5.1. Biomedical researcher perspective and barriers to training
All biomedical informatics research projects require a data science pipeline that consists of data collection, storage, exploration, analysis, and visualisation components; however, many biomedical researchers enter the discipline with little to no computational expertise. The number of data science focused courses being offered through business schools, in addition to more traditional mathematics, statistics, and computer science programs has increased. Very few of these courses are focused on biomedical applications, thus they present the components and tools required in biomedical data analysis in a disjoint manner.
5.2. Our approach
Here, we describe the principles and experience of designing and teaching a novel course focused on introducing biomedical researchers and trainees to data science tools, theories, and methods that serve as the foundations for advanced topics in Biomedical Informatics and enabling them to implement an end-to-end biomedical data science pipeline.
This graduate-level semester long course, Introduction to Biomedical Data Science (BMDS), has been taught for the last five years at Washington University in St Louis (WUSTL). The BMDS course is co-directed and taught by two instructors with industry and academic expertise in biomedical data science analysis and research. Coauthor AG is an Instructor in the WUSTL Institute for Informatics, Data Science and Biostatistics (I2DB) and TBP is a lecturer in the WUSTL I2DB and the Information Architect for Enlace Health, an early-stage health information technology company focused on providing solutions that power value-based healthcare initiatives.
Students taking the BMDS course have varied backgrounds and expertise, computational skills and biomedical research interests. They include clinicians across specialities such as oncology, paediatrics, radiology, and pathology, in-career biomedical researchers such as staff scientists and bioinformaticians, and graduate students from programs such as biomedical informatics, biomedical engineering, biostatistics, and data science.
5.3. Goal of course
Upon completion of the BMDS course, students will be familiar with core concepts relevant to data modelling, management and query, data manipulation and analysis, and visualisation. This course provides a hands-on introduction to fundamental principles of informatics and data analysis tools and methods including:
Data collection, exploration, integration and cleaning using graphical tools, command line interfaces and programming languages (PostgreSQL, Python, R)
Relational database modelling, data management, and querying using PostgreSQL
Data manipulation, analysis, modelling, and visualisation using Python and R
Design and development of interactive dashboards and web applications
Design principles for the course include:
Flipped Classroom: The course consists of both recorded lectures providing a sufficient theoretical basis and introduction to technical concepts that serve as the foundation for the subsequent experiential learning opportunities including hands-on laboratory sessions and course projects.
Open-access Tools: At the outset of the course, the instructors work with students to instal and configure all necessary tools and software on their individual machines such that by the end of the course they have both the knowledge and computational configuration to apply the biomedical data science concepts to their own research or day-to-day work. Additionally, all tools installed, configured and utilised throughout the course, such as PostgreSQL, pgAdmin, Excel, RStudio, RShiny, Anaconda, and Python, are open-access or freely available through an academic licence.
End-to-end Data Science Pipeline: To implement the pipeline, we focus on a driving biomedical or clinical use case, and leverage open-access clinical, genomic and complementary data sets. The BMDS course covers aspects of the following five core components necessary to design and implement an end-to-end data science pipeline:
Obtain: In the first module we introduce various ways to access, obtain, and assess the validity of relevant data. This step requires knowledge of relevant tools and data sources, applicable guidelines and regulations for accessing, storing and utilising biomedical data and approaches to assessing data and information quality, as well as an understanding of different data and file formats.
Scrub: The second module focuses on approaches to perform exploratory analysis, database modelling, data management and queries. In this module, we teach techniques to read the data and understand every feature, identify errors, missing values, and any corrupt records. We utilise a text editor and spreadsheet application, as well as programming languages such as Python and R, to apply methods for data profiling and scrubbing.
Explore: The third module is an introduction to advanced programming languages and how they can be used for data exploration and manipulation. Discovering patterns in the data through visualisations and charts, extract features using statistics to identify and test significant variables are included in this step. This phase requires programming languages skills, as well as statistics, experimental design, and data visualisation.
Model: In the fourth module, we delve deeper into data modelling and analysis. After cleaning the data and identifying important features, the next step is to assess which in-depth analytic models are most appropriate to address the problem being solved. Selection of informative and principal features, evaluation and refinement of the models are also included in this step of the data science pipeline.
Interpret: The most important step in the pipeline is to understand and learn how to explain the data science analysis results through visual communication, hence the last module covers best practices and tools for generating high-quality visualisations. Domain knowledge and data visualisation tools such as Tableau, Matplotlib, ggplot, Seaborn and RShiny are utilised during this step.
Single Real-World Dataset: To implement the end-to-end data science pipeline we use the Medical Information Mart for Intensive Care (MIMIC) data set,Footnote13 a publicly available de-identified database of more than 40,000 patients admitted to the intensive care unit at a tertiary academic medical centre in Boston, MA, which can be utilised for biomedical research.
Project-based Evaluation: Given the hands-on nature of the course, the evaluation criteria have been defined appropriately. The different components of the evaluation metrics include: weekly quizzes and take-home assignments, attendance and participation scores, final exam and a final project. For the final projects, students apply the concepts covered in class to their own research domain and implement advanced methods (machine learning, genomic or statistical). Final project topics range from clinical research informatics to population health informatics to genomic analysis.
5.4. Experience to date
A practical data science course that provides biomedical informatics students with a holistic view of a generalisable computational pipeline is essential for advanced courses in bioinformatics, biomedical data science or computer science. Students who have taken the course in the past acknowledge that one of the main advantages of taking the BMDS course is the practical skills gained that they are able to apply to their research, other course work and job duties.
6. Conclusion
There is a growing need for multiple stakeholders in healthcare, including clinicians, informaticians, science journalists, and researchers to have competence in DS, ML, AI, and related areas. Some salient themes to emerge from our analyses include an understanding of the big picture, e.g., why they are being used, how their methods are applied, and what are the concerns for when their application goes wrong, such as through biased data or algorithms. Understanding of the underlying mathematics and programming is less essential than applying and interpreting their methods and results properly. Tools making methods more accessible and understandable can aid in that understanding.
DS, ML, and AI are rapidly expanding and evolving, requiring a highly competent workforce. One of the most significant impediments to acquiring competencies in these areas has been the perceived need to learn a programming language and utilise higher mathematics and advanced statistics. Recent low code and no code software programs have levelled the playing field and allowed more healthcare workers to be involved in DS, ML and AI. Their domain knowledge and new found skills will add to the relevancy and clinical impact of studies. In this paper, we described various curricula and tools developed for these groups that appear to impart a foundation of knowledge and skills that have been disseminated to those who are not data scientists or computer scientists.
Disclosure statement
No potential conflict of interest was reported by the author(s).
Notes
4. https://www.g2.com/products/jmp/pricing
References
- Ancker, J. (2020). The COVID-19 pandemic and the power of numbers. Numeracy, 13(2). https://doi.org/10.5038/1936-4660.13.2.1358
- Ancker, J., & Begg, M. (2017). Using visual analogies to teach introductory statistical concepts. Numeracy, 10(2). https://doi.org/10.5038/1936-4660.10.2.7
- Dorr, D. A., Adams, L., & Embí, P. (2023). Harnessing the promise of artificial intelligence responsibly. JAMA, 329(16), 1347–1348. https://doi.org/10.1001/jama.2023.2771
- Embi, P. J. (2021). Algorithmovigilance-advancing methods to analyze and monitor artificial intelligence-driven health care for effectiveness and equity. JAMA Network Open, 4(4), e214622. https://doi.org/10.1001/jamanetworkopen.2021.4622
- Gartner, D., Spernaes, I., England, T. J., Behrens, D. A., Buchanan, J., & Harper, P. R. (2022). Evaluation of participants’ reaction and learning in a taught analytics and modelling academy program in U.K.‘s national health service. 2022 IEEE 10th International Conference on Healthcare Informatics (ICHI), 591–596. https://doi.org/10.1109/ICHI54592.2022.00116
- Harris, R. (2020, August 25). FDA’s Hahn apologizes for overselling plasma’s benefits as a COVID-19 treatment. NPR. https://www.npr.org/sections/health-shots/2020/08/25/905792261/fdas-hahn-apologizes-for-overselling-plasmas-benefits-as-a-covid-19-treatment
- Hoyt, R., & Muenchen, R. (Eds.). (2019). Introduction to biomedical data science. Lulu.com https://www.lulu.com/en/us/shop/robert-muenchen-and-robert-hoyt/introduction-to-biomedical-data-science/ebook/product-1244jgv7.html
- Johnson, A. E. W., Bulgarelli, L., Shen, L., Gayles, A., Shammout, A., Horng, S., Pollard, T. J., Lehman, B., Moody, B., Gow, L.-W. H., Celi, L. A., Mark, R. G., & Mark, R. G. (2023). MIMIC-IV, a freely accessible electronic health record dataset. Scientific Data, 10(1), 1. https://doi.org/10.1038/s41597-022-01899-x
- Joyner, M. J., Senefeld, J. W., Klassen, S. A., Mills, J. R., Johnson, P. W., Theel, E. S., Wiggins, C. C., Bruno, K. A., Klompas, A. M., Lesser, E. R., Kunze, K. L., Sexton, M. A., Diaz Soto, J. C., Baker, S. E., Shepherd, J. R. A., van Helmond, N., van Buskirk, C. M., Winters, J. L., Stubbs, J. R., & Casadevall, A. (2020). Effect of convalescent plasma on mortality among hospitalized patients with COVID-19: Initial three-month experience. MedRxiv: The Preprint Server for Health Sciences, 20169359. 2020 08 12, https://doi.org/10.1101/2020.08.12.20169359
- Kusner, M. J., & Loftus, J. R. (2020). The long road to fairer algorithms. Nature, 578(7793), 34–36. https://doi.org/10.1038/d41586-020-00274-3
- Masters, K. (2023). Ethical use of artificial intelligence in health professions education: AMEE Guide No.158. Medical Teacher, 45(6), 574–584. https://doi.org/10.1080/0142159X.2023.2186203
- Parks, R. F. (2020). A pedagogic experience in designing a healthcare analytics course: Lessons learned. Information Systems Education Journal, 18(5), 4–15. https://eric.ed.gov/?id=EJ1258237
- Peker, M., Özkaraca, O., & Şaşar, A. (2018). Use of orange data mining toolbox for data analysis in clinical decision making: The diagnosis of diabetes disease. In P. K. Pattnaik, A. Swetapadma, & J. Sarraf, (Eds.), Expert system techniques in biomedical science practice (pp. 143–167). IGI Global. https://www.igi-global.com/gateway/book/187083
- Vaishnav, D., & Rao, B. R. (2018). Comparison of machine learning algorithms and fruit classification using orange data mining tool. 2018 3rd International Conference on Inventive Computation Technologies (ICICT), 603–607. https://doi.org/10.1109/ICICT43934.2018.9034442
- Zikmund-Fisher, B. J. (2019). Helping people know whether measurements have good or bad implications: Increasing the evaluability of health and science data communications. Policy Insights from the Behavioral and Brain Sciences, 6(1), 29–37. https://doi.org/10.1177/2372732218813377
- Zikmund-Fisher, B. J., & Ancker, J. S. (2022). Preventing health number confusion through clear communication design. In A. Keselman, C. A. Smith, & A. J. Wilson (Eds.), Combating online health misinformation: A Professional’s guide to helping the public, 29–37. Rowman & Littlefield Publishers.