
 ?Mathematical formulae have been encoded as MathML and are displayed in this HTML version using MathJax in order to improve their display. Uncheck the box to turn MathJax off. This feature requires Javascript. Click on a formula to zoom.
ABSTRACT
Background
More recently approved drugs have significantly fewer indications than drugs approved many years ago. One possible reason for this may be that, controlling for the number of years since approval or launch, more recently approved drugs have fewer indications (e.g. at the time of launch). The role of precision and personalised medicine has increased, and the goal of precision medicine is to provide a more precise approach for the prevention, diagnosis and treatment of disease. Drugs that have fewer indications may be ‘more precise’ than drugs that have many indications.
Methods
We use different kinds of data from two countries – France and the U.S. – to analyze the relationship across many drugs between the number of indications of a drug, the drug’s vintage – i.e. the year in which the drug was first marketed or approved – and its age – the number of years it has been marketed.
Results
All the evidence from both countries indicates that, controlling for drug age, more recently approved drugs tend to have fewer indications than drugs approved many years ago. In the U.S., a 10-year increase in vintage is associated with a 10.7% decline in the effective number of indications of all drugs, and a 19.4% decline in the effective number of indications of drugs approved after 1989. In France, the positive effect on the number of indications of the increase in drug age was more than offset by the negative effect of the increase in drug vintage.
Conclusions
More recently approved drugs are less likely to be ‘general-purpose technologies’ (or even multi-purpose technologies) than older drugs. The relative importance of ‘precision medicine’ has increased in recent decades. Drugs that have fewer indications may be ‘more precise’ than drugs that have many indications.
Introduction
As noted by the European Medicines Agency (Citation2024), if a drug is used to treat, prevent, or diagnose a medical condition or disease, that disease is considered to be an indication of the drug.
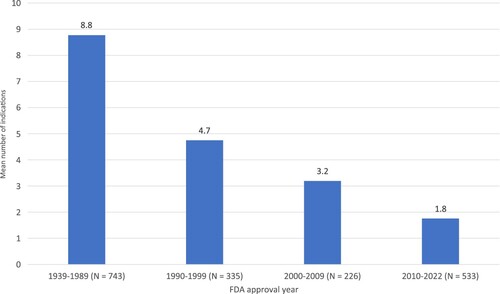
In the U.S., more recently approved drugs have significantly fewer indications than drugs approved many years ago. As shown in , which is based on indications in 2023 of 1887 drugs approved by the FDA since its inception in 1939, the mean number of indications in 2023 of the 743 drugs approved before 1990 was 8.8, almost five times as high as the mean number of indications in 2023 of the 533 drugs approved since 2010: 1.8.
Figure 1. Mean number of indications in 2023 of drugs sold in U.S., by FDA approval year. Source: author's calculations based on data in DrugCentral 2023 database (https://drugcentral.org/).
One reason why newer drugs have fewer indications may be that newer drugs have been on the market for less time, and that the number of indications of a drug tends to increase with respect to its length of time since approval. In a recent article, Vokinger et al. (Citation2023) noted that,
after the initial approval of a novel therapeutic agent, a company may seek authorization for the agent to be used to treat other conditions or illnesses … For example, pembrolizumab (Keytruda) was first approved for the treatment of advanced melanoma and subsequently approved for more than 30 supplemental indications by the US Food and Drug Administration (FDA) and more than 15 supplemental indications by the European Medicines Agency (EMA) … This trend is likely to continue given advancements in medicine, notably the growth of immunotherapies and gene therapies, which may be used to target multiple conditions.
A second possible reason why newer drugs have fewer indications may be that, controlling for the number of years since approval or launch, more recently approved drugs have fewer indications (e.g. at the time of launch). Krzyszczyk et al. (Citation2018) document the ‘growing role of precision and personalized medicine for cancer treatment.’ The National Human Genome Research Institute (Citation2024) says that ‘the goal of precision medicine is to provide a more precise approach for the prevention, diagnosis and treatment of disease.’ Drugs that have fewer indications may be ‘more precise’ than drugs that have many indications. However, the same genetic mutation may cause cancers at different sites and therefore the same drug may be approved to treat multiple different cancers thereby increasing the number of indications per drug.
In this study, we use different kinds of data from two countries – France and the U.S. – to analyze the relationship across many drugs between the number of indications of a drug, the drug’s vintage – i.e. the year in which the drug was first marketed or approved – and its age – the number of years it has been marketed. We will analyze this relationship using different kinds of data from two different countries: France and the U.S. In the first analysis, we will use data on all drug products sold in France in the years 2012, 2017, and 2022. Those data indicate the active ingredient(s), approved indication(s), and marketing year of each product. In the second analysis, we will use annual data derived from a major U.S. survey of outpatient drug prescriptions sold during the period 1996–2015. Those data indicate the drug dispensed, the (patient-reported) medical condition for which it was used, and the drug’s FDA approval year.
In a given year, the age of a drug is perfectly inversely correlated across drugs with the vintage of the drug. For example, in 2024, age = 2024 – vintage. So, if we only had data for a single year, we could not disentangle the effects of vintage and age on the number of indications. However, we have data on multiple years: 3 (2012, 2017, and 2022) in the case of France, and 20 (1996–2015) in the case of the U.S. Therefore, we will be able to separately identify the effects of vintage and age on the number of indications.
Methods
Number of indications of chemical substances sold in France in 2012, 2017, and 2022
Data on the approved indications in France of each active ingredient were obtained from the 2012, 2017, and 2022 editions of the Thériaque database, produced by the Centre National Hospitalier d’Information sur le Médicament (Citation2024). In 2022, this database contained information on over 30,000 drug products sold in France.Footnote1 For each product, the database provides (1) the CAS Registry Number(s)Footnote2 (CAS_RNs) of the substance(s) contained in the product, and (2) the ICD-10 codes of the product’s approved indications. This enabled us to compute the approved indications of products containing each CAS_RN in 2012, 2017, and 2022. The database also provides the marketing date of each product, so we could determine the first year in which any product containing each substance was marketed.
displays 2022 data on two substances to illustrate the data on indications by substance. There were 18 indications of clioquinol (CAS_RN 130-26-7), which was first marketed in 1968. There were 16 indications of infliximab (CAS 170277-31-3), which was first marketed in 2000.
Descriptive statistics, by year, are shown in . The 2012 edition of Thériaque contained data on 2455 substances. The number of indications ranged between 1 and 100; the mean number of indications was 6.1. The mean initial marketing year was 1972.6, so mean drug age was 39.5 years.
Table 1. Chemical substances sold in France: Summary statistics from 2012, 2017, and 2022 editions of Thériaque.
The 2017 edition of Thériaque contained data on 2625 substances. The mean number of indications was 6.0. The mean initial marketing year was 1975.3, so mean drug age was 41.7 years. The 2022 edition of Thériaque contained data on 2812 substances. The mean number of indications was again 6.0. The mean initial marketing year was 1978.2, so mean drug age was 43.8 years.
To identify the effects of drug vintage and age on the number of indications, we will estimate the following model:
(1)
(1) where
n_indicationsdt = the number of indications of drug d in year t (t = 2012, 2017, 2022)
vintaged = the initial marketing year of drug d
age_drugdt = the age of drug d in year t = t – vintaged
ϵdt = a disturbance
The disturbances of equation (1) will be clustered within drugs. β1 indicates the effect of a drug’s vintage on the number of indications, controlling for the drug’s age.Footnote3
Effective number of indications of chemical substances sold in the U.S., 1996–2015
To our knowledge, comprehensive time-series data on the number of approved indications of each substance, available for France from Thériaque, are not available for the U.S.Footnote4 However, by using annual data derived from a major U.S. survey of outpatient drug prescriptions sold during the period 1996–2015, we can calculate the ‘effective number’ of indications (defined below), by substance and year.
The 1996–2015 Medical Expenditure Panel Survey (MEPS) Prescribed Medicines Files (Agency for Healthcare Research and Quality, Citation2024) contain data on 3.9 million outpatient prescribed medicine events (prescriptions). Each record indicates (1) the generic name of the drug (Multum Lexicon RXDRGNAM), and (2) the household-reported medical condition associated with the event.Footnote5 The medical conditions reported by the respondent were recorded by the interviewer as verbatim text, which were then coded to fully-specified ICD-9-CM codes. The ICD-9-CM condition codes were then aggregated into clinically meaningful, mutually exclusive categories, most of which are clinically homogeneous, using Clinical Classification Software (CCS).Footnote6 This enables us to calculate:
Table
If all prescriptions of drug d in year t were for a single disease, disease_concentrationdt = 12 = 1, and n_effective_indicationsdt = 1 / 1 = 1.
If half of the prescriptions of drug d in year t were for disease A, and half were for disease B, disease_concentrationdt = 0.52 + 0.52 = 0.5, and n_effective_indicationsdt = 1 / 0.5 = 2.
However, if 90% of the prescriptions of drug d in year t were for disease A, and 10% were for disease B, disease_concentrationdt = 0.92 + 0.12 = 0.82, and n_effective_indicationsdt = 1 / 0.82 = 1.22.
Concentration indices like disease_concentrationdt, and diversity indices like n_effective_indicationsdt, have been used in economics, political science, and ecology. Economists and antitrust authorities assess the competitiveness of an industry by constructing the Herfindahl – Hirschman Index, a market concentration index equal to the sum of squared market shares of firms in the industry (U.S. Department of Justice, Antitrust Division, Citation2024). In political science, Laakso and Taagepera (Citation1979) calculated the effective number of parties index as the reciprocal of the sum of squared party vote shares in an election.Footnote8 Concentration and diversity indices calculated from sample data when the individuals of a population are classified are also used in ecology (Simpson, Citation1949).
The calculation of disease_concentrationdt and n_effective_indicationsdt is illustrated in . The top of the table shows the calculations for raloxifene, for which there were 197 MEPS prescriptions in 2012. Twelve patient-reported medical conditions were associated with these prescriptions. The most common one was osteoporosis, which accounted for 34% of the prescriptions. The effective number of diagnoses for raloxifene in 2012 was 5.34.
The bottom of the table shows the calculations for adalimumab, for which there were 301 MEPS prescriptions in 2015. Seven patient-reported medical conditions were associated with these prescriptions. The most common one was rheumatoid arthritis and related disease, which accounted for 59% of the prescriptions. The effective number of diagnoses for adalimumab in 2015 was 2.55.
To identify the effects of drug vintage and age on the effective number of indications, we will estimate the following model:
(2)
(2) where
n_effective_indicationsdt = the effective number of indications of drug d in year t (t = 1996, 1997, … , 2015)
vintaged = the FDA approval year of drug dFootnote9
age_drugdt = the age of drug d in year t = t – vintaged
ϵdt = a disturbance
Results
Estimates of equation (1) based on French data
Estimates of several versions of equation (1) are provided in . Data on all 3094 substances were used to estimate the first 3 models. In model 1, the only regressor is vintaged. The coefficient on this variable (β1) is negative and highly significant, indicating that later-vintage drugs tended to have fewer indications. In model 2, the only regressor is age_drugdt. The coefficient on this variable (β2) is positive and highly significant, indicating that drugs that have been sold for more years tended to have more indications. In model 3, both regressors are included. Controlling for age_drugdt reduces the magnitude of β1 by 29%, but the estimate of β1 is still negative and highly significant in model 3. Controlling for vintaged reduces the magnitude of β2 by 71%, but the estimate of β2 is still positive and highly significant in model 3.
Table 2. Estimates of several versions of equation (1) based on French data: ln(n_indicationsdt) = β0 + β1 vintaged + β2 age_drugdt + ϵdt.
In model 4, both regressors are again included, but only data on the 1155 substances first marketed after 1989 were used to estimate this model. As in model 3, the estimate of β1 is negative and highly significant, and the estimate of β2 is positive and highly significant. The point estimates of β1 in models 3 and 4 are virtually identical; the point estimate of β2 in model 4 is 2.3 times as large as the point estimate of β2 in model 3.
In addition to estimating equation (1) using data on all 3094 substances, we estimated equation (1) for each ATC main anatomical or pharmacological group.Footnote10 These estimates, in which both regressors are included, are shown in . The coefficient on vintaged (β1) is negative and significant for 11 of the 14 main anatomical or pharmacological groups.
Table 3. Estimates of several versions of equation (1), by main ATC anatomical or pharmacological group, based on French data: ln(n_indicationsdt) = β0 + β1 vintaged + β2 age_drugdt + ϵdt.
Estimates of equation (2) based on U.S. data
Estimates of several versions of equation (2) are provided in . Data on all 769 substances were used to estimate the first 3 models. In model 5, the only regressor is vintaged. The coefficient on this variable (β1) is negative and highly significant, indicating that later-vintage drugs tended to have fewer indications. In model 6, the only regressor is age_drugdt. The coefficient on this variable (β2) is positive and highly significant, indicating that drugs that have been sold for more years tended to have more indications. In model 7, both regressors are included. Controlling for age_drugdt has no effect on the estimate of β1. The estimate of β2 is no longer significant when we control for vintaged.
Table 4. Estimates of several versions of equation (2) based on U.S. data: ln(n_effective_indicationsdt) = β0 + β1 vintaged + β2 age_drugdt + ϵdt.
In model 8, both regressors are again included, but only data on the 336 substances first marketed after 1989 were used to estimate this model. The estimate of β1 is again negative and highly significant, and the magnitude of the estimate is 81% larger in model 8 than it is in model 7. Also, the estimate of β2 is positive and highly significant in model 8, when we confine the analysis to the 336 substances approved after 1989.
Discussion
Most of the evidence from both France and the U.S. indicates that, controlling for drug vintage, drugs that have been sold for many years tend to have more indications than drugs that have been sold for just a few years.Footnote11 All of the evidence from both countries indicates that, controlling for drug age, more recently approved drugs tend to have fewer indications than drugs approved many years ago. In France, a 10-year increase in vintage is associated with a 9.1% decline in the number of indications, of both all drugs and drugs marketed after 1989. In the U.S., a 10-year increase in vintage is associated with a 10.7% decline in the effective number of indications of all drugs, and a 19.4% decline in the effective number of indications of drugs approved after 1989.
As shown in , between 2012 and 2022, the mean age of all substances sold in France increased by 4.3 years, from 39.5 years to 43.8 years. Despite this increase, the mean number of drug indications declined by about 3.6%.Footnote12 The positive effect on the number of indications of the 4.3-year increase in drug age was more than offset by the negative effect of the 5.66-year increase in drug vintage, from 1972.6–1978.2. The net effect of the changes in drug vintage and age on Δmean(ln(n_indications)) was β1 Δmean(vintage) + β2 Δmean(age_drug) = (-.0092 * 5.66) + (.0038 * 4.33) = -.036 = −3.6%.Footnote13
Although drugs that have been sold for many years tend to have more indications than drugs that have been sold for just a few years, and the mean age of drugs sold has increased, the mean number of indications of drugs sold in France has declined. Controlling for the number of years since approval or launch, more recently approved (later-vintage) drugs tend to have fewer indications. More recently approved drugs are less likely to be ‘general-purpose technologies’ (Helpman, Citation1998) (or even multi-purpose technologies) than older drugs. The positive effect on the number of indications of the increase in drug age was more than offset by the negative effect of the increase in drug vintage.
The growing role of precision and personalised medicine may not be the only reason why more recently approved drugs tend to have fewer indications than drugs approved many years ago. Regulatory standards may have changed, and increasing research costs may inhibit companies from looking for new indications. Also, the diseases treated by recently-approved drugs differ from the diseases treated by older drugs. For example, Lichtenberg (Citation2018) reported that the number of new cancer drugs launched worldwide during 2005–2014 (76) was 77% larger than the number launched during 1985–1994 (43), while the number of new drugs for other diseases (e.g. cardiovascular and infectious diseases) launched during 2005–2014 (242) was 42% lower than the number launched during 1985–1994 (417).Footnote14
Limitations
Since the U.S. data we analyzed covered outpatient prescriptions only, indications of drugs used only in hospitals were not accounted for.
Conclusions
If newer drugs have fewer indications than older drugs, the market size (number of prescriptions) of newer drugs may be smaller. (Also, the entry of new drugs will affect competition in fewer markets.) A reduction in market size could reduce the expected returns on investment in new drugs. However, if newer drugs are more ‘precise’ than older drugs, and therefore more effective, the reduction in market size could be offset by an increase in drug prices.
More recently approved drugs tend to have fewer indications than drugs approved many years ago. Some analysts have argued that the U.S. Inflation Reduction Act (IRA) of 2022 may accelerate this decline. O’Brien et al. (Citation2023) argue that the IRA’s price-setting timeline has the potential to reduce the probability of investing in research to generate additional evidence or support additional indications. Goldman et al. (Citation2023) argue that absent reform, the IRA may result in a decline in new drug innovation as well as a decline in research on new indications and evidence generation for long-term effectiveness and safety outcomes. They recommend that innovators be granted delays in the start of the price-setting period when new indications are approved to incentivize research on new indications.
Author contributions
All work on the article was performed by the sole author.
Disclosure statement
No potential conflict of interest was reported by the author(s).
Data availability statement
All data and computer programs will be made available upon request.
Notes
1 Some drug products (e.g., different generic manufacturers’ versions of the same drug) have the same chemical substances.
2 A CAS Registry Number (also referred to as CAS RN or informally CAS Number) is a unique identification number, assigned by the Chemical Abstracts Service (CAS) in the US to every chemical substance described in the open scientific literature, in order to index the substance in the CAS Registry. This registry includes all substances described since 1957, plus some substances from as far back as the early 1800s; it is a chemical database that includes organic and inorganic compounds, minerals, isotopes, alloys, mixtures, and nonstructurable materials (UVCBs, substances of unknown or variable composition, complex reaction products, or biological origin).
3 If ln(n_indicationsdt) depended only on the year in which the drug were sold (t), i.e. ln(n_indicationsdt) = β0 + β t + ϵdt = β0 + β (vintaged + age_drugdt) + ϵdt, the coefficients β1 and β2 in eq. (1) would be equal.
4 The DrugCentral 2023 database contains comprehensive information on drug indications for only one year: 2023.
5 Most prescription drug databases do not contain information about the patient’s medical condition.
6 MEPS Prescribed Medicines Files for the years 2016–2021 are also available, but the disease classification used in those years differs from that used in previous years.
7 We estimate that about half of MEPS prescriptions are ‘off-label', i.e., not used to treat approved indications.
8 Data on the effective number of parties, by country, are presented in Wikipedia (Citation2024).
9 Data on the FDA approval years of chemical substances were obtained from the DrugCentral 2023 database (Avram et al., Citation2023).
10 In the Anatomical Therapeutic Chemical (ATC) classification system, active substances are divided into different groups according to the organ or system on which they act and their therapeutic, pharmacological and chemical properties. Drugs are classified in groups at five different levels. The system has fourteen main anatomical or pharmacological groups (1st level). An active substance may be included in more than one anatomical or pharmacological group.
11 In the case of the U.S., this is true for drugs approved after 1989, but not for all drugs approved since 1939 – see models 7 and 8 in .
12 The 2012–2022 change in the mean of ln(n_indications) was −.036 = 1.217 – 1.253.
13 When we confine the analysis to substances first marketed after 1989, it is also the case that the positive effect on the number of indications of the increase in drug age was more than offset by the negative effect of the increase in drug vintage. The net effect of the changes in drug vintage and age on Δmean(ln(n_indications)) was β1 Δmean(vintage) + β2 Δmean(age_drug) = (−.0091 * 5.84) + (.0088 * 4.15) = −.017 = −1.7%.
14 However, as shown in , for cancer (ATC group L) drugs, the vintage coefficient is not statistically significant.
References
- Agency for Healthcare Research and Quality. (2024). Medical Expenditure Panel Survey: Prescribed Medicines Files.
- Avram, S., Wilson, T. B., Curpan, R., Halip, L., Borota, A., Bora, A., Bologa, C. G., Holmes, J., Knockel, J., Yang, J. J., & Oprea, T. I. (2023, January 6). Drugcentral 2023 extends human clinical data and integrates veterinary drugs. Nucleic Acids Research, 51(D1), D1276–D1287. https://doi.org/10.1093/nar/gkac1085
- Centre National Hospitalier d’Information sur le Médicament. (2024). Thériaque database.
- European Medicines Agency. (2024). Indication.
- Goldman, D., Grogan, J., Lakdawalla, D., Liden, B., Shafrin, J., Than, K., & Trish, E. (2023, April 13). Mitigating the Inflation Reduction Act’s adverse impacts on the prescription drug market. USC Schaeffer White Paper.
- Helpman, E. (1998). General purpose technologies and economic growth. MIT Press.
- Krzyszczyk, P., Acevedo, A., Davidoff, E. J., Timmins, L. M., Marrero-Berrios, I., Patel, M., White, C., Lowe, C., Sherba, J. J., Hartmanshenn, C., O'Neill, K. M., Balter, M. L., Fritz, Z. R., Androulakis, I. P., Schloss, R. S., & Yarmush, M. L. (2018). The growing role of precision and personalized medicine for cancer treatment. Technology (Singap World Sci), 6(3–4), 79–100.
- Laakso, M., & Taagepera, R. (1979). “Effective” number of parties: A measure with application to West Europe. Comparative Political Studies, 12(1), 3–27. https://doi.org/10.1177/001041407901200101
- Lichtenberg, F. R. (2018). The impact of new drug launches on life-years lost in 2015 from 19 types of cancer in 36 countries. Journal of Demographic Economics, 84(3), 309–354. https://doi.org/10.1017/dem.2018.11
- National Human Genome Research Institute. (2024). Precision Medicine.
- O’Brien, J. M., Motyka, J., & Patterson, J. (2023, November 3). How the IRA could delay pharmaceutical launches, reduce indications, and chill evidence generation. Health Affairs Forefront.
- Simpson, E. H. (1949). Measurement of diversity. Nature, 163(4148), 688. https://doi.org/10.1038/163688a0
- U.S. Department of Justice, Antitrust Division. (2024). Herfindahl-Hirschman Index.
- Vokinger, K. N., Perényi, G., & Wouters, O. J. (2023). Investments in research and development for supplemental drug indications – Implications for drug price negotiations. JAMA Health Forum, 4(9), e232798. https://doi.org/10.1001/jamahealthforum.2023.2798
- Wikipedia. (2024). Effective number of parties.
Appendices
Appendix Table 1. Indications in France in 2022 of products containing 2 substances.
Appendix Table 2. Calculation of the effective number of diagnoses for raloxifene in 2012 and adalimumab in 2015.