
 ?Mathematical formulae have been encoded as MathML and are displayed in this HTML version using MathJax in order to improve their display. Uncheck the box to turn MathJax off. This feature requires Javascript. Click on a formula to zoom.
Abstract
Dopamine concentration abnormalities in the body can cause various disorders and diseases such as Parkinson's, Tourette's syndrome, and depression. In this study, graphene oxide (GO) was combined with Fe3O4 to sensitively and selectively detect dopamine. The performance was evaluated by cyclic voltammetry (CV) and differential pulse voltammetry (DPV) methods. The results of testing with CV on the solution [Fe(CN)6] showed that a modification with GO gave a maximum effective surface area value of 0.0127 cm2, proving that GO can increase the effective area and conductivity of the sensor. DPV testing shows that dopamine detection using GO/Fe3O4 has a linear range at a concentration of 1–10 μM with a detection limit of 0.48 μM and a quantification limit of 1.6 μM. GO/Fe3O4 also shows good selectivity where the peak current is separated by 0.245 V with ascorbic acid, which is the closest interference compound.
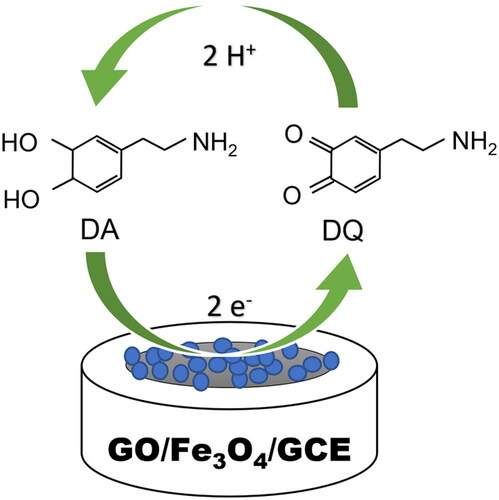
Graphical Abstract
1. Introduction
Dopamine is a neurotransmitter that belongs to the monoamine and catecholamine groups, produced by the adrenal glands and other parts of the brain. Dopamine, as a neurotransmitter, is very important to help nerve cells to send messages to each other. Dopamine functions in excitatory and inhibitory classes to activate postsynaptic neurotransmitter receptors or reverse them [Citation1]. Dopamine's low concentration level is associated with several serious disorders, such as attention deficit hyperactivity disorder (ADHD), Parkinson’s disease, and schizophrenia [Citation2–6], while a high level of concentration leads to cardiotoxicities, such as hypertension, heart failure, and drug addiction [Citation7]. Therefore, dopamine measurement is critical to early diagnose these abnormalities. Dopamine concentration is commonly measured through laboratory analysis techniques, such as conventional chromatography, electrophoresis, enzymatic assay, spectrophotometry, and liquid chromatography/tandem mass spectrometry (LC-MS/MS) methods [Citation8, Citation9]. However, there are drawbacks to these techniques, such as complex preparation, expert personnel, long testing times and expensive cost.
Electrochemical-based sensors are a good candidate for dopamine determination because dopamine has a relatively good electrochemical activity and, importantly, its robustness, high sensitivity, and rapid analysis. Electrochemical measurements are performed using electrodes, and the current or potential responses toward the analytes will be observed. However, the analytical performance and electrode selectivity are still significant problems that need to be addressed in developing the electrochemical sensor. Many researchers overcome this by using electrode surface modification with nanomaterials to increase the detection efficiency due to their large surface-to-volume ratio, improved electrical conductivity, and fast heterogeneous electron transfer rate [Citation10, Citation11]. Carbon-based nanomaterials have become the material of interest for researchers, especially in biosensors [Citation12–21]. Graphene oxide (GO), as one of the variations of graphene, is graphene decorated by a hydroxyl group and epoxy (1,2-ether) on the surface [Citation22]. GO’s high active surface area and reactivity facilitate convenient compositing with other desired specific materials, such as metals, metal oxides, and some complex oxides. Metal oxide nanoparticles have been renowned for having many applications in biomedical since the 1970s [Citation23]. One of the most used materials in this metal oxide is magnetic iron oxide, Fe3O4 [Citation24, Citation25]. It has properties such as non-toxic, biocompatible, and highly accumulated in target tissues or specific organs. Magnetic nanoparticle materials are also usually utilized in biomolecule separation, hypothermia, drug delivery system, and magnetic resonance imaging.
GO-based nanocomposites have been used for dopamine biosensors, such as nanostructured material modified GO and polymer-modified GO for label-free detection [Citation26, Citation27]. Label-free detection helps solve challenges in enzyme-based biosensors, particularly in screening highly active enzymes efficiently and with high sensitivity [Citation8]. The novelty of this study relied on synthesis GO-based nanocomposites with Fe3O4 nanoparticles for dopamine sensor. Among metal oxide nanoparticles, Fe3O4 nanoparticles has display strong superparamagnetism, low toxicity, good biocompatibility and high catalytic activity. In addition, compared to the previous method of syntesis of graphene based nanocomposites with Fe3O4 nanoparticles using hydrothermal [Citation28] and cold quenching in liquid nitrogen [Citation29], GO/Fe3O4 nanocomposites in current work was prepared using chemical coprecipitation technique which is facile, cheap, the most environentally friendly and promising for large scale production with the size and homogenity of the composites can be controlled. The combination of Fe3O4 and GO as nanocomposites as an active material is promising for developing dopamine electrochemical sensors. Electrochemical analyses evaluated the dopamine response with GO/Fe3O4 nanocomposite to obtain its detection limit and selectivity against several interferences. This synergistic effect resulted in a great dopamine determination performance while showing excellent selectivity against glucose, ascorbic acid, and uric acid as interfering compounds. Our relatively simple nanocomposites synthesis and its great sensing performance show a promising label-free biosensor development for dopamine detection.
2. Experimental
2.1. Reagents and materials
Graphite powder (99.9% purity), sulphuric acid (H2SO4 95–97% purity), sodium nitrate (NaNO3, 99.0% purity), potassium permanganate (KMnO4, 99.0% purity), hydrochloric acid (HCl 37 wt%, 99.9% purity), hydrogen peroxide (H2O2 30 wt%, 99% purity), iron(III) chloride hexahydrate (FeCl3.6H2O, 97% purity), iron(II) chloride tetrahydrate (FeCl2.4H2O, 97% purity), dopamine hydrochloride (98% purity), and NafionTM were obtained from Merck. In addition, the phosphate buffer saline (PBS) from Biogear was used as an electrolyte in electrochemical solutions. All aqueous solutions were prepared using deionized (DI) water.
2.2. Materials characterization and instrument
Morphology characterization and composition analysis was performed using scanning electron microscopy-energy dispersive x-ray spectroscopy (SEM-EDX, Hitachi SU3500, Hitachi, Japan). X-ray diffraction (XRD) was performed using x-ray diffractometer (Bruker D8 Advance, Bruker, Germany). The absorbance peak was obtained using UV-Vis spectrophotometer (Labtron LUS B-12, Labtron, United Kingdom). Electrochemical characteristics of sensor material were performed using Ana Pot EIS (ZP, Norway) with a glassy carbon electrode (GCE, 7 mm in diameter, 38.49 mm2 in area) modified by GO/Fe3O4 nanocomposite as a working electrode, along with a platinum wire for the counter electrode and silver/silver chloride (Ag/AgCl) for the reference electrode.
2.3. Preparation of GO/Fe3O4 nanocomposite
2.3.1. Synthesis of graphene oxide (GO)
Graphene oxide was synthesized from graphite powder using the modified hummer method from previous work with different stiring time duration and ratio of pure graphite with the oxidator [Citation30, Citation31]. In this method, 23.33 mL H2SO4 was prepared in temperature conditions under 20 °C using an ice bath. Subsequently, 0.5 gr NaNO3, 0.5 gr graphite powder, and 2.5 gr KMnO4 were added to the solution, and then the solution was stirred for 2 hrs on a hot plate. After that, with a controlled temperature of under 40 °C, the solution was stirred for 16 hrs. The color of the mixture would change into light brown, and it would become a paste. Next, 41.6 mL of deionized (DI) water was added to the mixture and optimized for 30 min, followed by gently adding H2O2 to stop the reaction. The mixture color becomes pale yellow which shows a high oxidation level.
Afterward, 133.33 mL DI water was poured into it. The solution was washed using HCl 1 M (∼20 mL) and treated with centrifugation for excess SO42− ion removal. BaCl was used to define SO42− ion and produced as supernatant. The supernatant was removed, and the residue product was neutralized by pouring DI water until the pH solution became 5. Centrifugation treatment was performed subsequently, followed by drying the residue product at 60 °C for 24 hrs. Finally, the dried product was mashed using mortar to get powders form of graphite oxide.
For obtaining GO powder, peeling treatment to get graphite sheets using ultrasonication was needed. Before that, DI water was added to the graphite oxide powder with a 1 mg/mL concentration. After sonication, the solution was filtered and dried at 60 °C for 24 hrs. The final step was mashing the dried material using mortar to obtain GO powder.
2.3.2. Synthesis of GO/Fe3O4 nanocomposite
The GO modification procedure was described in previous work with some modifications [Citation32]. First step was dissolving 0.2 gr FeCl3.6H2O and 0.4 FeCl2.4H2O in 50 mL deionized water. Then 0.5 gr GO powder was added and sonicated for 30 min. Solution pH was controlled until it became 10 by adding 2 mL ammonium solution (25%) under strong stirring for 5 hrs. Afterward, the supernatant was removed, and the black precipitation was washed before the drying treatment at 80 °C for 24 hrs. Mortar was then used to acquire GO/Fe3O4 powder.
2.4. Working electrode modification
We used the drop-casting method to modify the working electrode surface by dropping a certain amount of solution followed by a drying process at room temperature until a thin deposition of desired material was formed on the surface. Due to the simple process, the final amount drop-casted onto the electrode surface is the only optimization parameter [Citation13, Citation33]. Accordingly, we prepared 1 mg of material (GO or GO/Fe3O4) dissolved in 1 mL of DI water. The solution was sonicated through an ultrasonic bath for 30 min until homogenized. Before drop-casted, the GCE surface was initially cleaned by polishing it on a cleaner sheet with the addition of alumina. Then, a modification was carried out by dropping each 10 µL of material onto the GCE surface and drying it at room temperature for 4 hrs. Next, Nafion solution as a binder which can facilitate and stabilize the present of the nanocomposites on the GCE surface was mixed with DI water in a 1:5 volume ratio before dropping 5 µL of the mixture onto the GCE surface. Finally, modified GCE was left alone for 1 h before use.
2.5. Electroanalysis of dopamine
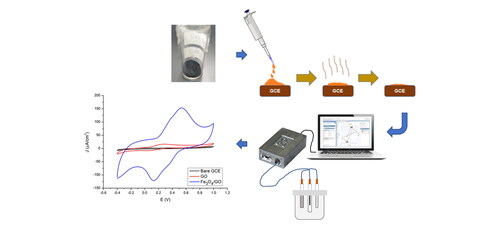
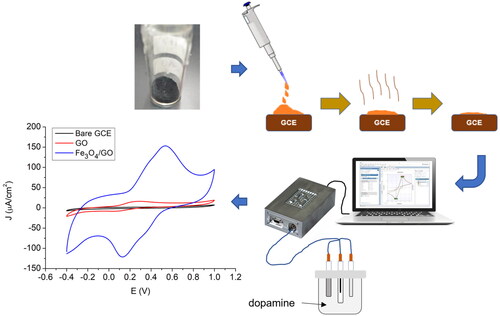
Electrochemical performances were examined using cyclic voltammetry (CV) and differential pulse voltammetry (DPV). CV measurement was performed for 10 cycles. The GCE with modification material is characterized by CV from −0.4 V to 1 V vs. Ag/AgCl in 10 mM [Fe(CN)6]3−/4− (in 10 mM PBS) with a scan rate of 0.05 V/s. We measured the electrochemical performance of GCE with GO/Fe3O4 modification, GO modification, and without modification (bare electrode). Optimization experiments were performed to get the best performance of the modified sensor. Electroanalysis of dopamine in PBS solution was performed using CV with the same measurement parameters. Static characteristics of sensors such as sensitivity, linearity, and limit of detection (LoD) were analyzed by DPV measurement with a potential range of 0.1 V to 0.5 V vs. Ag/AgCl with a scan rate of 0.05 V/s. Finally, we have tested our sensor for selectivity test on glucose, urea, and ascorbic acid as interference analytes. shows the illustration of electrochemical analysis steps.
Figure 1. Measurement steps for dopamine analysis using GO/Fe3O4/GCE.
3. Result and discussion
3.1. Material characterization
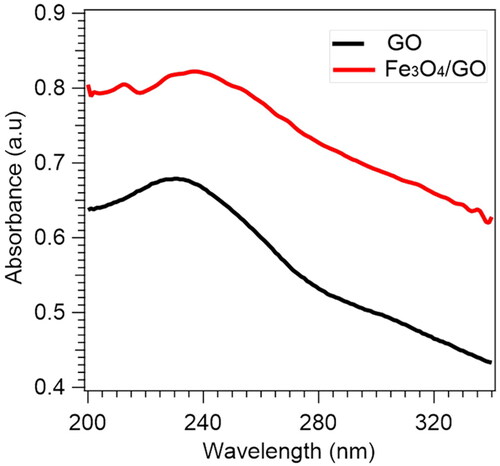
The optical properties of the GO and GO/Fe3O4 using UV-Vis analysis are shown in . It can be seen that GO produces an absorbance peak at a wavelength of 230 nm resulting from the π–π* transition of the C = C aromatic bond, as well as the C = O bond, which is at a range of 270–300 nm. For GO/Fe3O4, the peaks shift to the higher wavelengths at 239 nm due to the existence of Fe3O4 nanoparticles, which give rise to the restoration of electronic conjugation for the carbon bond of graphene sheet [Citation34].
Figure 2. UV-Vis spectra of GO and GO/Fe3O4.
The SEM images of GO and GO/Fe3O4 are depicted in B, with the magnification set at 40,000x. The result shows that the typical morphology of the graphene oxide layers is obtained as a pile of thin layers with wrinkled characteristics (). shows the Fe3O4 distribution on the GO surface. The deposition of Fe3O4 nanoparticles on GO surface is observed due to the interaction of magnetic forces between them. The magnetic forces among Fe3O4 nanoparticles and the surface energy effect led the particles to aggregate. The elemental analysis resulting from EDX analysis ( and ) demonstrates that the content of the compound is a carbon (C, 67.86% atom) and followed by oxygen (O, 32.14% atom) with an approximately 2:1 ratio between C and O atom (). The C and O atom ratio indicates a good composition result since the lower oxygen defects on the graphene surface, the better the chemical and electrochemical properties. In the case of the nanocomposite, consisting of C (62.16% atom), O (32.25% atom), and iron (Fe, 5.59% atom), no other elements are detected. This result indicates that a high purity of synthesized GO/Fe3O4 was successfully obtained.
Figure 3. SEM images of (A) GO and (B) GO/Fe3O4 composites with 40,000x magnification, and TEM images of (C) GO and (D) GO/Fe3O4.
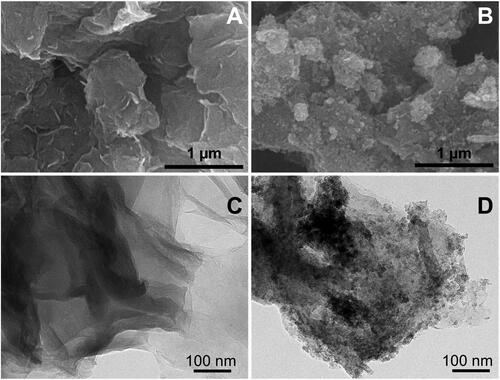
Figure 4. EDX Spectrum of GO/Fe3O4 nanocomposites.
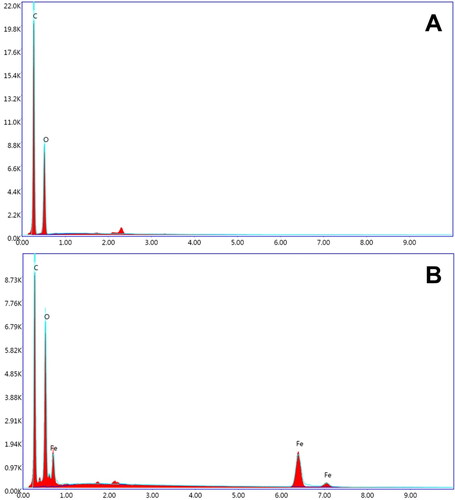
Table 1. Chemical composition GO/Fe3O4 nanocomposites.
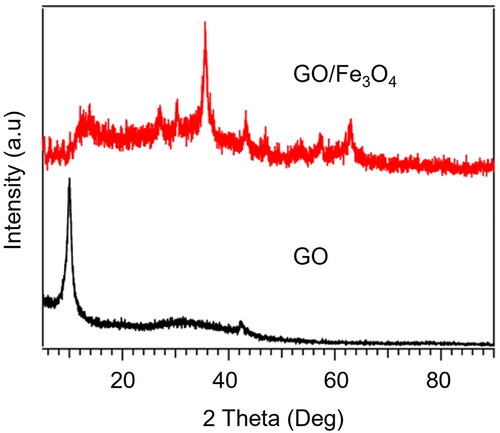
The crystal structure of the GO and GO/Fe3O4 characterized by XRD is depicted in . The obtained GO shows two distinct diffraction peaks at 2θ around 10.0° and 42.3° due to the reflection of (001) and (100) plane [Citation35], with the peak of graphite at 26° does not appear to reveal the formation of GO with oxygen-containing functional groups [Citation36]. After decorating with Fe3O4, the peak of GO is still present with a slight shift and patterns of Fe3O4 appearing at 2θ of 30.3, 35.5, 43.3, 53.4, 57.4 and 63.0, corresponding to crystal planes of (220), (311), (400), (422), (511) and (440) which represent the face-centered cubic lattice (fcc) crystal structure of Fe3O4 and have a good agreement with JCPDS card no. 19-0629.
Figure 5. XRD spectrum of GO and GO/Fe3O4 nanocomposites.
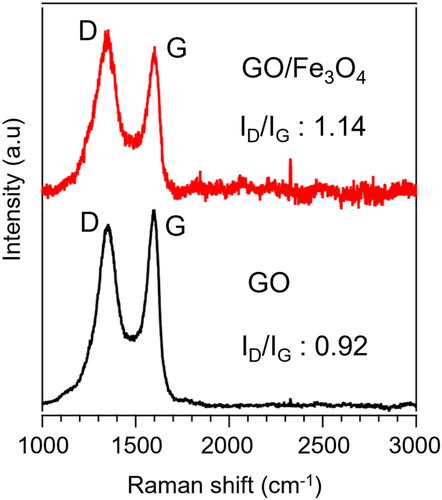
Raman spectroscopy is a potential technique to characterize the significant structural changes in carbonaceous materials. The Raman spectra of GO and GO/Fe3O4 nanocomposites are given in . The two prominent peaks of GO appear at 1351 cm−1 and 1598 cm−1, corresponding to the D and G bands, respectively, with the intensity ratio of ID/IG is 0.92. The Raman spectra of GO/Fe3O4 show the peaks of D and G bands at 1348 cm−1 and 1598 cm−1, respectively, with the intensity ratio of ID/IG is 1.14, which is higher than that of GO. The increase in the peak intensity is evident in the successful functionalization of Fe3O4 particles on GO sheet [Citation29].
Figure 6. Raman spectrum of GO and GO/Fe3O4 nanocomposites.
3.2. Go/Fe3O4 nanocomposites modified electrode electrochemical characterization
The electrochemical characteristics of the electrodes were investigated to determine the phenomenon of electron transfer that occurs using a solution of [Fe(CN)6]3−/4− as shown in . Different electrode surfaces will produce different anodic and cathodic responses. Cyclic voltammetry experiments were carried out at a working voltage range of −0.4 V to 1 V with a scan rate of 50 mV/s in 10 mM [Fe(CN)6]3−/4− in 10 mM PBS (pH 7.4). Reduction and oxidation reactions occur due to the free electron transfer by electrolyte when potential is gradually changed. The working potential will be scanned from −0.4 V as a start point to the positive direction causing an anodic reaction on the electrode and resulting oxidation peak current. Then, the potential will be turned back towards −0.4 V, resulting in a reduction in peak current due to cathodic reaction. The redox reaction equation is shown in EquationEq. 1–2(Eq. 1)
(Eq. 1) .
(Eq. 1)
(Eq. 1)
(Eq. 2)
(Eq. 2)
Figure 7. Electrochemical performance using CV of 10 mM [Fe(CN)6]3−/4− in 10 mM PBS (pH 7.4).
![Figure 7. Electrochemical performance using CV of 10 mM [Fe(CN)6]3−/4− in 10 mM PBS (pH 7.4).](/cms/asset/864b0ef3-2d4f-4798-8cbe-ffea6dfd5470/ynan_a_2090050_f0007_c.jpg)
Eq. 1 shows the oxidation reaction on the electrode surface. When working potential reaches a sufficient value to oxidize [Fe(CN)6]4−, the anodic current density will significantly increase. The current escalation occurs until the current peak has saturated caused by the [Fe(CN)6]4− concentration drop on the electrode surface, while the back potential sweeping towards −0.4 V will initiate a cathodic reaction due to the reduction of [Fe(CN)6]4− to [Fe(CN)6]3− as written in Eq. 2, which involves a free electron.
shows the redox responses for [Fe(CN)6]3−/4− using bare GCE and modified GCE. The modified GCE resulted in detected current enhancement compared to the bare GCE current. Furthermore, electrode modification using GO generates the oxidation peak (Ipa) and reduction (Ipc) currents greater than the modification using GO/Fe3O4, while the magnitude of the current value produced by the GO/Fe3O4 modification electrode significantly increases compared to two other types of working electrodes. The high Ipa and Ipc on GO electrode are induced by the increased surface area by the morphological characteristics of the GO surface. The electrochemical surface area (ECSA) of the electrode for the reversible process can be calculated using the Randle-Servchik equation as written in Eq. 3.
(Eq. 3)
(Eq. 3)
Eq. 3 shows the correlation of surface area (A) with peak current measure (Ip) with n, D, C, and v corresponding to the number of electrons involved in the reaction, the diffusion coefficient for [Fe(CN)6]3−, solution concentration (mol/cm3), and the scan rate (V/s), respectively. With the calculation, the bare electrode, GO-modified, and GO/Fe3O4-modified electrode have a surface area of 0.0114 cm2, 0.0127 cm2, and 0.0124 cm2. Electrode with GO modification produced a higher surface area than the GO/Fe3O4 modification since the Fe3O4 tends to aggregate on the GO surface, forming large cluster. However, the positively effect of GO which has high surface area and a strong reaction between GO with Fe3O4 nanoparticles enhance the active site of redox reaction [Citation37].
3.3. Electrochemical performance of dopamine detection
3.3.1. Electrochemical measurement towards dopamine
Bare electrode, GO-modified electrode, and GO/Fe3O4-modified electrode were implemented to detect 10 μM of dopamine as the analyte by using 10 mM of PBS with the pH of 7.4 as the electrolyte. The comparison of electrochemical responses on each electrode toward dopamine detection is shown in . Measurement using a bare electrode did not generate any redox peak. The GO modified electrode produces a dopamine oxidation peak current density of 16.152 μA/cm2 on a working potential of 0.29216 V. This indicates that improving the working electrode surface area by GO introduces more electron transfer. In contrast, the peak improvement is relatively low compared with the electrochemical response of the GO/Fe3O4-modified electrode. The GO/Fe3O4-modified electrode produces almost 10 times the oxidation peak current density, which is 153.09 μA/cm2, with the shift of the working electrode to the positive direction. It shows that adding nanohybrid magnetic graphene (GO/Fe3O4 nanocomposite) could create a more conductive electron transfer path.
Figure 8. (a) CV responses of different electrodes in 10 μM dopamine, (b) Scan rate variation measurements of GO/Fe3O4 electrode on 10 μM dopamine, (c) DPV measurements of dopamine concentration variation of 0–20 μM, and (d) Calibration curve of DPV measurements of dopamine from 0–10 μM (n = 3).
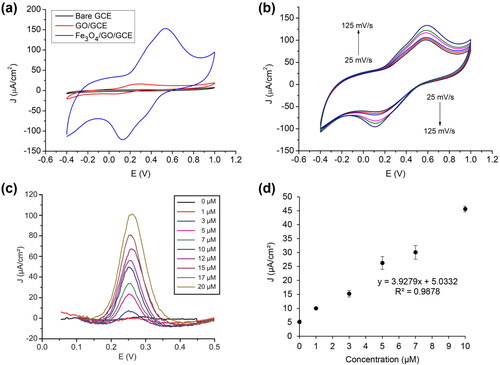
The GO/Fe3O4/GCE has higher electrocatalytic activity towards the reduction and oxidation of dopamine due to the synergetic effect between Fe3O4 nanoparticles and GO as the supporting material, which could act as an effective electron promotor and improve the dopamine catalytic activity. On the other hand, the shifting of the working potential is induced by the Fe3O4 nanoparticles that tend to increase the internal resistance of the electrode surface. Therefore, the difference between oxidation and reduction working potential (ΔEp) is increased because of the greater potential needed to oxidize or reduce the analyte. Moreover, the redox reaction on GO/Fe3O4/GCE is more reversible than using GO/GCE, with the anodic and cathodic peak ratio being 1.26 (1 ≈ reversible) and 1.93, respectively. It confirms the quasi-reversibility of the dopamine redox reaction.
The reactions on the GO/Fe3O4/GCE interface of the dopamine detection are illustrated in . At first, the Fe3O4 nanoparticles are reduced directly on the electrode surface (Eq. 4), producing Fe2+ ions. With increased working potential, oxidation occurs (Eq. 5) and induces the electron transfer used to deprotonate the Dopamine (DA) into the Dopamine-o-Quinone (DQ), as shown in Eq. 6. While the reverse-sweep potential takes place, Fe3+ ions are reduced (Eq. 7) and followed by the reattachment of the hydrogen ions by DQ, resulting in DA molecules back (Eq. 8).
(Eq. 4)
(Eq. 4)
(Eq. 5)
(Eq. 5)
(Eq. 6)
(Eq. 6)
(Eq. 7)
(Eq. 7)
(Eq. 8)
(Eq. 8)
Figure 9. Illustration of electrode interface reactions.
3.3.2. Scan rate variation
Electrochemical measurements towards scanning rate variation were conducted to determine the electrochemical reaction characteristic of the dopamine detection. It can be concluded by observing the relation of peak current density toward the square root of scan rate. As shown in , the measurement was performed by the scanning rate of 25, 35, 50, 75, 100, and 150 mV/s in 10 µM dopamine and 0.1 µM pH 7.4 PBS. CV measurement shows that both the peak current of reduction and oxidation is proportional linearly to the square root of scan rate by equation of Ipaox = 42.366 + 4.2752v (n = 6, R = 0.9698) and Ipared = −28.85 − 5.4626v (n = 6, R = 0.9845). It indicates that the oxidation reaction towards dopamine on the electrode surface is a diffusion-controlled process.
3.3.3. Sensitivity, selectivity, and stability evaluation of GO/Fe3O4/GCE for dopamine detection
The GO/Fe3O4-modified electrode was tested towards dopamine using Differential Pulse Voltammetry (DPV) by the potential range of 0.05–0.5 V and a scan rate of 50 mV/s. As shown in , by varying the dopamine concentration from 0–20 µM, the sensors have increasing responses toward higher dopamine concentration. The linear range conforms with the detection requirement considering that dopamine concentration inside the human body is in the range of 0.3–3 µM in urine, which is within our measurement, although a higher sensitivity is needed for a range of 0–0.25 nM in blood [Citation38]. Subsequently, the gradient of the linear equation represents the sensitivity value of the sensor. Limit of detection (LoD) is a sensor performance parameter that provides the information on the smallest measurable concentration of dopamine compared with the background noise. LoD calculation is shown in Eq. 9, with S and b representing a standard deviation from background noise and gradient of the linear curve, respectively. S was obtained by 3 times DPV measurement of background signal, the electrolyte used (PBS 10 mM) without dopamine. The multiplier factor of 3 in the equation is the standard signal-to-noise ratio. The limit of quantification (LoQ) calculation was written in Eq. 10, similar to the LoD calculation, except multiplier factor of 10.
(Eq. 9)
(Eq. 9)
(Eq. 10)
(Eq. 10)
Calibration curve in exhibit the linear regression equation for dopamine detection in a concentration range of 0–10 µM. In this work, DPV measurement was repeated 3 times for each concentration (1–10 μM). With the error of the background (S) of 0.636 µA/cm2, we obtained the LOD value of 0.48 μM and the LoQ value of 1.62 μM using our GO/Fe3O4 nanocomposite dopamine sensor.
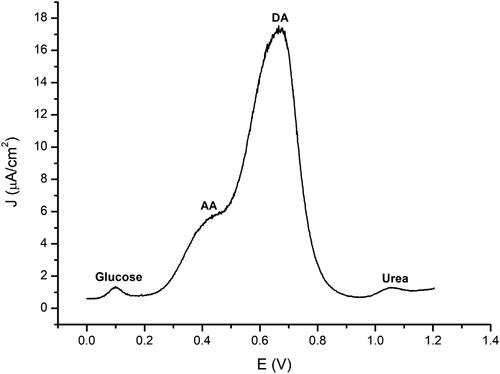
Selectivity can provide information about how the interference of other ingredients affects the measurement of the target analyte. This test was conducted using the DPV method in the 0–1.2 V operating voltage range in PBS 10 mM pH 7.4. Three interference compounds were used: 4.5 mM glucose, 5 mM urea, and 2.5 mM ascorbic acid. These concentrations are selected according to the content of each compound in the blood serum.
From , it appears that there are four anodic reaction peaks. Glucose gave an increasing response at a working voltage of 0.099 V, ascorbic acid at 0.245 V, and urea at 0.389 V. It was seen that ascorbic acid had a peak in the range of increasing dopamine. Ascorbic acid itself is a natural interference compound of dopamine both in the biological nervous environment and uric acid. Ascorbic acid has an important role as an antioxidant in the body. The closeness of the oxidation peaks is caused by the fact that the two specimens tend to have the same oxidation potential [Citation39] (Liu Y et al., 2008). However, the difference in oxidation potential between DA and AA is distinct, so it can be stated that GO/Fe3O4 has good selectivity for dopamine.
Figure 10. Selectivity test on 4.5 mM glucose, 5 mM urea, 5 mM ascorbic acid, and 10 μM dopamine solutions.
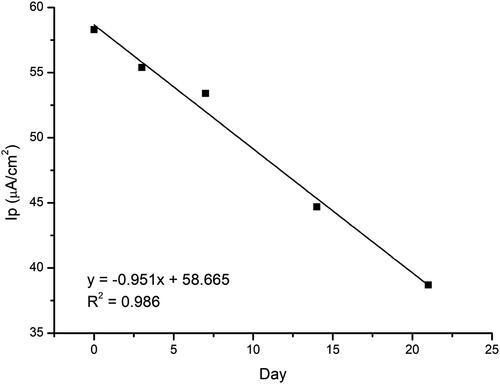
Finally, sensor stability testing is done by doing repeated DPV for a certain period of time (). The GO/Fe3O4-modified working electrode was stored at room temperature without special treatment. Then the test is carried out on the third day, the first week, the second week and lastly, the third week. The measurement on day 0 will be the standard for comparing how much change occurs in the response over time. The results showed that the peak value of the oxidation current decreased with increasing storage time. The sensor response still gave a response of 66% on the third week with no special treatment.
Figure 11. Peak current (Ip) change on day-to-day measurements (stability test).
The comparison of our sensor performance with other published research on dopamine detection based on graphene, graphene oxide, reduced graphene oxide, and carbon nanotubes is shown in .
Table 2. Comparison with other publications on dopamine detection.
Our work shows better performance in terms of LOD than several previous works [Citation40–43]. In terms of a nanocomposite synthesis method, our work uses a typical modified hummer method for obtaining GO, followed by straightforward synthesis to combine with Fe3O4 and ended with simple measurement protocol. The development cost is also relatively cheaper than the previous works in if we evaluate the precursor and electrode materials. Furthermore, magnetic-based iron oxide nanomaterial is very promising for many applications, such as in vivo options for drug delivery, magnetic resonance imaging (MRI), and thermoablation. As for in vitro options, magnetic iron oxide is used extensively for bioseparation, targeted receptors, and diverse techniques of biosensors development [Citation44, Citation45]. Thus, it opened up future biomedical applications in combining the functionality of biosensing with another purpose when magnetic iron oxide is selected. However, reducing the background value must be considered further whenever evaluation of another body fluid, such as blood, is necessary, as it is in the range of 0–0.25 nM [Citation38]. A possible approach to be considered is to change electrodes into a micro-scale electrode array in combination with promising nanocomposite to help improve the detection limit of biosensors toward dopamine and, at the same time, provide portability and simplicity for on-site analysis [Citation46, Citation47].
4. Conclusion
Performance comparison between dopamine detection on GCE with modification and without modification showed that GO/Fe3O4 has a great ability to detect dopamine with high peak current in both anodic and cathodic reactions. DPV measurement shows that the GO/Fe3O4 sensor has a linear range of 1–10 µM concentrations which results in LoD value at 0.48 μM and the LoQ value of 1.6 μM dopamine, respectively. GO/Fe3O4 shows great selectivity when tested using ascorbic acid, glucose, and uric acid as interfering agents. Under storing durations, current peaks dropped into 66% performance after 3 weeks.
Acknowledgement
The authors acknowledge financial grants provided by Bandung Institute of Technology under the grant scheme of Penelitian, Pengabdian Masyarakat, dan Inovasi (PPMI), and partially from the Indonesia Ministry of Education and Culture, and the Indonesia Ministry of Research and Technology under the grant scheme of Penelitian Dasar Unggulan Perguruan Tinggi (PDUPT).
Disclosure statement
No potential conflict of interest was reported by the authors.
Additional information
Funding
Notes on contributors
Isa Anshori
Isa Anshori received the B.Eng. degree from the Engineering Physics Department, Bandung Institute of Technology, Indonesia, in 2009, and the M.Eng. degree in materials science and the Ph.D. degree in nanoscience and nanotechnology from the University of Tsukuba, Japan, in 2015 and 2018, respectively. He has been employed as an Assistant Professor with the Biomedical Engineering Department, Bandung Institute of Technology since 2018. His current research interests include bio/chemical sensors, microfluidics, the IoT devices, and lab-on-chip.
Komang Arya Attyla Kepakisan
Komang Arya Attyla Kepakisan received the B.Sc. degree from the Biomedical Engineering Department, Bandung Institute of Technology, Indonesia, in 2020. His research interest is electrochemical biosensors and informatics technology.
Lavita Nuraviana Rizalputri
Lavita Nuraviana received the B.Sc. degree from the Biomedical Engineering Department, Bandung Institute of Technology, Indonesia, in 2019, and currently a Master student in Nanotechnology Department, Bandung Institute of Technology, Indonesia. Her current research interests include biosensors, nanomaterials, and lab-on-chip development for healthcare.
Raih Rona Althof
Raih Rona Althof received the B.Sc. degree from the Biomedical Engineering Department, Bandung Institute of Technology, Indonesia, in 2019. Currently, she undergoes Master Program of Nanotechnology at Bandung Institute of Technology, Indonesia. Her research interest is biosensors and nanomaterial development for healthcare.
Antonius Eko Nugroho
Antonius Eko Nugroho received the B.Sc. degree from the Biomedical Engineering Department, Bandung Institute of Technology, Indonesia, in 2021. His research interest is electrochemical biosensors and informatics technology.
Rikson Siburian
Rikson Siburian received the B.S.,and M.S. degrees in Chemistry from University of Sumatera Utara, in 1998 and 2001. He received Ph.D degree in Pure and Applied Science of University of Tsukuba (2013). Recently, he is an Associate Professor in Chemistry Department of University of Sumatera Utara and affiliated with Carbon Research Center, University of Sumatera Utara.
Murni Handayani
Murni Handayani received the B.Sc. degree from the Chemistry Department, Sebelas Maret University, Indonesia, in 2003, and the M.Sc. degree and the Ph.D. degree in chemistry department from the Osaka University, Japan, in 2013 and 2016, respectively. After her doctoral graduation until 2017, she was a specially assigned assistant professor in chemistry department, Osaka University, Japan. She was a visiting scientist in Nanyang Technological University (NTU), Singapore in 2019. She is currently a researcher in Research Center for Metallurgy and Materials, Indonesian Institute of Sciences (LIPI). Her current research interests include molecular electronics, nanoscience, and nanomaterials, especially nanocarbons.
References
- Liu X, Liu J. Biosensors and sensors for dopamine detection. View. 2021;2(1):20200102.
- Zahid M, Saeed M, Yang L, et al. Formation of dopamine quinone‐DNA adducts and their potential role in the etiology of parkinson’s disease. IUBMB Life. 2011;63(12):1087–1093.
- Tye KM, Mirzabekov JJ, Warden MR, et al. Dopamine neurons modulate neural encoding and expression of depression-related behaviour. Nature. 2013;493(7433):537–541.
- Segura‐Aguilar J, Paris I, Muñoz P, et al. Protective and toxic roles of dopamine in parkinson’s disease. J Neurochem. 2014;129(6):898–915.
- Dougherty DD, Bonab AA, Spencer TJ, et al. Dopamine transporter density in patients with attention deficit hyperactivity disorder. Lancet. 1999;354(9196):2132–2133.
- Tripp G, Wickens JR. Research review: dopamine transfer deficit: a neurobiological theory of altered reinforcement mechanisms in ADHD. J Child Psychol Psychiatry. 2008;49(7):691–704.
- Kirchon A, Feng L, Drake HF, et al. From fundamentals to applications: a toolbox for robust and multifunctional MOF materials. Chem Soc Rev. 2018;47(23):8611–8638.
- Liu R, Feng Z-Y, Li D, et al. Recent trends in carbon-based microelectrodes as electrochemical sensors for neurotransmitter detection: a review. TrAC Trends Anal Chem. 2022;148:116541.
- Rasheed PA, Lee J-S. Recent advances in optical detection of dopamine using nanomaterials. Microchim Acta. 2017;184(5):1239–1266.
- Maduraiveeran G, Jin W. Functional nanomaterial-derived electrochemical sensor and biosensor platforms for biomedical applications. In: Chaudhery Mustansar Hussain, editor. Handbook of nanomaterials in analytical chemistry. Netherlands: Elsevier; 2020. p. 297–327.
- Kant T, Shrivas K, Dewangan K, et al. Design and development of conductive nanomaterials for electrochemical sensors: a modern approach. Mater Today Chem. 2022;24:100769.
- Lee J, Kim J, Kim S, et al. Biosensors based on graphene oxide and its biomedical application. Adv Drug Deliv Rev. 2016;105(Pt B):275–287.
- Anshori I, Nuraviana Rizalputri L, Althof RR, et al. Functionalized multi-walled carbon nanotube/silver nanoparticle (f-MWCNT/AgNP) nanocomposites as non-enzymatic electrochemical biosensors for dopamine detection. Nanocomposites. 2021;7(1):97–108.
- Sadak O. One-pot scalable synthesis of rGO/AuNPs nanocomposite and its application in enzymatic glucose biosensor. Nanocomposites. 2021;7(1):44–52.
- Sireesha M, Jagadeesh Babu V, Kranthi Kiran AS, et al. A review on carbon nanotubes in biosensor devices and their applications in medicine. Nanocomposites. 2018;4(2):36–57.
- Hareesha N, Manjunatha JG. Elevated and rapid voltammetric sensing of riboflavin at poly (helianthin dye) blended carbon paste electrode with heterogeneous rate constant elucidation. J Iran Chem Soc. 2020;17(6):1507–1519.
- Hareesha N, Manjunatha JG. Fast and enhanced electrochemical sensing of dopamine at cost-effective poly (DL-phenylalanine) based graphite electrode. J Electroanal Chem. 2020;878:114533.
- Manjunatha JG, Swamy BEK, Deraman M, et al. Simultaneous determination of ascorbic acid, dopamine and uric acid at poly (aniline blue) modified carbon paste electrode: a cyclic voltammetric study. Int J Pharm Pharm Sci. 2013;5:355–362.
- Tigari G, Manjunatha JG. Electrochemical preparation of poly (arginine)-modified carbon nanotube paste electrode and its application for the determination of pyridoxine in the presence of riboflavin: an electroanalytical approach. J Anal Test. 2019;3(4):331–340.
- Manjunatha JG. A surfactant enhanced graphene paste electrode as an effective electrochemical sensor for the sensitive and simultaneous determination of catechol and resorcinol. Chem Data Collect. 2020;25:100331.
- Raril C, Manjunatha JG. Sensitive electrochemical analysis of resorcinol using polymer modified carbon paste electrode: a cyclic voltammetric study. Anal Bioanal Electrochem. 2018;10:488–498.
- Liao K-H, Mittal A, Bose S, et al. Aqueous only route toward graphene from graphite oxide. ACS Nano. 2011;5(2):1253–1258.
- Andrade Â, Ferreira R, Fabris J, et al. Coating nanomagnetic particles for biomedical applications. In: Reza Fazel-Rezai, editor. Biomedical engineering-frontiers and challenges. Croatia: InTech; 2011. p. 157–176.
- George JM, Antony A, Mathew B. Metal oxide nanoparticles in electrochemical sensing and biosensing: a review. Microchim Acta. 2018;185:1–26.
- Fatimah I, Fadillah G, Yudha SP. Synthesis of iron-based magnetic nanocomposites: a review. Arab J Chem. 2021;14(8):103301.
- Khan MZH. Graphene oxide modified electrodes for dopamine sensing. J Nanomater. 2017;2017:1–11.
- Kamal Eddin FB, Wing Fen Y. Recent advances in electrochemical and optical sensing of dopamine. Sensors. 2020;20(4):1039.
- Zhang W, Zheng J, Shi J, et al. Nafion covered core–shell structured Fe3O4@ graphene nanospheres modified electrode for highly selective detection of dopamine. Anal Chim Acta. 2015;853:285–290.
- Zhong L, Xu H, Yu Z, et al. Bowl-shaped graphene oxide/Fe3O4 composites on Au-PCB electrode for electrochemical detection of dopamine. Ionics (Kiel). 2020;26(8):4171–4181.
- Handayani M, Suwaji BI, Ihsantia Ning Asih G, et al. In-situ synthesis of reduced graphene oxide/silver nanoparticles (rGO/AgNPs) nanocomposites for high loading capacity of acetylsalicylic acid. Nanocomposites. 2022;8:74–80.
- Febriana E, Handayani M, Susilo DNA, et al. A simple approach of synthesis of graphene oxide from pure graphite: Time stirring duration variation. In: AIP Conference Proceedings. Vol. 2382; 2021. p. 40006.
- Kamakshi T, Sundari G, Erothu H, et al. Synthesis and characterization ofgraphene based iron oxide (Fe3O4) nanocomposites. RJC. 2018;11(3):1113–1119.
- Suhanto RN, Harimurti S, Septiani NLW, et al. Sonochemical synthesis of magnetic Fe3O4/graphene nanocomposites for label-free electrochemical biosensors. J Mater Sci Mater Electron. 2020;31:15381–15393.
- Handayani M, Kepakisan KAA, Anshori I, et al. Graphene oxide based nanocomposite modified screen printed carbon electrode for qualitative cefixime detection. In: AIP Conference Proceedings. Vol. 2382; 2021. p. 40005.
- Handayani M, Mulyaningsih Y, Anggoro MA, et al. One-pot synthesis of reduced graphene oxide/chitosan/zinc oxide ternary nanocomposites for supercapacitor electrodes with enhanced electrochemical properties. Mater Lett. 2022;314:131846.
- Handayani M, Sulistiyono E, Rokhmanto F, et al. Fabrication of graphene oxide/calcium carbonate/chitosan nanocomposite film with enhanced mechanical properties. IOP Conf Ser: Mater Sci Eng. 2019;578(1):012073.
- Zubir NA, Yacou C, Motuzas J, et al. Structural and functional investigation of graphene oxide–Fe3O4 nanocomposites for the heterogeneous fenton-like reaction. Sci Rep. 2014;4:1–8.
- Steckl AJ, Ray P. Stress biomarkers in biological fluids and their point-of-use detection. ACS Sens. 2018;3(10):2025–2044.
- Liu Y, Huang J, Hou H, et al. Simultaneous determination of dopamine, ascorbic acid and uric acid with electrospun carbon nanofibers modified electrode. Electrochem Commun. 2008;10(10):1431–1434.
- Ma X, Chao M, Wang Z. Electrochemical detection of dopamine in the presence of epinephrine, uric acid and ascorbic acid using a graphene-modified electrode. Anal Methods. 2012;4(6):1687–1692.
- Fan Y, Lu H-T, Liu J-H, et al. Hydrothermal preparation and electrochemical sensing properties of TiO2–graphene nanocomposite. Colloids Surf B Biointerfaces. 2011;83(1):78–82.
- Wang C, Du J, Wang H, et al. A facile electrochemical sensor based on reduced graphene oxide and Au nanoplates modified glassy carbon electrode for simultaneous detection of ascorbic acid, dopamine and uric acid. Sensors Actuators B Chem. 2014;204:302–309.
- Alothman Z, Bukhari N, Wabaidur S, et al. Simultaneous electrochemical determination of dopamine and acetaminophen using multiwall carbon nanotubes modified glassy carbon electrode. Sensors Actuators B Chem. 2010;146(1):314–320.
- Wu W, Wu Z, Yu T, et al. Recent progress on magnetic iron oxide nanoparticles: synthesis, surface functional strategies and biomedical applications. Sci Technol Adv Mater. 2015;16:023501.
- Vangijzegem T, Stanicki D, Laurent S. Magnetic iron oxide nanoparticles for drug delivery: Applications and characteristics. Expert Opin Drug Deliv. 2019;16(1):69–78.
- He C, Tao M, Zhang C, et al. Microelectrode-based electrochemical sensing technology for in vivo detection of dopamine: recent developments and future prospects. Crit Rev Anal Chem. 2022;52(3):544–554.
- Damiati S, Haslam C, Søpstad S, et al. Sensitivity comparison of macro-and micro-electrochemical biosensors for human chorionic gonadotropin (hCG) biomarker detection. IEEE Access. 2019;7:94048–94058.
- Zhang H, Huang Q, Huang Y, et al. Graphitic carbon nitride nanosheets doped graphene oxide for electrochemical simultaneous determination of ascorbic acid, dopamine and uric acid. Electrochim Acta. 2014;142:125–131.
- Palanisamy S, Ku S, Chen SM. Dopamine sensor based on a glassy carbon electrode modified with a reduced graphene oxide and palladium nanoparticles composite. Microchim Acta. 2013;180(11–12):1037–1042.
- Balu S, Palanisamy S, Velusamy V, et al. Tin disulfide nanorod-graphene-β-cyclodextrin nanocomposites for sensing dopamine in rat brains and human blood serum. Mater Sci Eng C Mater Biol Appl. 2020;108:110367.
- Palanisamy S, Velmurugan S, Yang TCK. One-pot sonochemical synthesis of CuS nanoplates decorated partially reduced graphene oxide for biosensing of dopamine neurotransmitter. Ultrason Sonochem. 2020;64:105043.
- Palanisamy S, Velusamy V, Ramaraj S, et al. Facile synthesis of cellulose microfibers supported palladium nanospindles on graphene oxide for selective detection of dopamine in pharmaceutical and biological samples. Mater Sci Eng C Mater Biol Appl. 2019;98:256–265.