
 ?Mathematical formulae have been encoded as MathML and are displayed in this HTML version using MathJax in order to improve their display. Uncheck the box to turn MathJax off. This feature requires Javascript. Click on a formula to zoom.
Abstract
Multi-walled carbon Nanotube (MWCNT) fillers are extensively used to improve the thermomechanical properties of polymers. In this study, five different weight fractions (0%, 0.25%, 0.50%, 0.75%, and 1%) of MWCNT-polymer nanocomposites were prepared by the solution mixing technique. The thermal conductivity of MWCNT-polymer nanocomposites was investigated using the laser flash method. The closed-form solution of the modified Mori-Tanaka homogenization method was developed for the accurate estimation of the thermal conductivity of nanocomposite materials after considering the influence of interfacial thermal resistance (ITR). The finite element simulation of RVE modelling was utilized to predict the thermal conductivity of nanocomposites with and without consideration of the interfacial thermal resistance effect. A perfect bond was assumed between MWCNT and polymer for both numerical and analytical studies. The thermal conductivity results obtained from the closed-form solution of the modified Mori-Tanaka method were in good agreement with both the finite element simulation (FEM) and experimental results.
Graphical Abstract
1. Introduction
Thermal management is crucial for dissipating the heat generated from power electronics, especially with the trend toward the miniaturization of electronic devices. Polymers have a wide range of applications in the electronics industry, such as electronic packaging, flexible devices, underfill material, and organic substrates [Citation1–8]. It is challenging to effectively dissipate heat through unmodified polymer because of its poor thermal conductivity (0.2–0.5 ) [Citation9]. Conductive polymer composites are gaining significant attention in electronic industry due to their improved thermo-mechanical properties. MWCNTs have gathered considerable interest among nanofillers due to their excellent thermo-mechanical properties because of attractive thermal conductivity 2000–6000
elastic modulus 1 GPa) [Citation10]. The high aspect ratio of MWCNTs maximizes the thermal conduction between the matrix and filler [Citation11], thereby enhances the overall thermal conductivity of the nanocomposite. The preparation of CNT-based nanocomposites is a challenging task due to the strong Van der Waals forces that are intrinsic to CNTs. These forces cause the CNTs to aggregate into bundles, resulting in uneven dispersion within the matrix [Citation10, Citation12]. The agglomeration of MWCNTs can significantly affects the mechanical, thermal and electrical properties of the polymer nanocomposite [Citation13,Citation14]. The melt-blending process, in situ polymerization, and solution mixing are among the most popular techniques for preparing polymer composites [Citation15].
Thermal conductivity is an essential property for controlling heat dissipation from materials [Citation16]. The thermal conductivity of nanocomposite is affected by numerous factors, including filler volume fractions, shape, aspect ratio, and dispersion, in addition to thermal conductivity of matrix and filler [Citation17]. There is also interfacial thermal resistance known as Kapitza resistance, which causes the experimentally measured thermal conductivity of nanocomposite to be much smaller than the theoretical value. ITR between the matrix and filler causes phonon scattering at the interface, which diminishes the heat transfer capacity and leads to a decrease in the effective thermal conductivity of the nanocomposite [Citation10, Citation18]. Another reason for the deterioration of the heat transfer capacity of composites is the contact resistance between CNT fillers, but that has a negligible effect at lower concentrations [Citation19]. Hassanzadeh et al. [Citation20] found that the wavy shaped and randomly oriented CNTs with ITR effect provided a more realistic prediction for the analysis of the effective thermal conductivity of the nanocomposite. Numerous theoretical studies have predicted ITR between the polymer matrix and CNTs [Citation9, Citation16, Citation18, Citation21–25].
Despite numerous factors affecting the thermal conductivity of MWCNT-polymer nanocomposites, experimental investigations to understand the underlying mechanism can be complex and challenging. As an alternative, analytical and numerical methods have proven cost-effective and faster than experimental studies. These methods provide valuable insights into the factors affecting the thermal conductivity of nanocomposites and offer a useful tool for optimizing their properties. Micromechanics is extensively used to predict the thermal properties of polymer nanocomposites at different scales. The effect of filler content, aspect ratio, orientation, and interfacial thermal resistance on the thermal conductivity of polymer nanocomposites has been studied extensively using analytical models such as the Mori-Tanaka technique (MT) and the Maxwell-Garnett effective medium approximation approach (MG-EMA). The basic Mori-Tanka technique does not consider the ITR effect, although it is the most popular method for predicting the effective thermal conductivity of polymer nanocomposites. However, the modified Mori-Tanaka method does include the effect of ITR [Citation26].
This study used a solution-mixing technique to create an MWCNT-polymer nanocomposite. We investigated the dispersion of MWCNTs in the matrix and the influence of various weight fractions of MWCNTs on the thermal conductivity of the composites. The main aim of this study is to use a modified Mori-Tanka classical continuum mechanics model to predict the effective thermal conductivity of MWCNT-polymer nanocomposites. The effects of weight fraction, filler orientation, aspect ratio, and interfacial thermal resistance (ITR) on the thermal conductivity of polymer nanocomposites were investigated. A closed-form solution of the modified Mori-Tanaka analytical model was developed to provide a precise and efficient calculation of the effective thermal conductivity of nanocomposites that include aligned or randomly oriented cylindrical inclusions, as well as spherical inclusions. To the best of our knowledge, a closed-form solution of the Mori-Tanaka method that considers the effect of interfacial resistance applied to randomly oriented cylindrical inclusions has not been reported in the literature. A closed-form solution for spherical inclusions has been used in a number of earlier studies; however, this is not valid for cylindrical inclusions [Citation26–30]. Furthermore, numerical simulations were performed using ANSYS APDLTM for a three-dimensional representative volume element (RVE) model. An RVE model with both aligned and randomly oriented nanofillers was created using the interfaces of MATLABTM and ANSYS APDLTM. Our closed-form solution to MMT was verified by a comparison with experimental and numerical simulation results.
2. Experimental
2.1. Material
The thermoset polymer, Araldite CY-230 liquid epoxy resin (density of 1.19 g/cm3), and its corresponding hardener (LY951) used in the experiment were supplied by the Huntsman Group. Multi-walled carbon nanotubes (MWCNTs) with an average diameter of 65 nm, a density of 1.9 g/cm3, and a length ranging from 6.5 to 10 µm were acquired from Sigma Aldrich.
2.2. Composite preparation
In order to obtain a homogeneous dispersion of MWCNTs in a clear and colorless liquid epoxy resin, the solution mixing technique was applied. The bath-type sonicator was used with frequency of 40 kHz and a power of 120 W, using a procedure similar to that in our previous study, to ensure a uniform distribution of the nanotubes [Citation31]. A 5 mm-thick aluminum plate was machined with wire EDM to create a mold cavity, and two similar acrylic sheets were machined with a CO2 laser. By tightening the nut and bolt, a sandwich structure was designed, which provides a framework for the mold cavity. In this study, pure acetone (99.99%) was used as a solvent. A bath sonicator was used to churn the solution for an hour to separate any agglomerated MWCNTs. The solution was sonicated using a for 4 h at 60 °C after the pouring of epoxy, then magnetically stirred until all of the acetone evaporated. After waiting about 10 to 12 h, the solution was degassed in order to get rid of the trapped air. The solution is diluted by adding the hardener (Ardur 951) at a 1:10 ratio. Afterward, the hardener was added to the solution, and the resulting mixture was thoroughly stirred. The mixture was then carefully poured into the mold, ensuring that it was evenly distributed and free of any air bubbles. The mold was vertically placed in the vacuum chamber to remove any bubbles or trapped air. The sample was machined into the desired shape once the sheet was prepared.
2.3. Field emission-scanning electron microscope (FE-SEM)
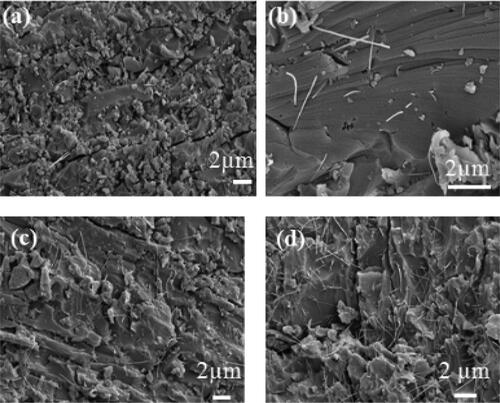
Four distinct MWCNT weight fractions (0.25%, 0.50%, 0.75%, and 1%) were used to study the dispersion of MWCNT in the nanocomposites. The morphological observation was conducted through the field emission-scanning electron microscope (FE-SEM, Gemini SEM 500) at 5 kV.
2.4. Thermal conductivity measurement
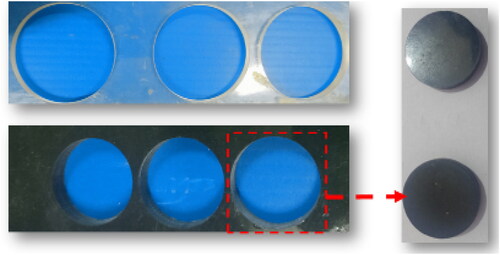
The thermal conductivity of the polymer nanocomposite was evaluated using a laser flash method diffusivity of (the Netzsch LFA 447 NanoflashTM system) by measuring its specific heat and thermal diffusivity. The effective thermal conductivity was calculated using the average of the values obtained from testing three samples of each weight fraction. A standard deviation was used to ensure the precise recording of the results. The disc-shaped samples with a diameter of 12.7 mm and a thickness of 2 mm were created from the composite sheet through machining, as shown in . Xenon flash lamps with a voltage of 304 V and a short pulse width of 0.31 ms were used to heat the sample in an argon environment. An In–Sb photodetector was used to measure the temperature rise on the back surface. Both sides of each sample were pasted with a very thin layer of graphite, before testing. EquationEq. (1)(1)
(1) was utilized to determine the thermal conductivity of MWCNT-polymer nanocomposites (
(1)
(1)
Where
and
respectively denote thermal diffusivity, density, and specific heat capacity. An estimated 5% margin of error for the thermal diffusivity measurement is considered in the analysis.
Figure 1. Disc-shape sample extracted from a composite sheet.
3. Theoretical approach
An aligned and randomly oriented cylindrical shaped filler is used in this section to estimate the effective thermal conductivity using the FE model and the Mori-Tanaka technique. The influence of the aspect ratio () of cylindrical-shaped MWCNT-polymer nanocomposites on thermal conductivity was also investigated. Solid cylindrical fillers were assumed to avoid the poor quality of meshing in FE simulation and an average diameter (
of 65 nm was assumed for cylindrical filler. In all FE and analytical calculations, thermal conductivity of filler (
was used 1950
as reported in [Citation32]. The thermal conductivity of epoxy (
) was 0.312
as measured experimentally. Interfacial thermal resistance (
) was also included in this study for accurate estimation of the effective thermal conductivity of the polymer nanocomposite. The Kapitza resistance between the MWCNTs and epoxy was taken to be 8 × 10⁻⁸ m2K/W for this study, which was calculated through MD simulation by Huxtable et al. [Citation23]. An interphase layer thickness (
) between MWCNTs and epoxy was considered to be 2 nm for our study [Citation33]. Isotropic thermal conductivity was assumed for the matrix, fiber, and interphases.
3.1. Analytical modelling
Mori-Tanaka model (MTM) is a classical micromechanical approach to predict the effective thermal conductivity of composite. The MTM [Citation34–37] takes into account the constant heat flux flow in steady-state situations by assuming a single elliptic heterogeneity and an infinite homogeneous matrix domain. The effective thermal conductivity [Citation37,Citation38] of composites is predicted in terms of the average heat flux (q) and the temperature gradient ( as stated in EquationEq. (2)
(2)
(2) .
(2)
(2)
Where represents the second-rank thermal conductivity tensor,
denotes the temperature gradient and q indicates the average heat flux vector. Mori-Tanka formulation [Citation39] based on Eshelby tensor for effective thermal conductivity (
can be expressed as:
(3)
(3)
Where the concentration tensor for matrix () and concentration tensor for non-dilute reinforcement (
)can be expressed in EquationEqs. (4)
(4)
(4) and Equation(5)
(5)
(5) , respectively [Citation11].
(4)
(4)
(5)
(5)
Here,
and
represent the thermal conductivity of matrix, thermal conductivity of filler, Eshelby tensor and identity tensor, respectively, while
and
represent the volume fraction of the filler and matrix, respectively.
Hatta and Taya [Citation39] derived the Eshelby tensor for ellipsoidal inclusions, where the principal semi-axes are given by ( for a cylindrical inclusion and (
for a spherical inclusion. The aspect ratio (λ) of a cylindrical inclusion can be written as
and the Eshelby tensor for this type of inclusion is given by EquationEq. (6)
(6)
(6) . On the other hand, the Eshelby tensor for a spherical particle is represented by EquationEq. (7)
(7)
(7) . In the Eshelby tensor matrix, only the entries corresponding to
and
are nonzero, while all other entries are zero.
(6)
(6)
(7)
(7)
The value of for cylindrical and spherical shapes is given by EquationEqs. (8)
(8)
(8) and Equation(9)
(9)
(9) , respectively [Citation37].
(8)
(8)
(9)
(9)
Once the values of the Eshelby and identity matrices have been inserted into the concentration tensor(), it can be expressed in terms of
and
as shown in EquationEq. (10)
(10)
(10) .
(10)
(10)
Using the basic formulation of MTM (EquationEq. (3)(3)
(3) ), the effective thermal conductivity in the longitudinal direction for aligned cylindrical fillers was derived in closed form without considering the effect of interfacial thermal resistance (ITR), as shown in EquationEq. (11)
(11)
(11) . Computing the effective thermal conductivity for spherical inclusions is straightforward as it only requires substituting the value of η = 2/3 in the closed-form expression derived for cylindrical fillers (EquationEq. (11)
(11)
(11) ), which is shown in EquationEq. (12)
(12)
(12) . EquationEquation (12)
(12)
(12) also does not take into account the influence of interfacial thermal resistance (ITR).
(11)
(11)
(12)
(12)
To calculate the average global orientation for effective thermal conductivity of randomly oriented cylindrical fibers, as described in [Citation21], use the equation shown in EquationEq. (13)(13)
(13) .
(13)
(13)
Where the and
denote the Euler angles between the global and local coordinate systems, and the
represents the transformation matrix. The representation of the transformation matrix
is as follows:
(14)
(14)
is the transpose matrix of the transformation matrix
as shown in EquationEq. (15)
(15)
(15) .
(15)
(15)
Finally, we obtain a closed-form expression for the effective thermal conductivity of randomly oriented cylindrical fibers () without considering the effect of interfacial thermal resistance (ITR), which is given by EquationEq. (16)
(16)
(16) .
(16)
(16)
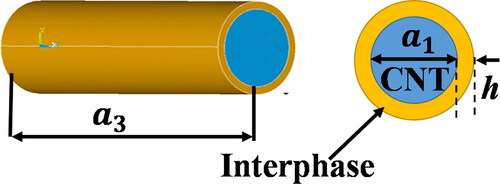
For ellipsoidal inclusions, the Eshelby tensor is defined using the principal semi-axes, which are given by ( for cylindrical inclusions. In this context, the diameter of a cylindrical inclusion, such as a carbon nanotube (CNT), can be denoted by
while its length can be represented by
In illustrates the interphase thickness h and ITR
The interphase thermal conductivity [Citation33] can be expressed as
or
The combined effective thermal conductivity of a single CNT and its interphase layer, treated as an equivalent fiber, can be expressed as EquationEq. (17)
(17)
(17) or EquationEq. (18)
(18)
(18) , where the interphase layer is assumed to behave as the matrix and the CNT as the filler. EquationEquation (19)
(19)
(19) expresses the volume fraction of interphase and CNT for the system thin-coated filler cylinder.
(17)
(17)
(18)
(18)
(19)
(19)
Figure 2. Single CNT with interphase layer thickness.
The effective thermal conductivity of a MWCNT-polymer nanocomposite with ITR effect for both aligned and randomly oriented fillers can be calculated using EquationEqs. (11)(11)
(11) and Equation(16)
(16)
(16) , respectively. This can be achieved by substituting the equivalent fiber thermal conductivity, which is calculated from EquationEq. (18)
(18)
(18) . EquationEquations (20)
(20)
(20) and Equation(21)
(21)
(21) describe the closed-form solution of the effective thermal conductivity of MWCNT-polymer nanocomposites with ITR effect for aligned and randomly oriented cylindrical fillers. The effective thermal conductivity for a spherical filler can be calculated by substituting the value of
in either EquationEq. (20)
(20)
(20) or EquationEq. (21)
(21)
(21) , as shown in EquationEq. (22)
(22)
(22) . The combined filler and interphase volume fraction (
and matrix volume fraction (
can be obtained from EquationEqs. (23)
(23)
(23) and Equation(24)
(24)
(24) , respectively.
(20)
(20)
(21)
(21)
(22)
(22)
(23)
(23)
(24)
(24)
Where the
and
are volume of CNT, interphase and RVE respectively.
3.1. FE modelling
To predict the effective thermal conductivities of MWCNT-polymer nanocomposites, we utilized finite element modeling with the representative volume element (RVE) approach. The ANSYS APDL script was created to perform the simulation. The MATLAB code used to develop the ANSYS APDL script was designed to prevent overlapping between generated fillers in a cubic RVE model. The model can have randomly oriented or aligned cylindrical fillers along the longitudinal direction. The size of the RVE was anticipated from EquationEq. (25)(25)
(25) based on the volume of the fillers and volume fractions. The volume fraction can be computed using EquationEq. (26)
(26)
(26) with the help of the weight fraction and the density of the nanofiller and matrix. The volume of the filler can be predicted by using EquationEq. (27)
(27)
(27) with the pre-decided aspect ratio and the number of fillers in the RVE.
(25)
(25)
(26)
(26)
(27)
(27)
Where and
represent weight and density of the matrix, while
represent the weight, Volume, density, weight fraction, and volume fraction of the filler.
denotes the diameter of the cylinder,
represents its length, and
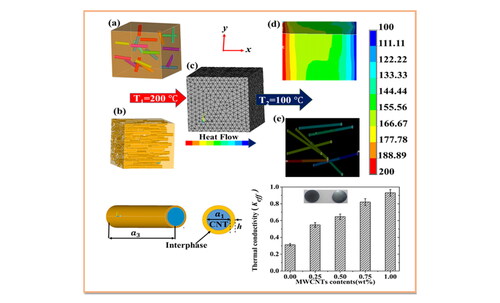
represents the number of fillers. The created RVE geometry of randomly oriented and aligned filler is represented in respectively. APDL script was developed that meets the periodicity conditions, ensuring that the RVE would be generated with the correct filler concentration. depicts the discretized view of the RVE model that uses SOLID278 elements with an 8-noded tetrahedron shape and three degrees of freedom. To determine the size of the representative volume element (RVE), a convergence study was conducted, which involved analyzing the minimum volume fraction of 0.25 wt.% through different side lengths of cubical RVEs that ranged from 0.850 µm to 1.54 µm. We chose a size of 1.226 µm which resulted in consistent results with 8 CNTs in the RVE. Additionally, the element size was determined based on the convergence test, and an optimal element size of 5 nm was selected.
Figure 3. FE simulation 3D views of (a) randomly oriented MWCNTs RVE, (b) aligned MWCNTs along the longitudinal direction RVE, (c) meshed view and heat flow condition in the RVE, (d) temperature gradient created in the RVE, and (e) temperature gradient created in the exposed MWCNTs.
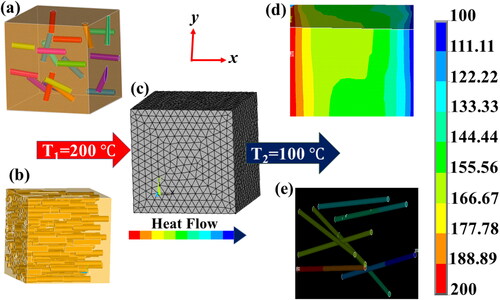
The effective thermal conductivity of the polymer composite was determined under steady-state conditions, where heat accumulation within the RVE is zero and a longitudinal temperature gradient is created due to a constant heat flux [Citation11]. To achieve this, we imposed the following boundary conditions on the surfaces of the RVE, as presented in (a) constant heat flux flow was created in the longitudinal direction ( and
), and (b) adiabatic insulation was maintained on the remaining four perpendicular surfaces. The steady-state temperature distribution of the RVE was obtained by solving the thermal differential equation [Citation40] given in EquationEq. (28)
(28)
(28) :
(28)
(28)
Here,
represent the thermal conductivity in the x, y and z direction, respectively. For the isotropic assumption of the matrix and filler, we have
and
respectively. We assume that the x-direction is the longitudinal direction, and the steady-state condition in the longitudinal direction thermal differential equation is simplified as [Citation41].
(29)
(29)
According to Fourier’s law, the effective thermal conductivity in longitudinal direction [Citation42] can be given as EquationEq. (30)(30)
(30) .
(30)
(30)
Where q is the heat flux, L represents the length of RVE, and is the temperature differences in longitudinal direction. depict the temperature gradient generated by the FE simulation in the RVE and MWCNTs, respectively. The heat flux flow was calculated through FE simulation by assuming a temperature difference of 100 °C along the longitudinal direction of the RVE.
4. Results and discussion
4.1. Experimental results
The fracture surface was prepared to study the morphology of ultrasonically mixed MWCNTs composite at four different weight fractions 0.25%, 0.5%, 0.75%, and 1% respectively using FE-SEM and it is presented in . The morphology results show that the MWCNTs are evenly dispersed throughout the epoxy up to one weight percentage on the fracture surface. The FE-SEM observation demonstrates that ultrasonic mixing technique is efficient method for enhancing nanofiller dispersion in the matrix.
Figure 4. FE-SEM images of fracture surface of the MWCNTs nanocomposites with respect to the MWCNTs concentration a) 0.25 wt% (b) 0.50 wt% (c) 0.75 wt. % and (d) 1 wt%.
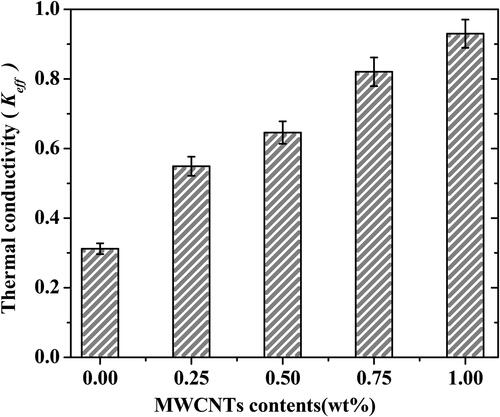
The effective thermal conductivity of MWCNTs-polymer nanocomposites with varying filler concentrations at 0%, 0.25%, 0.50%, 0.75%, and 1% was measured experimentally. With the addition of 1 wt.% MWCNTs in polymer, the thermal conductivity was elevated by approximately 197%, as illustrated in .
Figure 5. Thermal conductivity of nanocomposites with respect to the MWCNTs concentration 0.25 wt%, 0.50 wt%, 0.75 wt.%, and 1 wt% and inset is the disc-shaped samples of 0.25 wt.% and 1 wt.%.
4.2. Validation of analytical models using FE modelling, experimental results, and literature review
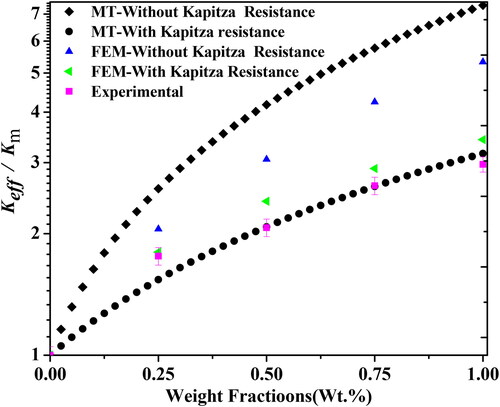
FEM studies with and without the Kapitza resistance effect were simulated in order to compare them to the MT results based on the MWCNT weight fractions. MWCNT fillers are assumed to be solid cylinders [Citation43,Citation44] that are evenly dispersed in the matrix. The perfect bonding between polymer and CNT was assumed. The effect of thermal interfacial resistance between MWCNT and polymer on the estimated thermal conductivity of MWCNT-polymer nanocomposite for randomly oriented fiber with a constant aspect ratio of 100 was studied. shows that the results obtained from the MMT and FE model without incorporating the influence of thermal interfacial resistance are approximately 150% and 79% higher than the experimental value for the MMT model and the FE model respectively. The experimental results show that the effective thermal conductivity of MWCNT-polymer nanocomposites is significantly lower than what was calculated by the original Mori-Tanaka approach without taking into account the ITR between MWCNT and polymer. ITR lowers the overall thermal conductivity of polymer nanocomposites and the contact resistance between CNTs has an also adverse effect on thermal conductivity at higher volume fractions [Citation18,Citation19]. In this study, the effect of contact resistance between carbon nanotubes (CNTs) is assumed to be insignificant due to their small volume fraction, and the results were simulated assuming that no CNTs overlap in the composite. The thermal conductivity of polymer composites was evaluated using the original MTM without taking into account the impact of Kapitza resistance and the closed form solution with Kapitza resistance of the modified MTM was developed and estimated for various MWCNT weight fractions. shows that the taking into account the thermal resistance between the MWCNT and the polymer, the close solution of the modified MTM results is very consistent with the experimental data, and the finite element simulation indicates that the value obtained from the RVE simulation matches well with the experimental results.
Figure 6. Analysis of thermal conductivity variation in nanocomposites with respect to MWCNT loading, using FE-simulation, MMT, and experimental investigation.
To validate our model, we utilized the experimental data from Kim et al. [Citation18], which investigated the effective thermal conductivity of a polycarbonate nanocomposite with varying weight fractions of carbon nanotubes (CNTs). The same experimental data was also converted into volume fractions and compared with a simplified unit cell (SUC) coupled with the Maxwell-Garnett effective medium (EM) method by Aghdam et al. [Citation45]. In , we illustrate the thermal conductivity variation with volume fraction of randomly oriented straight CNTs with interfacial thermal resistance. The values of thermal conductivity for the matrix and filler were taken from [Citation45] as 0.21 W/m-K and 150 W/m-K, respectively, with an interfacial thermal resistance of 10–8 m2 K/ W and a CNT diameter of 60 nm. Our model results, as depicted in , agree well with the experimental data and are consistent with the EM model predictions. Thus, these comparisons highlight the effectiveness of our model in producing realistic results for the system.
Figure 7. Analysis of thermal conductivity variation in nanocomposites with respect to CNT volume fraction using present MMT, experiment [Citation18] and EM model [Citation45].
![Figure 7. Analysis of thermal conductivity variation in nanocomposites with respect to CNT volume fraction using present MMT, experiment [Citation18] and EM model [Citation45].](/cms/asset/8b7c506d-3963-4f0d-908b-1a0678301cd3/ynan_a_2218240_f0007_c.jpg)
4.3. Effect of orientation and aspect ratio of MWCNTs on the effective thermal conductivity
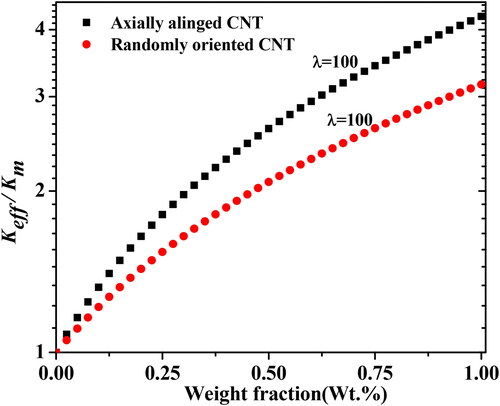
The thermal conductivity of MWCNT-polymer composites has been studied parametrically at different aspect ratios and orientations by utilizing the closed-form solution of modified MT. The studies show that the thermal conductivity of the randomly oriented CNT has a lower value than that of the longitudinally aligned CNT in the matrix. depicts the effective thermal conductivity of polymer nanocomposite in randomly oriented and longitudinally aligned CNT at varying weight fractions. shows that the thermal conductivity of aligned directions is about 33% higher than that of randomly oriented CNT at 1 wt.% and about 17% higher at 0.25 wt.%. The results reveal that axially aligned fillers have improved thermal conductivity and better heat transfer capacities than randomly oriented fillers and that this effect will be exacerbated, more by an increase in the filler weight percentage. Aligned MWCNT arrays may be able to provide more direct paths for the thermal conductivity of the composite. In contrast, efficient phonon transport pathways in polymer composites with randomly oriented nanotube dispersion are difficult due to point interconnection in the random nanotube network, which restricts phonon transport [Citation10, Citation46,Citation47].
Figure 8. Thermal conductivity of nanocomposites with randomly oriented and axial alinged MWCNTs upto 1 wt% concentration.
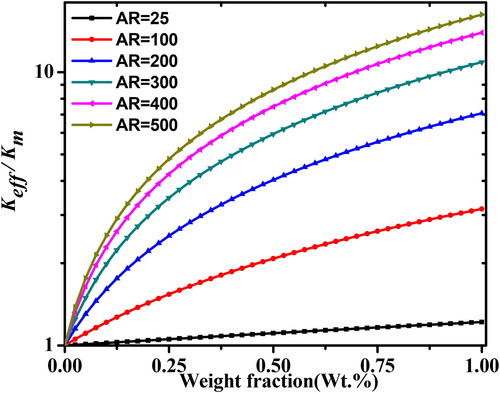
The thermal conductivity of MWCNTs-polymer nanocomposite with varying aspect ratios at varying weight fractions was investigated using the closed-form solution of modified MTM. shows the range of aspect ratios from 1 to 500 at weight fractions up to 1%. The results demonstrate that the thermal conductivity is much improved at AR = 500. This finding demonstrates that the cylindrical filler with the higher aspect ratio is significantly more efficient in heat transfer.
Figure 9. Thermal conductivity of nanocomposites with varying aspect ratio() of randomly oriented MWCNTs loading up to 1 wt.%.
4.4. Effect of interphase layer thickness on the effective thermal conductivity
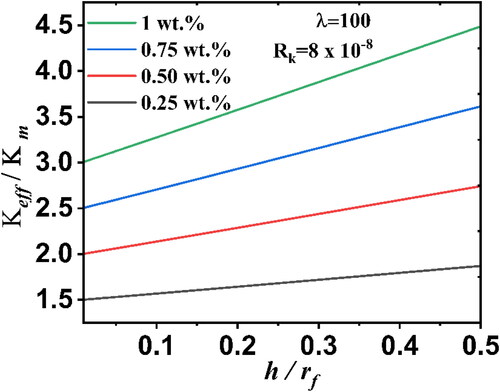
The thickness of the interphase layer between the matrix and filler is an important factor in determining the effective thermal conductivities of nanocomposites [Citation48]. To investigate the effect of the interphase thickness on the effective thermal conductivity of nanocomposites, we considered different interphase thicknesses and weight fractions (0.25, 0.50, 0.75, and 1 wt.%) of MWCNTs, as shown in . The results indicate that the effective thermal conductivity of nanocomposite increases with increasing interphase thickness. Specifically, we observe that increasing the interphase thickness from 2 nm to 16.25 nm leads to a 41.7% increase in thermal conductivity at 1 wt.% MWCNTs, but only a 21.4% increase at 0.25 wt.%. This result suggests that the impact of the interphase thickness on the effective thermal conductivity is less pronounced at lower filler contents in the nanocomposite.
Figure 10. Normalized effective thermal conductivity with interphase thickness for different weight fraction.
4.5. Effect of the Kapitza resistance on the effective thermal conductivity
The influence of interfacial thermal resistance on thermal conductivity was investigated with two sensitivity parameters: (a) interphase thickness and (b) aspect ratio. The literature survey conducted by Huang et al. [Citation49] reveals that the interfacial thermal resistance (ITR) between the polymer and filler can vary from 0.1 to 15 × 10−8 K m2/ W. To investigate the effective thermal conductivity with varying ITR, we conducted experiments with different interphase thicknesses at four weight fractions (0.25 wt. %, 0.50 wt.%, 0.75 wt.%, and 1 wt.%) as shown in , respectively. The results indicate that as ITR between polymer and MWCNTs increases, the effective thermal conductivity decreases rapidly up to 8 × 10⁻⁸ m2 K/W. However, after this point, the increment in the effective thermal conductivity becomes insignificant. These results also indicate as the interphase thickness increases, the effective thermal conductivity decreases more rapidly with an increment of ITR, as shown in . The trend of the curve indicates that the that the curve corresponding to a lower interphase thickness at is almost flat at lower interfacial thermal resistance, as compared to the curve at
Additionally, at the same interphase thickness
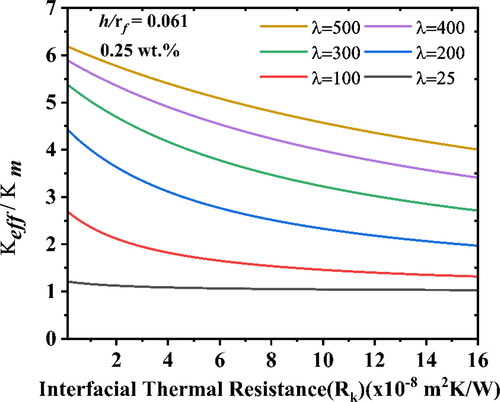
, the effective thermal conductivity diminishes by 73% at 1 wt.% and 50% at 0.25 wt.%, indicating that increasing the interfacial thermal resistances at higher weight fractions leads to barrier a in heat transfer. shows that the variation of normalized thermal conductivity with ITR at different aspect ratio of MWCNTs. shows that the curve is nearly horizontal at an aspect ratio of
and that the slope rapidly falls with ITR when the aspect ratio is increased. The results suggest that, with an increase in the interfacial thermal resistance adversely affects, the effective thermal conductivity at the higher aspect ratio of MWCNTs.
Figure 11. Normalized effective thermal conductivity vs. varying interfacial thermal resistance (ITR) for different interphase thickness for (a) 0.25 wt.%, (b) 0.50 wt.%, (c) 0.75 wt.%, and (d) 1 wt.% of MWCNTs.
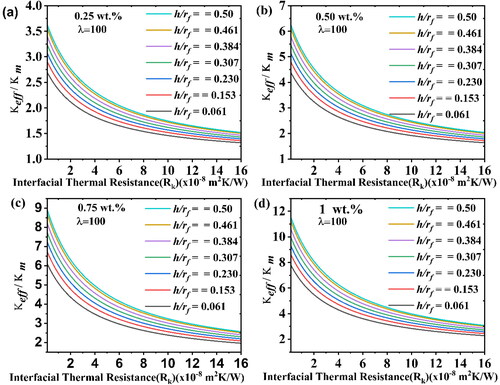
Figure 12. Normalized effective thermal conductivity vs. varying interfacial thermal resistance (ITR) for different aspect ratios.
5. Conclusion
In summary, this study investigated the thermal conductivity of MWCNT-polymer nanocomposites through experimentally, analytically, and numerically. The key findings are as follows:
Increasing the filler concentration enhances the effective thermal conductivity of the nanocomposite.
It was found through comparative analysis that the estimated effective thermal conductivity using the MMT closed-form solution was in good agreement with both the FE simulation and experimental results, as well as with available literature.
The developed closed-form solution of MMT accurately predicts the thermal conductivity and accounts for the effect of interfacial thermal resistances on the thermal properties of the nanocomposites.
Analytical modelling was used to explore the effects of weight concentration, orientation, and aspect ratio of the filler on the effective thermal conductivity of the polymer nanocomposite.
The effect of interphase thickness was investigated and it was found that the effective thermal conductivity of the nanocomposite is less pronounced at lower filler contents.
Sensitivity analysis was performed on interfacial thermal resistance with aspect ratio and interphase thickness, and it was found that increasing ITR has a limited effect on the normalized thermal conductivity of the nanocomposite after a certain point.
This study assumes perfect bonding between MWCNT and polymer to estimate the thermal conductivity, and provides a simple and efficient methodology for accurately estimating the thermal conductivities of nanocomposites.
| Nomenclature | ||
| = | thermal conductivity of composite | |
| = | second-order thermal conductivity | |
| = | thermal conductivity of matrix | |
| = | thermal conductivity of filler | |
| = | thermal conductivity of interphase | |
| = | thermal diffusivity | |
| = | density | |
| = | specific heat | |
| = | Eshelby’s tensor of the particle | |
| = | inclusion | |
| = | interphase | |
| = | volume of the filler | |
| = | volume fraction of filler | |
| = | volume fraction of matrix | |
| = | combined filler and interphase volume fraction | |
| = | concentration tensor for matrix | |
| = | weight fraction of the filler | |
| = | aspect ratio | |
| = | weight of the matrix | |
| = | weight of the filler | |
| = | principal semi-axes of ellipsoidal inclusion | |
| = | number of fillers | |
| = | heat flux | |
| = | length of RVE | |
| = | temperature difference | |
| = | transformation matrix | |
| = | Euler’s angles | |
| = | interfacial thermal resistance | |
| h | = | interphase thickness |
| = | concentration tensor for non-dilute reinforcement | |
| = | radius of filler | |
Disclosure statement
No potential conflict of interest was reported by the authors.
Additional information
Notes on contributors
Shambhu Kumar
Shambhu Kumar has obtained his MTech (Mechanical Engineering, Machine Design) from Motilal Nehru National Institute of Technology Allahabad, in 2016. Currently, pursuing his PhD at IIT Patna and is working in the field of nanocomposites to enhance the thermomechanical properties of polymers for applications in the field of electronic encapsulation.
Akhilendra Singh
Dr Akhilendra Singh obtained his PhD from BITS Pilani (Rajasthan). Currently working as an Associate Professor in the Department of Mechanical Engineering at IIT Patna. He has many publications in the field of Fracture and Fatigue. His area of interests are FEM, XFEM, Meshfree Method, Computational Mechanics, Fracture and Fatigue, Thermal Engineering and many more.
Mayank Tiwari
Prof. (Dr) Mayank Tiwari obtained his PhD from Indian Institute of Technology (IIT) Delhi and further did Post Doctorate from Ohio State University. Post that, the author worked with General Electric in divisions like Aviation, GRC and a few more for a period of 14 years. Currently working as a Professor in the Department of Mechanical Engineering at IIT Patna. He has many Patents and publications in the field of gas turbines and rotor dynamics. His area of interests are rotor dynamics, gas turbine engines, friction wear, lubrication and many more.
References
- Lee D, Lee S, Byun S, et al. Novel dielectric BN/epoxy nanocomposites with enhanced heat dissipation performance for electronic packaging. Compos. Part A Appl. Sci. Manuf. 2018;107(vember 2017):217–223.
- Chen C, Xue Y, Li X, et al. High-performance epoxy/binary spherical alumina composite as underfill material for electronic packaging. Compos. Part A Appl. Sci. Manuf. 2019;118:67–74.
- Zhang L, Zhang X, Hua W, et al. Epoxy resin-hydrated halt shaped composite thermal control packaging material for thermal management of electronic components. J. Clean. Prod. 2022;363:132369.
- Chen C, Wang H, Xue Y, et al. Structure, rheological, thermal conductive and electrical insulating properties of high-performance hybrid epoxy/nanosilica/AgNWs nanocomposites. Compos. Sci. Technol. 2016;128:207–214.
- Morishita T, Katagiri Y, Matsunaga T, et al. Design and fabrication of morphologically controlled carbon nanotube/polyamide-6-based composites as electrically insulating materials having enhanced thermal conductivity and elastic modulus. Compos. Sci. Technol. 2017;142:41–49.
- Morishita T, Matsushita M, Katagiri Y, et al. A novel morphological model for carbon nanotube/polymer composites having high thermal conductivity and electrical insulation. J. Mater. Chem. 2011;21(15):5610–5614.
- Cui W, Du F, Zhao J, et al. Improving thermal conductivity while retaining high electrical resistivity of epoxy composites by incorporating silica-coated multi-walled carbon nanotubes. Carbon N. Y. 2011;49(2):495–500.
- Yang W, Wang Y, Li Y, et al. Three-dimensional skeleton assembled by carbon nanotubes/boron nitride as filler in epoxy for thermal management materials with high thermal conductivity and electrical insulation. Compos. Part B Eng. 2021;224:109168.
- Zhan H, Zhang G, Zhuang X, et al. Low interfacial thermal resistance between crossed ultra-thin carbon nanothreads. Carbon N. Y. 2020;165:216–224.
- Han Z, Fina A. Thermal conductivity of carbon nanotubes and their polymer nanocomposites: a review. Prog. Polym. Sci. 2011;36(7):914–944.
- Pak SY, Kim SY, Lee D, et al. Micro-Macroscopic coupled modeling for the prediction of synergistic improvement on the thermal conductivity of boron nitride and multi-walled carbon nanotube reinforced composites. Compos. Part A Appl. Sci. Manuf. 2021;148:106474.
- Mahdavi M, Yousefi E, Baniassadi M, et al. Effective thermal and mechanical properties of short carbon fiber/natural rubber composites as a function of mechanical loading. Appl. Therm. Eng. 2017;117:8–16.
- Hassanzadeh-Aghdam MK, Mahmoodi MJ, Ansari R. Creep performance of CNT polymer nanocomposites – An emphasis on viscoelastic interphase and CNT agglomeration. Compos. Part B Eng. 2019;168:274–281.
- Haghgoo M, Ansari R, Hassanzadeh-Aghdam MK. The effect of nanoparticle conglomeration on the overall conductivity of nanocomposites. Int. J. Eng. Sci. 2020;157:103392.
- Madaleno L, Schjødt-Thomsen J, Pinto JC. Morphology, thermal and mechanical properties of PVC/MMT nanocomposites prepared by solution blending and solution blending + melt compounding. Compos. Sci. Technol. 2010;70(5):804–814.
- Hida S, Hori T, Shiga T, et al. Thermal resistance and phonon scattering at the interface between carbon nanotube and amorphous polyethylene. Int. J. Heat Mass Transf. 2013;67:1024–1029.
- Yu J, Lacy TE, Toghiani H, et al. Micromechanically-based effective thermal conductivity estimates for polymer nanocomposites. Compos. Part B Eng. 2013;53:267–273.
- Kim HS, Jang JU, Yu J, et al. Thermal conductivity of polymer composites based on the length of multi-walled carbon nanotubes. Compos. Part B Eng. 2015;79:505–512.
- Bui K, Grady BP, Papavassiliou DV. Heat transfer in high volume fraction CNT nanocomposites: effects of inter-nanotube thermal resistance. Chem. Phys. Lett. 2011;508(4–6):248–251.
- Hassanzadeh-Aghdam MK, Mahmoodi MJ. Materials science & engineering B micromechanical modeling of thermal conducting behavior of general carbon nanotube-polymer nanocomposites. Mater. Sci. Eng. B. 2018;229:173–183.
- Zhong H, Lukes JR. Interfacial thermal resistance between carbon nanotubes: molecular dynamics simulations and analytical thermal modeling. Phys. Rev. B. 2006;74(12):1–10.
- Liu L, Zhang Z, Gou X. Thermal conductivity of aligned CNT-polyethylene nanocomposites and correlation with the interfacial thermal resistance. Polym. Compos. 2020;41(9):3787–3797.
- Huxtable ST, Cahill DG, Shenogin S, et al. Interfacial heat flow in carbon nanotube suspensions. Nat Mater. 2003;2(11):731–734.
- Clancy TC, Gates TS. Modeling of interfacial modification effects on thermal conductivity of carbon nanotube composites. Polymer (Guildf). 2006;47(16):5990–5996.
- Gary DCL, Seidel D. A micromechanics model for the thermal conductivity of nanotube-polymer nanocomposites. J. Appl. Mech. 2008;75:1–9.
- Lee S, Lee J, Ryu B, et al. A micromechanics-based analytical solution for the effective thermal conductivity of composites with orthotropic matrices and interfacial thermal resistance. Sci Rep. 2018;8(1):1–11. pp.
- Böhm HJ, Nogales S. Mori-Tanaka models for the thermal conductivity of composites with interfacial resistance and particle size distributions. Compos. Sci. Technol. 2008;68(5):1181–1187.
- Gu ST, Wang AL, Xu Y, et al. Closed-form estimates for the effective conductivity of isotropic composites with spherical particles and general imperfect interfaces. Int. J. Heat Mass Transf. 2015;83:317–326.
- Alvarez-Guerrero S, Ordonez-Miranda J, de Coss R, et al. Determination of the effective thermal conductivity of particulate composites based on VO2 and SiO2. Int. J. Therm. Sci. 2022;172(PA):107278.
- Stránský J, Vorel J, Zeman J, et al. Mori-tanaka based estimates of effective thermal conductivity of various engineering materials. Micromachines. 2011;2(2):129–149.
- Kumar S, Singh A, Tiwari M. MWCNTs polymer nanocomposite with enhanced thermomechanical properties and electrical insulation for effective encapsulation. Mater. Res. Express. 2023;10(2):025003.
- Kim SY, Noh YJ, Yu J. Improved thermal conductivity of polymeric composites fabricated by solvent-free processing for the enhanced dispersion of nanofillers and a theoretical approach for composites containing multiple heterogeneities and geometrized nanofillers. Compos. Sci. Technol. 2014;101:79–85.
- Su Y, Li JJ, Weng GJ. Theory of thermal conductivity of graphene-polymer nanocomposites with interfacial kapitza resistance and graphene-graphene contact resistance. Carbon N. Y. 2018;137:222–233.
- Mori T, Tanaka K. Average stress in matrix and average elastic energy of materials with misfitting inclusions. Acta Metall. 1973;21(5):571–574.
- Benveniste Y. A new approach to the application of Mori-Tanaka’s theory in composite materials. Mech. Mater. 1987;6(2):147–157.
- You A, et al. Effective thermal conductivity of a misoriented short fiber composite development of JT coolers operating at cryogenic temperatures with t. 2011;2478–2486.
- Chen CH, Wang YC. Effective thermal conductivity of misoriented short-fiber reinforced thermoplastics. Mech. Mater. 1996;23(3):217–228.
- He B, Mortazavi B, Zhuang X, et al. Modeling kapitza resistance of two-phase composite material. Compos. Struct. 2016;152:939–946.
- Hiroshi H, Minoru T. Equivalent inclusion method for steady state heat conduction in composites. Int. J. Eng. Sci. 1986;24(7):1159–1172.
- Ding D, Huang R, Wang X, et al. Thermally conductive silicone rubber composites with vertically oriented carbon fibers: a new perspective on the heat conduction mechanism. Chem. Eng. J. 2022;441:136104.
- Sun Y, Zhou L, Han Y, et al. A new anisotropic thermal conductivity equation for h-BN/polymer composites using finite element analysis. Int. J. Heat Mass Transf. 2020;160:120157.
- Pan D, Li Q, Zhang W, et al. Highly thermal conductive epoxy nanocomposites filled with 3D BN/C spatial network prepared by salt template assisted method. No. Compos. Part B Eng. 2021;209:108609.
- Hedayati H, Sobhani Aragh B. Influence of graded agglomerated CNTs on vibration of CNT-reinforced annular sectorial plates resting on pasternak foundation. Appl. Math. Comput. 2012;218(17):8715–8735.
- Mora A, Verma P, Kumar S. Electrical conductivity of CNT/polymer composites: 3D printing, measurements and modeling. Compos. Part B Eng. 2020;183:107600.
- Hassanzadeh-Aghdam MK, Mahmoodi MJ, Jamali J, et al. A new micromechanical method for the analysis of thermal conductivities of unidirectional fiber/CNT-reinforced polymer hybrid nanocomposites. Compos. Part B Eng. 2019;175:107137.
- Marconnet AM, Yamamoto N, Panzer MA, et al. Thermal conduction in aligned carbon nanotube-polymer nanocomposites with high packing density. ACS Nano. 2011;5(6):4818–4825.
- Goh PS, Ismail AF, Ng BC. Directional alignment of carbon nanotubes in polymer matrices: contemporary approaches and future advances. Compos. Part A Appl. Sci. Manuf. 2014;56:103–126.
- Gao M, Yang B, Huang Y, et al. Effects of general imperfect interface/interphase on the in-plane conductivity of thermal composites. Int. J. Heat Mass Transf. 2021;172:121213.
- Huang C, Qian X, Yang R. Thermal conductivity of polymers and polymer nanocomposites. Mater. Sci. Eng. R Reports. 2018;132:1–22.