
 ?Mathematical formulae have been encoded as MathML and are displayed in this HTML version using MathJax in order to improve their display. Uncheck the box to turn MathJax off. This feature requires Javascript. Click on a formula to zoom.
Abstract
In this work, Cu (II) ion was chosen as an analyte because it is an important trace element in the human body to maintain organism health. AuNCs (gold nanoclusters) with a mean diameter of ∼2 nm were prepared by a microwave-assisted method, using homocysteine (Hcy) as a reducer and stabilizer. The optimal sample showed a red emission peaking at 624 nm with an emission quantum yield of 17.1%, which was assigned as a ligand to metal nanoparticle core charge transfer (LMNCT). This red emission was effectively quenched by Cu (II) but immune to competing metal cations and anions, showing good selectivity. The quenching mechanism was found as the Cu (II) quenching on the LMNCT procedure to AuNCs. The primary advantage of Hcy-modified AuNCs was the easy and quick synthetic procedure, along with acceptable sensing performance, including good selectivity, linear response, and wide working region.
GRAPHICAL ABSTRACT
1. Introduction
Ever since the first report of luminescent metal nanoclusters, various applications have been tried out owing to their promising features in adjustable emission wavelength, high emission quantum yield, and stable chemical properties, which endows them with wide applications in biosensing, optical imaging, labeling, and therapy [Citation1–13]. Given their similar size to the Fermi wavelength of electrons, these metal nanoclusters exhibit molecule-liked activities such as isolated electronic states and size-controlled electronic transitions. As a consequence, versatile optical and luminescent behaviors are observed from these metal nanoclusters, which endows luminescent metal nanoclusters with potential applications. Among these versatile applications, optical sensing has been convinced as a promising one because of its novelty and virtues, including easy-to-go operation, low cost, and low need for equipment. There has been literature demonstrating the advantages and applications of optical sensing. Corresponding optical sensing systems have been developed and improved [Citation14, Citation15]. For example, gold nanoclusters (AuNCs), which are composed of dozens or hundreds of Au atoms, have been intensively explored for nanotechnology and biotechnology [Citation16]. Some precursive efforts have been devoted to the synthesis of AuNCs and their luminescence and sensing application [Citation17–20, Citation8]. For instance, enhanced luminescence was observed from thiolate ligand-modified AuNCs, as reported by Wu and coworkers [Citation18]. Their synthetic procedure, however, needed sophisticated synthesis, high reacting temperature, long reacting time, and expensive reagents. Later, an improved synthetic method for AuNCs was reported by Ying and coworkers with bovine serum albumin (BSA) as a reducing agent and stabilizer, so that high emission quantum yield was observed [Citation21]. A similar ‘green’ method to synthesize luminescent AuNCs was reported by Zhang and coworkers using an enzyme (horseradish peroxidase) as a stabilizer where the as-synthesized AuNCs were discussed for the optical sensing of H2O2 [Citation22]. The above results have pushed the development of ‘green’ synthesis for AuNCs with environmental friendliness, good compatibility, and high emission quantum yield, along with their application in various fields.
By heating the reaction mixture with microwave irradiation, the chemical reaction can be accelerated significantly, with a short reaction time and high reaction yield, which sparks the exploration of microwave-assisted reactions [Citation23, Citation24]. The advantages of microwave-assisted reactions have been summarized as uniform heating, quick reaction, and limited energy cost compared to traditional chemical reactions [Citation25]. It seems that these features satisfy the synthesis of nanocomposites as well. The microwave-assisted method may shorten synthetic time at moderate conditions so that uniform products can be obtained with homogeneous size and composition. This assumption has been confirmed by Buhler and coworkers, who prepared nanocrystals using a microwave-assisted method [Citation26]. Fe2O3 nanorings have been reported by Yu and coworkers using a microwave-assisted reaction in the absence of templates/surfactants [Citation27]. Similarly, Yacaman and coworkers have prepared Au nanoparticles following a microwave-assisted method in the absence of reducing agents [Citation28]. The successful synthesis of AuNCs via this microwave-assisted method has been recently confirmed as well. For instance, Li and coworkers prepared AuNCs via a one-step method, which was explored for Ag(I) sensing [Citation29]. Highly fluorescent AuNCs have been reported by Choi using BSA (bovine serum albumin) and HSA (human serum albumin) as stabilizers [Citation30]. Very recently, Yan and coworkers applied polypeptide-modified AuNCs to detect Cu(II), further widening the application of AuNCs [Citation31]. In their work, Cu(II) ion was chosen as an analyte because it is an important trace amount element in the human body to maintain organism health. The abnormal Cu(II) level leads to diseases, including Alzheimer’s and Parkinson’s diseases.
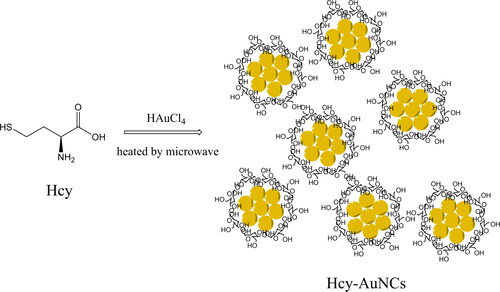
Considering the above-mentioned virtues of microwave-assisted syntheses, such as uniform heating, quick reaction, and limited energy cost, in this work, we decided to prepare Hcy-modified AuNCs using the microwave-assisted method to detect Cu(II) ions. Here, Hcy means homocysteine and serves as a reducing reagent/stabilizer. Hcy was selected for this work because of its low cost and good stability compared to the above-mentioned BSA and HSA. Additionally, its small and simple molecular structure simplifies the synthesis optimization of Hcy-AuNCs. The preparation strategy is shown as Scheme 1. The as-synthesized AuNCs, denoted as Hcy-AuNCs, were discussed in terms of TEM (transmission electron microscope), XPS (X-ray photoelectron spectroscopy), DLS (dynamic light scattering), and IR (infrared) to reveal their composition. Their photophysical performance was discussed, including absorption and emission spectra, emission quantum yield, and lifetime, along with corresponding sensing performance for Cu(II) ion. The corresponding sensing mechanism was revealed as the Cu (II) quenching on the ligand to metal nanoparticle core charge transfer (LMNCT) procedure to AuNCs. This quenching mechanism was different from those of optical sensing systems based on a direct quenching on emissive state via energy transfer or trap of excited state electrons.
Scheme 1. The preparation strategy for Hcy-modified AuNCs using the microwave-assisted method.
2. Materials and methods
2.1. Materials and apparatus
Unless further noticed, all starting materials in this work, including HAuCl4, Cu(II) standard sample, and Hcy, were AR grade ones and commercially obtained from Sigma-Aldrich Chemical Corporation (https://www.sigmaaldrich.cn/). Some inorganic compounds were provided by Dahua (Shanghai, China) Chemical Corporation (http://325574.cn.global-trade-center.com/). Solvent water was treated by MillinporeSigma Quality Filters (https://www.emdmillipore.com/). Prior to use, glassware was soaked in aqua regia (40 °C) and cleaned by redistilled water. XPS and DLS measurement was performed on a PHI-5000 Versaprobe III X-ray Photon-electron Spectrophotometer (ULVCA-PHI, USA, https://www.ulvac-phi.com) and a Malvern Zetasizer Nano ZS90 laser particle size and zeta potential analyzer (Trek, Taiwan, https://www.microtrac.com). IR spectra were collected on a Bruker Vertex 70 FTIR (Fourier transform infrared spectroscopy) spectrometer (KBr tablet, https://www.bruker.com). Micromorphology was carried out by a JEM-2010 transmission electron microscope (JEOL, Japan, https://www.jeol.com). Absorption and emission spectra were collected using a Shimadzu UV-3101PC spectrophotometer (https://www.shimadzu.com) and a Hitachi F-7000 fluorescence spectrophotometer (Xe lamp, https://www.hitachi-hightech.com). Emission quantum yields were determined by the Hitachi F-7000 fluorescence spectrophotometer and an integrating sphere (inner diameter = 12 cm) with quinine sulfate as reference (Φ = 0.54). Emission decay dynamics were monitored on a TEKTRONIX TDS-3052 oscilloscope (excitation source = optical parametric oscillator, https://www.sglabs.it).
2.2. AuNCs synthetic procedure
Following a literature method, Hcy-modified AuNCs were synthesized as follows [Citation30]. HAuCl4 aqueous solution (10 mM, 10 mL) and Hcy aqueous solution (3 mM, 2 mL) were prepared firstly and then mixed together under an ultrasonic bath for 5 min. The resulting solution was transferred into a microwave reactor (3–10 W) and allowed to react for 60–300 s. After natural cooling, the obtained AuNCs aqueous solution was sealed in a refrigerator (4 °C). For the following test and experiment, the as-synthesized AuNCs aqueous solution was diluted with distilled water to stop self-aggregation and self-absorption/quenching.
2.3. AuNCs sensing performance measurement
For sensing performance determination, Cu(II) ions and interfering metal cations were carefully weighted and then mixed with AuNCs aqueous solutions under ultrasonic bath (3 min). Then, the sample was determined by F-7000 fluorescence spectrophotometer, on which steady emission spectra were recorded.
3. Results and discussion
3.1. Optimization for AuNCs synthetic condition
Firstly, the combination of microwave power and irradiation time was optimized, aiming at an optimal AuNCs synthetic condition. The cross-optimization schedule for microwave power and irradiation time is listed in , along with the corresponding emission wavelength (λem), FWHM (full width at half maximum), and emission quantum yield (Φ). Corresponding emission spectra are depicted in . It seems that the emission wavelength and quantum yield of AuNCs both depend on microwave power and irradiation time. A red emission ranging from 622 to 636 nm is observed, with emission quantum yield varying from 2.4 to 17.1%. Each AuNCs sample exhibits a Gaussian-liked emission band, except for the reference sample (a mixture of HAuCl4 and Hcy upon no microwave heating). This result suggests that this red emission is emitted by AuNCs sample itself, instead of HAuCl4, Hcy or their adduct). Even with the same irradiation time, microwave power exerts its effect on both emission wavelength and FWHM of AUNCs, as depicted in . A slight redshift tendency is observed when increasing microwave power, along with the increasing FWHM value. Upon the same microwave power, emission wavelength and FWHM are generally localized in a narrow region. This observation suggests that the emission performance of AuNCs is controlled mainly by microwave power. The highest emission quantum of 17.1% among these AuNCs samples is observed given microwave power of 5 W and irradiation time of 2 min. Upon microwave power lower than 5 W, AuNCs may not be fully and efficiently reduced, leading to a low amount of AuNCs and correspondingly low Φ. Upon an even higher microwave power than 5 W, the excess energy may decompose the as-synthesized AuNCs, leading to a decreased Φ and a larger FWHM. With this assumption, it explains why the AuNCs sample was synthesized upon microwave power of 10 W and irradiation time of 5 min, showing the lowest Φ of 2.4% and the highest FWHM of 82 nm. After a comparison between these AuNCs samples, the one synthesized upon microwave power of 5 W and irradiation time of 2 min is chosen for the later experiment, owing to its highest Φ (17.1%) and limited FWHM (64 nm).
Figure 1. Emission spectra of Hcy-AuNCs prepared upon various microwave powers and irradiation times. The reference sample was a mixture of HAuCl4 and Hcy upon no microwave heating.
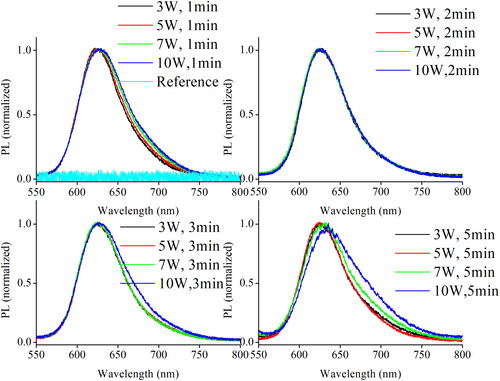
Table 1. Summarized photophysical parameters of AuNCs synthesized under various microwave powders and irradiation time.
3.2. Characterization of the as-synthesized AuNCs (5 W/2 min)
3.2.1. XPS and TEM
Aiming at a fast identification on the as-synthesized AuNCs sample (5 W/2 min), its XPS curve is firstly determined and shown in . Two well-resolved XPS peaks of 83.9 eV and 87.6 eV are observed, which have been assigned as Au 4f7/2 and Au 4f5/2 peaks [Citation32, Citation33]. These Au 4f7/2 and Au 4f5/2 peaks are consistent with the oxidation state of metallic Au(0), confirming the successful synthesis of AuNCs. The ΔBE value between Au 4f7/2 and Au 4f5/2 peaks is as high as 3.7 eV, indicating that corresponding AuNCs have been encapsulated and thus stabilized by Hcy [Citation33]. According to a literature report, the XPS values of Au 4f7/2 and Au 4f5/2 peaks are related to the size of AuNCs [Citation34]. This is because AuNCs are composed of two kinds of Au atoms, which are inner ones and surface ones. Upon decreasing the core size of AuNCs, the Au 4f7/2 peak of inner Au atoms shall be increased from 84.0 to 84.3 eV. On the other hand, the Au 4f7/2 peak of surface Au atoms (84.3–84.7 eV) shall always be higher than that for inner Au atoms. Considering that the Au 4f7/2 peak is only 83.9 eV, it is appropriate to say that the Au atoms have been aggregated as nanoclusters, forming the desired AuNCs sample.
Figure 2. XPS spectrum (a) and TEM image (b) of the as-synthesized AuNCs sample (5 W/2 min).
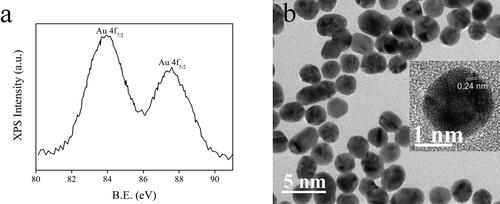
shows a visual presentation of the as-synthesized AuNCs sample (5 W/2 min). Uniform and isolated distribution is observed for these nanoclusters. Their average diameter is ∼2 nm. A lattice fringe of 0.24 nm is observed, which matches the lattice d spacing of metallic Au (111) [Citation35]. As a consequence, it is further confirmed that AuNCs have been successfully prepared.
3.2.2. Size distribution and IR spectra
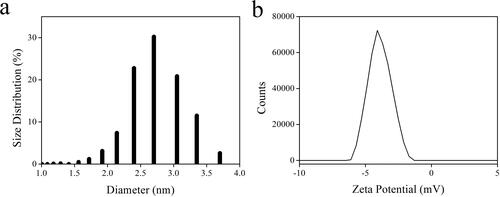
Dynamic light scattering (DLS) experiment was performed on the as-synthesized AuNCs sample (5 W/2 min) to get an evaluation of their size distribution. It is observed from that the as-synthesize AuNCs have a narrow size distribution of 2.4–3.0 nm, peaking at a dominant size distribution of 2.71 nm. These size values are found to be slightly wider than those obtained from the TEM image of AuNCs (∼2 nm). This is because the diameter AuNCs determined by the DLS method is their hydration radius. In this case, Hcy chains covering AuNCs widen particle size, showing a larger distribution value in the DLS result. The Zeta potential of the as-synthesized AuNCs sample (5 W/2 min) is determined as −4.08(±0.8) mV, which means that the AuNCs can be dispersed in an aqueous solution stably. The Zeta potential of the AuNCs sample (5 W/2 min) (–4.08 mV) is smaller than those of AuNCs reduced by strong reducing agents such as NaBH4 (∼–20 mV), which is attributed to the gentle reducer of Hcy [Citation36]. Combined with the above data on hand, it is finally confirmed that AuNCs have been successfully prepared.
Figure 3. DLS (a) and Zeta potential (b) of the as-synthesized AuNCs sample (5 W/2 min).
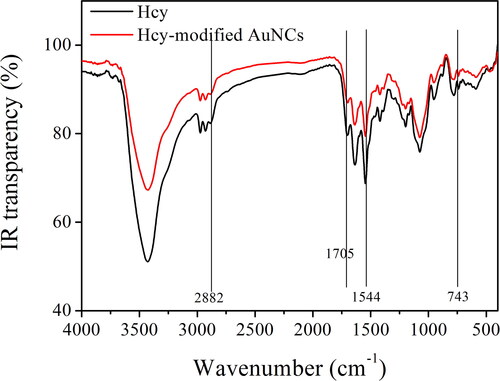
shows the IR spectra of Hcy and the as-synthesized AuNCs sample (5 W/2 min). As for Hcy, there are several characteristic bands, peaking at 743, 1544, 1705, and 2882 cm−1, respectively. The first weak IR band (743 cm−1) is attributed to the vibration of –NH2 wagging. The following IR band (1544 cm−1) is assigned as the absorption of primary amine scissoring. The third IR band (1705 cm−1) is attributed to the vibration of the amide I band, and the last IR band (2882 cm−1) is assigned as the vibration of C–H bonds in Hcy. These mentioned IR bands are all traced from the IR spectrum of the AuNCs sample (5 W/2 min). Only a minor spectral shift is observed, with no obvious spectral change. It is thus concluded that after being heated by microwave, the remaining Hcy molecules are still well preserved.
Figure 4. IR spectra of Hcy and the as-synthesized AuNCs sample (5 W/2 min).
3.3. Photophysical performance of as-synthesized AuNCs sample (5 W/2 min)
3.3.1. Absorption and excitation spectra
shows the absorption spectrum of the as-synthesized AuNCs sample (5 W/2 min). The obvious electronic absorption peaks are observed for the as-synthesized AuNCs sample (5 W/2 min), which is inconsistent with the simple absorption spectrum of AuNCs prepared by the traditional method [Citation36]. An intense absorption in the UV region is observed, peaking at 355 nm and extending to the visible region at ∼550 nm. A strong background noise (absorbance = 0.3) is observed for the absorption spectrum of the as-synthesized AuNCs sample (5 W/2 min), ranging from 600 to 800 nm. This observation is explained by the light-scattering phenomenon of nanoparticles. There is no strong absorption near 520 nm, which has been reported as the characteristic plasmon resonance absorption of Au nanoparticles [Citation37]. This result further confirms that the reduced Au atoms are aggregated as AuNCs instead of existing as Au nanoparticles.
Figure 5. Absorption, excitation, and emission spectra of the as-synthesized AuNCs sample (5 W/2 min).
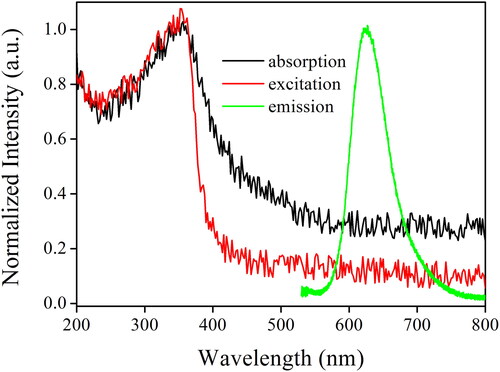
The recorded excitation spectrum of the as-synthesized AuNCs sample (5 W/2 min) shown in is found to be rather similar to its absorption spectrum, except that the light scattering interference for excitation spectrum is decreased. The excitation band peaking at 355 nm can be attributed to the intraband (sp to sp) transition within AuNCs, which has been cited as proof for the successful synthesis of AuNCs [Citation36]. According to the literature, such intraband transition and mixed interband (d to sp) transitions are highly fluorescent, showing strong and efficient emission. This point will be discussed and confirmed below.
3.3.2. Emission performance
As shown in , the optimal sample, AuNCs (5 W/2 min), shows a Gaussian-liked emission band peaking at 624 nm upon excitation of 355 nm, with an emission quantum yield of 17.1%, as mentioned in . Compared to literature reported AuNCs (Φ < 10%), the as-synthesized AuNCs sample (5 W/2 min) is found superior to them [Citation38]. Owing to the heterogeneous size distribution of AuNCs, as revealed by the DLS result mentioned earlier, a wide emission band is observed, with an FWHM value of 64 nm. Meanwhile, the observation of such a wide emission band identifies its nature as coming from the in-situ reduction of Au(III) to Au(0) instead of Hcy chains around AnNCs [Citation39]. A large Stoke’s shift of 269 nm between absorption peak (355 nm) and emission peak (624 nm) is observed, and this value is found similar to literature values of similar AuNCs (∼270 nm) [Citation36–39]. On the positive side, a large Stoke’s shift minimizes the excitation light interference on the sensing signal. On the other side, the wasted energy during the down-shifting process (Stoke) may be harmful to the stability of AuNCs. This issue will be further discussed below.
To get a better understanding on the emissive nature of AuNCs, their decay dynamics are monitored and shown in . The emission of the as-synthesized AuNCs sample (5 W/2 min) follows a typical biexponential decay pattern, with a mean lifetime (τ) of 277.5 ns. Detailed fitting parameters are listed in . It is observed that its emissive center is composed of a slow-decay component (τ1) with a lifetime of 522.2 ns and a fast-decay component (τ2) with a lifetime of 115.5 ns, respectively. Such observation matches the reported emission nature of LMNCT [Citation40]. It has been suggested that the slow-decay component (τ1) should be the emissive transition of LMNCT, while the fast-decay one (τ2) should be the direct transition of AuNCs (sp to sp or d to sp). With the help of emission quantum yield (Φ = 17.1%) and mean lifetime (τ = 277.5 ns), radiative and nonradiative probabilities (kr and knr) are determined by Formula 1 and Formula 2 and listed in . The kr value is observed as high as 6.16 × 10⁵ s−1, which falls in the region of a spin-allowed transition. Thus, the LMNCT-based emission from the as-synthesized AuNCs sample (5 W/2 min) is confirmed.
(1)
(1)
(2)
(2)
(3)
(3)
Figure 6. Emission decay dynamics curves (a) of the as-synthesized AuNCs sample (5 W/2 min) without and with Cu(II) (100 μM). Emission spectra (b) of the as-synthesized AuNCs sample (5 W/2 min) upon increasing Cu(II) concentrations from 0 to 130 μM.
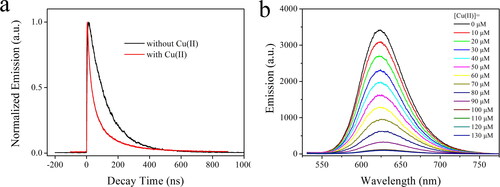
Table 2. Biexponential emissive decay parameters of the AuNCs (5 W/2 min).
Using the Jellium model described by Formula 3, the amount of Au atoms in the as-synthesized AuNCs sample (5 W/2 min) is calculated as 29, and these Au atoms are consistent with the diameter of 2 nm observed by their TEM image shown in . In Formula 3, ν means the frequency of emission/excitation light, Ef denotes Fermi energy, N means the number of atoms in the nanocluster, R is the diameter of this nanocluster, and rs stands for the Wigner-Seitz radius, respectively.
3.4. Sensing performance of the as-synthesized AuNCs (5 W/2 min) towards Cu(II)
3.4.1. Emission spectra
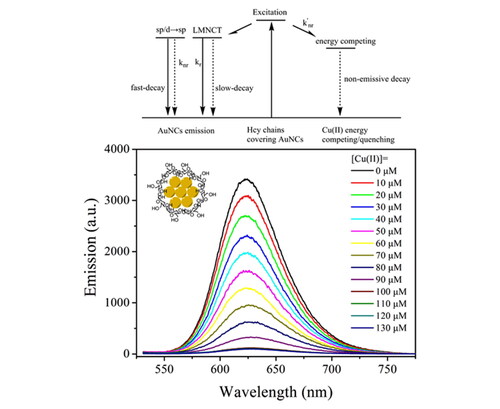
In our earlier discussion, the excitation mechanism of the as-synthesized AuNCs (5 W/2 min) has been revealed as LMNCT. In this case, the outer ligand (Hcy chains) harvests energy for the inner nanoparticle core (AuNCs). Upon efficient energy quenching on the ligand, its energy transfer to the inner nanoparticle core shall be decreased or even completely shut down, which leads to the emission quenching behavior of AuNCs. Bearing this assumption in mind, a series of metal cations were explored as energy acceptors, where Cu(II) shows the most obvious quenching effect. The emission spectra of the as-synthesized AuNCs (5 W/2 min) against increasing Cu(II) concentrations from 0 to 130 μM are shown in . An emission quenching effect is observed with increasing Cu(II) concentrations. When Cu(II) concentration is as high as 100 μM, the corresponding emission quantum yield is decreased to 0.6%. The band shape, however, is well preserved, with a slight emission redshift from 624 to 627 nm. This observation suggests a weak interaction between the emissive center (AuNCs) and the energy acceptor (Cu(II) ion). In this case, it is assumed that the as-synthesized AuNCs (5 W/2 min) follow a static quenching mechanism towards Cu(II) ion via its energy quenching on the LMNCT procedure. This hypothesis will be discussed below in detail.
3.4.2. Sensing mechanism
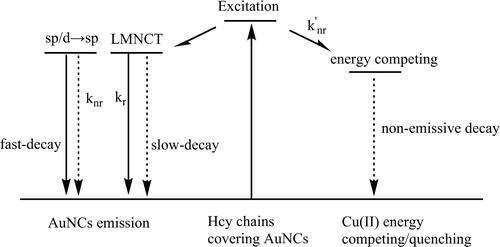
Our above discussion has suggested a static quenching mechanism towards Cu(II) ion via its energy quenching on the LMNCT procedure. To confirm this hypothesis, the emissive decay dynamics of the as-synthesized AuNCs (5 W/2 min) are recorded in the presence of Cu(II) (100 μM) and compared to those without Cu(II). It is observed from that AuNCs emission lifetime is obviously quenched by Cu(II), with mean lifetime decreased to 99.3 ns. The bi-exponential decay pattern, however, has been well preserved, as listed in . Both the slow-decay component (τ1=127.3 ns) and fast-decay component (τ2=24.4 ns) have been quenched obviously, compared to those in the absence of Cu(II) (τ1 = 522.2 ns and τ2 = 115.5 ns). As previously reported, the slow-decay component is attributed to LMNCT, while the fast-decay one is assigned as a direct transition of Au sp to sp or d to sp. Meanwhile, the calculated kr and knr values in the presence of Cu(II) are found to be 10-fold higher than those in the absence of Cu(II), as shown in . As a consequence, it is assumed that these two decay components are both quenched by Cu(II) via an energy-competing procedure. A schematic presentation for a proposed sensing mechanism is given as Scheme 2. Here, Cu(II) ions serve as an energy acceptor that quenches Hcy energy and thus compromises its LMNCT procedure to the AuNCs. With this energy-competing procedure, the AuNCs emission shows quenching behavior towards Cu(II). In addition, such a static quenching mechanism exerts no direct on the emissive center (AuNCs LMNCT/sp to sp or d to sp). This explains why the AuNCs emission band shape has been well preserved. The observed minor emission redshift at high Cu(II) concentration (>100 μM) can be explained by the static electric effect of Cu(II).
Scheme 2. A possible sensing/energy competing mechanism of Hcy-AuNCs towards Cu(II).
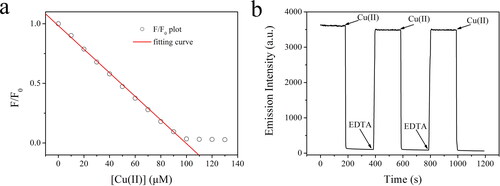
After analyzing the sensing mechanism shown in Scheme 2, it is observed that AuNCs emission is quenched by the compromised energy transfer from Hcy chains, with the emissive AuNCs preserved. It is thus assumed that the quenched AuNCs emission can be recovered if the energy acceptor that quenches the LMNCT procedure is removed. To confirm this assumption, the emission intensity (at 624 nm) of the as-synthesized AuNCs (5 W/2 min) is continuously monitored when Cu(II) and EDTA are periodically added. As shown in , AuNCs emission is efficiently quenched by adding Cu(II) and then remains at a low level. By adding a chelating reagent EDTA for Cu(II), AuNCs emission is instantly recovered and preserved. By adding more Cu(II) and EDTA, similar emission quenching and recovery can be observed. This observation suggests that the emission quenching of AuNCs caused by Cu(II) is actually caused by the Cu(II) quenching on the LMNCT procedure to AuNCs instead of directly quenching AuNCs. In the meanwhile, the proposed sensing mechanism shown in Scheme 2 is tentatively confirmed. After three Cu(II)/EDTA cycles, 95% emission recovery was observed, which indicates the good stability of AuNCs emission. On the other hand, this observation does not mean a reusage of AuNCs because the collection and recovery of AuNCs were not convenient, which might increase sensing errors.
Figure 7. Stern–Volmer equation (a) of the as-synthesized AuNCs sample (5 W/2 min) upon increasing Cu(II) concentrations from 0 to 130 μM fitted with Formula 4. Emission intensity monitoring of the as-synthesized AuNCs sample (5 W/2 min) when Cu(II) and EDTA are periodically added.
3.4.3. Stern–Volmer calibration curve
The above analysis of AuNCs sensing mechanism has proposed a static one. In this case, AuNCs emission variation against increasing Cu(II) concentrations can be analyzed using Stern–Volmer method. When a probe follows a static quenching mechanism, its emission intensity form of Stern–Volmer equation should be given as Formula 4. Here, F denotes emission intensity, F0 means the emission intensity in the absence of quencher, C is a constant, Ksv is Stern–Volmer constant, and [Cu(II)] means Cu(II) concentration, respectively.
(4)
(4)
As shown in /F0 plots follow a linear decreasing curve within [Cu(II)] ranging from 0 to 100 μM, with working calibration of F/F0=0.9840 – 0.00989 × [Cu(II)], R2 = 0.9986. As shown in , the red straight line covers the [Cu(II)] region of 0–100 μM. Upon higher Cu(II) concentrations (100–130 μM), no obvious emission quenching was observed, and F/F0 showed nearly constant values around 0.03. This observation suggests that AuNCs have been completely quenched when [Cu(II)] is as high as 100 μM, indicating the end of the sensing/quenching procedure. As a consequence, the working region is found as 0–100 μM, and the limit of detection (LOD) is determined as 3.2 μM following a literature method (3σ/N). These performance parameters are comparable to literature values of AuNCs systems [Citation26, Citation27].
3.4.4. Selectivity
Although the above analysis has confirmed a promising sensing performance of the as-synthesized AuNCs (5 W/2 min) towards Cu(II), there is still another issue to be checked. For nearly all emission quenching-based sensing systems, there is a question about signal reliability since some competing species or emission killers may quench probe emission and give fake signals. As a consequence, by adding some common ions (100 μM), including both metal cations and anions, into AuNCs sample, its sensing selectivity is explored. Corresponding F/F0 values are shown in . It is observed that F/F0 value is slightly increased by anions, including AcO-, PO4–, SO4–, NO3–, Cl–, Br–, and I–, especially for AcO–. As above mentioned, the Zeta potential of the as-synthesized AuNCs (5 W/2 min) is −4.08(±0.8) mV. As a consequence, these anions can stabilize the Hcy-modified AuNCs, showing higher emission intensity and F/F0 values higher than 1.0. On the contrary, all metal cations exert a quenching effect on AuNCs emission, especially those with higher charges such as Al3+, Fe3+, Fe2+, and Hg2+. These metal cations are supposed to have a strong electrostatic attraction with the Hcy-modified AuNCs, which compromises or even quenches the LMNCT procedure to the emissive AuNCs, showing decreased emission intensity. Their quenching effect on AuNCs emission, however, is not as effective as Cu(II) quenching effect (0.86 for Fe3+ vs. 0.03 for Cu2+). This is because there is a strong affinity between Hcy (–SH group) and Cu2+, while the other metal cations fail to construct a strong electrostatic attraction with Hcy chains. As a consequence, a good sensing selectivity of Hcy-modified AuNCs towards Cu(II) is observed and confirmed. A sensing performance comparison between Hcy-modified AuNCs and literature sensing systems is performed and shown in . The selected key sensing factors of Hcy-modified AuNCs are comparable to or even better than those of literature sensing systems. The primary advantage of Hcy-modified AuNCs is the easy and quick synthetic procedure, along with acceptable sensing performance. Even with an emission-quenching based sensing behavior, a good selectivity is still guaranteed.
Figure 8. F/F0 ratios of the as-synthesized AuNCs sample (5 W/2 min) upon competing ions (100 μM). 1 = blank, 2 = Cu2+, 3 = AcO–, 4 = PO4–, 5 = SO4–, 6 = NO3–, 7 = Cl–, 8 = Br–, 9 = I–, 10 = Na+, 11 = Mg2+, 12 = Ca2+, 13 = Zn2+, 14 = Cd2+, 15 = Co2+, 16 = Al3+, 17 = Fe3+, 18 = Fe2+, and 19 = Hg2+.
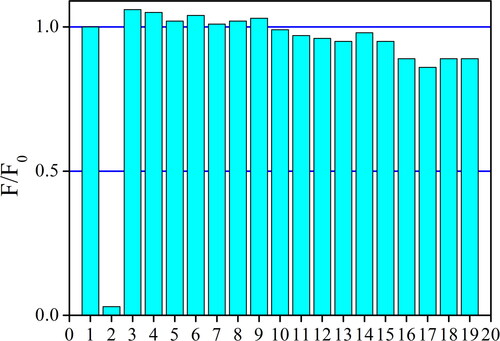
Table 3. Sensing performance comparison between Hcy-modified AuNCs and literature sensing systems.
The sensing stability of Hcy-modified AuNCs is evaluated by its sensing errors and recovery, as shown in . Within the effective working region, good recovery (>96%) and low deviation (≤1.2 μM) are observed. When Cu2+ concentration is out of the effective working region, errors and deviation increase.
Table 4. Sensing repeatability of Hcy-modified AuNCs.
4. Conclusions
AuNCs with a mean diameter of ∼2 nm were prepared by a microwave-assisted method, using homocysteine (Hcy) as a reducer and stabilizer. The as-synthesized AuNCs, denoted as Hcy-AuNCs, were discussed in terms of TEM, XPS, DLS, and IR to reveal their composition. Their photophysical performance was discussed, including absorption and emission spectra, emission quantum yield, and lifetime, along with corresponding sensing performance for Cu(II) ion. The optimal sample (microwave power = 5 W and irradiation time = 2 min) showed a red emission peaking at 624 nm with an emission quantum yield of 17.1%, which was assigned as a LMNCT. This red emission was effectively quenched by Cu(II) but immune to competing metal cations and anions, showing good selectivity. A linear calibration curve was fitted as F/F0 = 0.9840 – 0.00989 × [Cu(II)] with a LOD of 3.2 μM within working region of 0–100 μM. The quenching mechanism was found as the Cu(II) quenching on LMNCT procedure to AuNCs. The primary advantage of Hcy-modified AuNCs was the easy and quick synthetic procedure, along with acceptable sensing performance, including good selectivity, linear response, and wide working region. On the other hand, there is still room for sensitivity and sensitivity to improve.
Author contributions
Conceptualization, K.S; methodology, X.W.; investigation, Y.D. and Y.X.; data curation, Y.X., P.L., and T.L.; writing—original draft preparation, Y.S.; writing—review and editing, K.S. All authors have read and agreed to the published version of the manuscript.
Institutional review board Statement
Not applicable.
Informed consent statement
Not applicable.
Acknowledgments
We acknowledge the support of the Natural Science Foundation of Jilin Province (YDZJ202101ZYTS092).
Conflicts of interest
The authors declare no conflict of interest.
Data availability statement
Data are available upon reasonable request from the corresponding authors.
Additional information
Notes on contributors
Yong Shen
Yong Shen is a lecturer at the School of Life Sciences, Changchun Normal University. His research area focuses on bio-fluorescence detection.
Xin Wang
Xin Wang is currently a junior undergraduate student in the School of Life Sciences at Changchun Normal University. Her research interest lies in biotechnology.
Yunfei Xia
Yunfei Xia is a second-year master's student at the School of Life Sciences, Changchun Normal University. Her research domain is the synthesis of luminescent nanomaterials.
Ping Li
Ping Li is a second-year master's student in the School of Life Sciences at Changchun Normal University. Her area of research concentrates on nano-biotechnology.
Yinan Ding
Yinan Ding holds the position of Senior Lab Technician in the School of Life Sciences at Changchun Normal University. Her primary research pertains to bio-analysis.
Tian Luan
Tian Luan serves as a Senior Lab Technician in the School of Life Sciences at Changchun Normal University. His main research endeavor is in the field of detection biotechnology.
Kai Song
Kai Song is a professor at the School of Life Sciences, Changchun Normal University. His research specialization is in nano-biotechnology.
References
- Nandi S, Parui S, Halder R, et al. Interaction of proteins with ionic liquid, alcohol and DMSO and in situ generation of gold nano-clusters in a cell[J]. Biophys Rev. 2018;10(3):757–768. doi: 10.1007/s12551-017-0331-1.
- Yanyan Z, Minghao W, Mingjie W, et al. Study of fluorescence and CT bimodal imaging of ultrasmall gold nanoclusters [J]. Acta Chim Sinica. 2018;76(9):709–714.
- Jiang X, Zhang H, Yang C, et al. A novel electrostatic drive strategy to prepare glutathione-capped gold nanoclusters embedded quaternized cellulose membranes fluorescent colorimetric sensor for Pb (II) and Hg (II) ions detection[J]. Sens Actuators, B. 2022; 368:132046. doi: 10.1016/j.snb.2022.132046.
- Wang X, Li L, Li L, et al. Tris (bipyridine) ruthenium (II)-functionalized metal–organic frameworks for the ratiometric fluorescence determination of aluminum ions[J]. Microchim Acta. 2022;189(11):1–10. doi: 10.1007/s00604-022-05504-1.
- Yuan M, Lian J, Han X, et al. Real-time fluorescence dynamics in one-step synthesis of gold nanoclusters coupling with peptide motifs[J]. Colloids Surf B Biointerfaces. 2022;219:112820. doi: 10.1016/j.colsurfb.2022.112820.
- Yang G, Wang Y, Li Y, et al. Synthesis of vitamin B1-Stabilized gold nanoclusters with high quantum yields for application as sensors[J]. ACS Appl Nano Mater. 2022;5(11):17234–17242. doi: 10.1021/acsanm.2c04289.
- Gurbatov S, Puzikov V, Modin E, et al. Ag-Decorated Si microspheres produced by laser ablation in liquid: all-in-one temperature-feedback SERS-based platform for nanosensing [J]. Materials. 2022;15(22):8091. doi: 10.3390/ma15228091.
- Anjali KG, Jibin KV, Aswathy PV, et al. An imidazole ligated zinc (II) transition metal complex as a “turn-off” fluorescent sensor for the selective and sensitive detection of brilliant blue FCF[J]. J Photochem Photobiol A. 2022;433:114134. doi: 10.1016/j.jphotochem.2022.114134.
- Wang HB, Tao BB, Wu NN, et al. Glutathione-stabilized copper nanoclusters mediated-inner filter effect for sensitive and selective determination of p-nitrophenol and alkaline phosphatase activity [J]. Spectrochim Acta A Mol Biomol Spectrosc. 2022;271:120948. doi: 10.1016/j.saa.2022.120948.
- Wang HB, Mao AL, Tao BB, et al. l-Histidine-DNA interaction: a strategy for the improvement of the fluorescence signal of poly(adenine) DNA-templated gold nanoclusters [J]. Mikrochim Acta. 2021;188(6):198. doi: 10.1007/s00604-021-04853-7.
- Guan L, Chen GZ, Croft AK, et al. Perspective—redox ionic liquid electrolytes for supercapattery [J]. J Electrochem Soc. 2022;169(3):030529. doi: 10.1149/1945-7111/ac5ba8.
- Wang HB, Tao BB, Mao AL, et al. Self-assembled copper nanoclusters structure-dependent fluorescent enhancement for sensitive determination of tetracyclines by the restriction intramolecular motion [J]. Sensors and Actuators: B Chemical. 2021;348:130729. doi: 10.1016/j.snb.2021.130729.
- Sadak O. One-pot scalable synthesis of rGO/AuNPs nanocomposite and its application in enzymatic glucose biosensor. Nanocomposites. 2021;7(1):44–52. doi: 10.1080/20550324.2021.1917837.
- Sbeah ZA, Adhikari R, Sorathiya V, et al. A review on metamaterial sensors based on active plasmonic materials. Plasmonics. 2023. doi: 10.1007/s11468-023-01904-y.
- Singh H, Thakur B, Bhardwaj SK, et al. Nanomaterial-based fluorescent biosensors for the detection of antibiotics in foodstuffs: a review. Food Chem. 2023;426:136657. doi: 10.1016/j.foodchem.2023.136657.
- Yau SH, Varnavski O, Goodson IT. An ultrafast look at Au nanoclusters. Acc Chem Res. 2013;46(7):1506–1516. doi: 10.1021/ar300280w.
- Huang CC, Yang Z, Lee KH, et al. Synthesis of highly fluorescent gold nanoparticles for sensing mercury (II). Angew Chem. 2007;119(36):6948–6952. doi: 10.1002/ange.200700803.
- Wu Z, Jin R. On the ligand’s role in the fluorescence of gold nanoclusters. Nano Lett. 2010;10(7):2568–2573. doi: 10.1021/nl101225f.
- Zhou W, Gao X, Liu D, et al. Gold nanoparticles for in vitro diagnostics. Chem Rev. 2015;115(19):10575–10636. doi: 10.1021/acs.chemrev.5b00100.
- Jin R, Zeng C, Zhou M, et al. Atomically precise colloidal metal nanoclusters and nanoparticles: fundamentals and opportunities. Chem Rev. 2016;116(18):10346–10413. doi: 10.1021/acs.chemrev.5b00703.
- Xie J, Zheng Y, Ying JY. Protein-directed synthesis of highly fluorescent gold nanoclusters. J Am Chem Soc. 2009;131(3):888–889. doi: 10.1021/ja806804u.
- Wen F, Dong Y, Feng L, et al. Horseradish peroxidase functionalized fluorescent gold nanoclusters for hydrogen peroxide sensing. Anal Chem. 2011;83(4):1193–1196. doi: 10.1021/ac1031447.
- Bilecka I, Niederberger M. Microwave chemistry for inorganic nanomaterials synthesis. Nanoscale. 2010;2(8):1358–1374. doi: 10.1039/b9nr00377k.
- Zhu YJ, Chen F. Microwave-assisted preparation of inorganic nanostructures in liquid phase. Chem Rev. 2014;114(12):6462–6555. doi: 10.1021/cr400366s.
- Dallinger D, Kappe CO. Microwave-assisted synthesis in water as solvent. Chem Rev. 2007;107(6):2563–2591. doi: 10.1021/cr0509410.
- Bühler G, Feldmann C. Microwave‐assisted synthesis of luminescent LaPO4: Ce, Tb nanocrystals in ionic liquids. Angew Chem Int Ed Engl. 2006;45(29):4864–4867. doi: 10.1002/anie.200600244.
- Hu X, Yu JC, Gong J, et al. Fe2O3 nanorings prepared by a microwave‐assisted hydrothermal process and their sensing properties. Adv Mater. 2007;19(17):2324–2329. α‐ doi: 10.1002/adma.200602176.
- Vargas-Hernandez C, Mariscal MM, Esparza R, et al. A synthesis route of gold nanoparticles without using a reducing agent. Appl Phys Lett. 2010;96(21):213115. doi: 10.1063/1.3442479.
- Yue Y, Liu TY, Li HW, et al. Microwave-assisted synthesis of BSA-protected small gold nanoclusters and their fluorescence-enhanced sensing of silver (I) ions. Nanoscale. 2012;4(7):2251–2254. doi: 10.1039/c2nr12056a.
- Yan L, Cai Y, Zheng B, et al. Microwave-assisted synthesis of BSA-stabilized and HSA-protected gold nanoclusters with red emission. J Mater Chem. 2012;22(3):1000–1005. doi: 10.1039/C1JM13457D.
- Zhuang H, Jiang X, Wu S, et al. A novel polypeptide-modified fluorescent gold nanoclusters for copper ion detection. Sci Rep. 2022;12(1):6624. doi: 10.1038/s41598-022-10500-9.
- He DF, Xiang Y, Wang X, et al. Microwave-heating synthesis and sensing applications of bright gold nanoclusters. Mater Res Bull. 2011;46(12):2418–2421. doi: 10.1016/j.materresbull.2011.08.048.
- Betzig E. Single molecules, cells, and super‐resolution optics (nobel lecture). Angew Chem Int Ed Engl. 2015;54(28):8034–8053. doi: 10.1002/anie.201501003.
- Tanaka A, Takeda Y, Nagasawa T, et al. Chemical states of dodecanethiolate-passivated Au nanoparticles: synchrotron-radiation photoelectron spectroscopy. Solid State Commun. 2003;126(4):191–196. doi: 10.1016/S0038-1098(03)00105-4.
- Buffat PA, Flüeli M, Spycher R, et al. Crystallographic structure of small gold particles studied by high-resolution electron microscopy. Faraday Discuss. 1991;92:173–187. doi: 10.1039/FD9919200173.
- Shang L, Yang L, Stockmar F, et al. Microwave-assisted rapid synthesis of luminescent gold nanoclusters for sensing Hg 2+ in living cells using fluorescence imaging. Nanoscale. 2012;4(14):4155–4160. doi: 10.1039/c2nr30219e.
- Helmbrecht C, Lützenkirchen-Hecht D, Frank W. Microwave-assisted synthesis of water-soluble, fluorescent gold nanoclusters capped with small organic molecules and a revealing fluorescence and X-ray absorption study. Nanoscale. 2015;7(11):4978–4983. doi: 10.1039/c4nr07051h.
- Zhang Y, Jiang H, Ge W, et al. Cytidine-directed rapid synthesis of water-soluble and highly yellow fluorescent bimetallic AuAg nanoclusters. Langmuir. 2014;30(36):10910–10917. doi: 10.1021/la5028702.
- Xie J, Lee JY, Wang DIC, et al. Silver nanoplates: from biological to biomimetic synthesis. ACS Nano. 2007;1(5):429–439. doi: 10.1021/nn7000883.
- Chang HY, Chang HT, Hung YL, et al. Ligand effect on the luminescence of gold nanodots and its application for detection of total mercury ions in biological samples. RSC Adv. 2013;3(14):4588–4597. doi: 10.1039/c3ra23036h.