?Mathematical formulae have been encoded as MathML and are displayed in this HTML version using MathJax in order to improve their display. Uncheck the box to turn MathJax off. This feature requires Javascript. Click on a formula to zoom.
Abstract
Clay platelets/cellulose nanofibril nanocomposites are recyclable engineering materials of interest for sustainable development. There is substantial experimental data for mechanical properties, but modeling efforts are scarce. Here, a conceptual unit cell with voids was used in finite element modeling. Predictions for the in-plane modulus taking voids into account were more accurate than the classical rule of mixtures. Simulations also reveal that the cellulosic matrix undergoes shear and tensile deformation with inclined fracture located near the end of platelets for low clay content while predicting brittle tensile failure for high clay content. The results from the unit cell approach provide improved understanding of experimental observations, supporting the strive to better understand mechanisms of deformation and fracture.
Graphical Abstract
1. Introduction
Cellulose nanocomposites from cellulose nanofibrils (CNF) are of interest for sustainable development as they are from renewable resources and have good mechanical properties [Citation1]. Unlike synthetic thermoset composites, cellulosic composites may show advantages for recycling and biodegradation in line with the immediate need for sustainable solutions [Citation2]. Also, the in-plane modulus for CNF as a matrix is much higher than for an isotropic polymer. Transparent nacre-inspired nanocomposites are of particular interest. Such composites are normally thin films. CNF nanofibrils are mixed with clay platelets in water and filtered and dried. Capillary effects and strong physical interparticle interactions lead to the formation of a fairly dense and uniform CNF matrix with, e.g. montmorillonite (MTM) natural clay as a nanoscale reinforcement phase [Citation3]. The MTM inclusions have platelet shape with a ‘diameter’ of roughly 100–400 nm and height of 1–15 nm (depending on agglomeration tendency). Platelets often show high in-plane orientation. This class of nanocomposites can show a brick-and-mortar microstructure at high clay content [Citation4], and stiffness and strength can be tailored. Interfaces between the constituents are often weak as there are no primary chemical bonds; the only interactions are of secondary nature (hydrogen bonds, van der Waals interactions etc.). In composites, weak interfaces promote higher strain-to-failure and improved toughness as cracks propagate through the weak interfaces, and the overall toughness of high inorganic content composites is relatively high [Citation5, Citation6].
The stiffness-strength-toughness balance of such composites is fundamentally important [Citation7]. Modeling at multiple length-scales is interesting for nanocomposites, which can be atomistic [Citation8, Citation9] or continuum mechanics [Citation10, Citation11]. Here, we limit our discussion to the continuum-based approach and compare results to experimental test data of macroscopic properties (e.g. mechanical properties measured from tensile testing), which is suitable for materials design purposes. Composite modulus and strength for materials with in-plane oriented platelet reinforcements have been targeted for nacre-like composites [Citation12–15]. For the in-plane composite modulus, Christensen [Citation16], proposed a model with perfect platelet-matrix adhesion, which is a variant of the classical rule of mixtures. Also, shear-lag-based models were extensively explored [Citation17–19]. The shear-lag models were also extended to predict the composite strength by considering interfacial failure controlled by the interfacial shear strength. However, all mentioned models are one-dimensional simplifications, and lack accurate details because the composite geometry leads to a very complex stress state.
Finite element (FE) simulations associated with a two- or three-dimensional unit cell (composite geometry) provide more detailed predictions. Gao and co-workers [Citation20, Citation21] did FE simulations for biological nacre with protein matrix and calcium carbonate platelets and studied the effect of nano-inclusions on effective properties. Kim et al. [Citation22] explored computational homogenization, using an FE-based model [Citation10], to study printed platelet-staggered samples to validate analytical modeling and obtained good agreement with experimental measurements. For biocomposites, a complex three-dimensional unit cell generated from X-ray microcomputed tomography data was coupled to computational homogenization where elastic composite properties were well predicted [Citation23]. All simulations essentially used the FE method (discretizing the geometry, solving the governing equations with boundary conditions by numerical integration), but what is specific is the unit cell. The proper composite geometry could also predict composite strength using FE damage models [Citation24–26].
A unit cell is needed for CNF/MTM nanocomposites and the current ones for nacre composites do not account for porosity. Neat CNF films have some porosity [Citation27] and in CNF/MTM the high MTM content compositions have significant nanoporosity [Citation28, Citation29] since platelets in tactiods (stacks of MTM platelets) will have different lengths with irregular platelet edges. The discrepancy between modulus predictions from classical micromechanics (e.g. the rule of mixtures) based on no voids and experimental data is noticeable [Citation28, Citation29].
Here, a representative two-dimensional unit cell with voids (void content experimentally verified) is proposed, to address the problem of lower mechanical property data, such as elastic modulus and strain-to-failure, for nanocomposites with high MTM content. The new porous unit cell was used in the FE framework to predict in-plane composite modulus, whose values were compared to the rule-of-mixture (no porosity) commonly used for the studied nanocomposites. Similarly, the composite strength was evaluated with the FE method, but using the phase-field damage model to promote matrix rupture in order to evaluate the strain-to-failure. Predictions are compared with experimental data for two material systems: CNF matrix with MTM platelets by Medina et al. [Citation29] and TEMPO-oxidized cellulose nanofiber (TOCN) matrix with well-dispersed MTM platelets by Li et al. [Citation30]. Pore content was characterized in both studies.
2. Material and methods
2.1. Micromechanical model geometry
The idealized material microstructure contains in-plane oriented MTM platelets in a homogeneous matrix representing random-in-the-plane cellulose nanofibers (CNF) fused into a continuous phase. (from ref. [Citation30]) shows a nanostructural TEM micrograph of a cross-section of CNF/MTM with 10 vol% of MTM. In the context of polymer matrix nanocomposites, the micrograph confirms a comparably homogeneous platelet distribution.
Figure 1. Transmission electron microscopy image from the cross-section of a nanocomposite of CNF matrix with a volume fraction of 10% MTM platelets (Image by Dr. Ogawa, CERMAV, Grenoble).
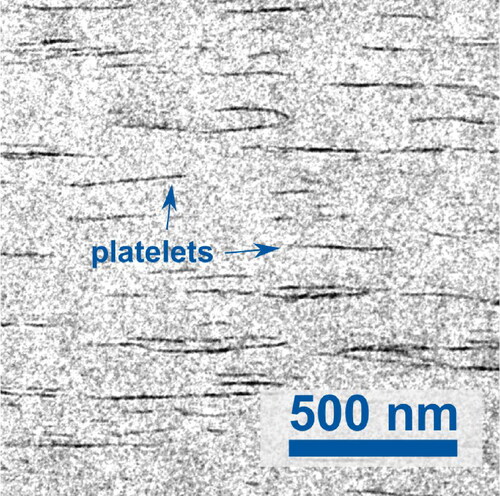
For the composition in , porosity was estimated from nanocomposite density and found to be less than 5%. Since porosity increases with MTM volume fraction, voids are related to MTM edges and agglomerated stacks of MTM (cf. Ref. [Citation30]). This hypothesis is supported by the fact that horizontal platelets in have different lengths and are longer than expected. An agglomerated stack of several 1 nm thick MTM platelets will then have a ‘jagged’ edge with nanoscale pores in between.
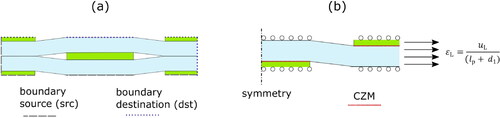
The idealized two-dimensional geometry of clay in the present micromechanical composite model is depicted in . The voids are positioned at the ends of the platelets. The blue dashed line indicates the representative unit cell of the composite. The small 1–2 coordinate systems represent the projection of the CNF matrix as if the 1-axis were properties along the nanofiber bundles and the 2-axis were transverse. Using the dimension of the unit cell, the volume fraction of the platelets VFp can be determined as
(1)
(1)
where
is the thickness of the platelet,
is the length of the platelet,
is half of the thickness of matrix sections between the overlapped platelets, and
is the horizontal distance between the platelets. EquationEquation (1)
(1)
(1) accounts for the aspect ratio of the platelet
as well. In the same fashion, porosity
(2)
(2)
can also be expressed in terms of the dimensions in .
Figure 2. Illustration of the geometry of the composite with its dimensions.
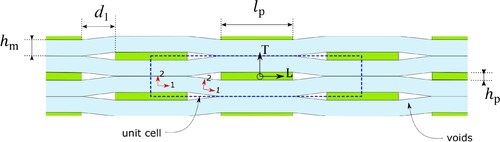
The geometry allows studying the effects from volume fraction of the platelet, the aspect ratio of the platelet and porosity on composite modulus. To reduce complexity, limitations related to imperfect interfaces between CNF and MTM platelets are not considered here although they would influence results in real materials.
2.2. Composite modulus: computational homogenization
For computational homogenization, the model is based on small deformations and the platelet-matrix and platelet-platelet bonds are assumed to be perfect. The composite stress
(3)
(3)
is calculated as the average stress in the volume of unit cell
The localization problem is given as follows:
(4a)
(4a)
with the constitutive law as
(4b)
(4b)
where
is the heterogeneous elasticity tensor as a function of the space variable
in microscopic scale. EquationEquation (4)
(4a)
(4a) was resolved via the finite element method with Comsol Multiphysics solver along with the displacement continuity (periodic boundary conditions) [Citation10]
(5)
(5)
In Comsol Multiphysics, this is implemented using Boundary Pair subnode to the outer boundaries of the unit cell. The boundaries source (src) and destination (dst) are shown in . The composite strain was prescribed throughout the unit cell in EquationEq. (5)
(5)
(5) . In this study, the main interest in the composite modulus in the longitudinal direction
and therefore the need in
is only for composite strain component
The unit cell was discretized into small quadrilateral elements with quadratic interpolation functions. Both material components in the composite are considered linear elastic. The platelets are assumed to be orthotropic with elastic modulus in the longitudinal direction of 139 GPa, elastic modulus in the transverse direction of 174 GPa, and a Poisson’s ratio of 0.34 [Citation31]. For the CNF matrix, the in-plane properties of the homogeneous matrix based on neat CNF film data are
= 15–17 GPa [Citation29, Citation30] and
[Citation32], and the out-of-plane properties perpendicular to the fibrils are estimated as
[Citation33]. The shear modulus
is 2.5 GPa [Citation34]. Once computed from EquationEqs. (3)
(3)
(3) , (4), and Equation(5)
(5)
(5) , the composite modulus in the longitudinal direction (horizontal, in-plane) is estimated by dividing the average stress in the unit cell by the constant composite strain
From classical micromechanics, the composite modulus in the longitudinal direction can be estimated by the rule of mixtures as [Citation16]
(6)
(6)
where E is the elastic modulus, VF is the volume fraction and the subscripts p and m stand for platelet and matrix, respectively.
Figure 3. Geometry and boundary conditions for the modeling: (a) boundary source and destination for in-plane modulus study and (b) ¼ of the unit cell to estimate the composite strength based on cellulose matrix tensile fracture assumption.
2.3. Composite strength: phase-field damage and cohesive zone models
Strength criteria could be based on various failure mechanisms such as fracture of platelets, interfacial sliding and rupture of the matrix. Here, we account for interfacial sliding and assume that the composite fracture takes place when the matrix ruptures; if platelet fracture was the critical failure, composite strength would be much higher than experimental data. We investigate how two models integrated into the finite element framework can provide guidance when using the proposed unity cell. One way to study the contribution of the weak interface and pull-out mechanisms simultaneously is to numerically promote the matrix fracture by the phase field damage model in combination with cohesive zones at the interfaces for platelet sliding [Citation24, Citation25]. The phase field damage model is a powerful tool to predict damage initiation and propagation in the matrix of which its variational form contains the fracture energy and a damage variable, which degrades the strain energy density [Citation35]. Cohesive zone models (CZM) are well-established techniques that also describe crack initiation and propagation assuming traction forces in front of the crack tip. In a practical way, however, it is normally used along predefined boundaries instead. In composite material analysis, CZM are commonly used to model delamination mechanisms at interfaces.
Here, the nanofibril matrices are ductile by nanofibril network deformation mechanisms [Citation36]. For this work, an elastic-plastic version of the phase field model was chosen (see detail in Appendix A) to account for plasticity before fracture. The platelet properties are the same as in previous simulations and it is assumed that the strength of the platelet is always higher than platelet stress. For the composite strength, the geometry is simplified as one-fourth of the unit cell as shown in . Rollers are applied on top and bottom to constrain the opening and promote interface sliding only. At the interface, a bilinear cohesive zone model (CZM) is then set [Citation24], where the shear strength and fracture toughness are the main inputs. The shear strength is defined as 30 MPa, determined in Appendix B, and the interfacial fracture toughness is 1 J/m2 predicted by in situ tests on MTM/cellulosic interfaces [Citation37]. The calculations were implemented in COMSOL Multiphysics following the model implementation in ref. [Citation38] and the variational form in [Citation39].
2.4. Previous experimental results
This section revisits previous experiments to determine the dimensions of the unit cell. Both Medina et al. [Citation29] and Li et al. [Citation30] prepared their nanocomposites by mixing CNF and MTM suspensions, filtering through a microporous membrane and drying the mixture to form a nanocomposite film. Li et al. [Citation30] improved sample preparation for better MTM dispersion and increased in-plane Young’s modulus. shows modulus as a function of MTM content for both materials. The moduli show a steady increase of up to ≈ 40 vol% of MTM content. Then, the modulus decreases with MTM content in Medina et al. [Citation29], whereas Li et al. [Citation30] report a stable modulus of ≈ 40 GPa also at higher MTM content. The drop in modulus in ref [Citation29] is linked to increased porosity at higher MTM content, see . In ref [Citation30], the MTM platelets show lower thickness, see (based on WAXD data), and this correlates with reduced porosity.
Figure 4. Experimental data: (a) in-plane composite modulus from tensile tests, (b) total nanocomposite porosity, (c) thickness of MTM platelets by Scherrer size from wide angle X-ray diffraction, data from Li et al. [Citation30], Medina et al. [Citation29].
![Figure 4. Experimental data: (a) in-plane composite modulus from tensile tests, (b) total nanocomposite porosity, (c) thickness of MTM platelets by Scherrer size from wide angle X-ray diffraction, data from Li et al. [Citation30], Medina et al. [Citation29].](/cms/asset/a67b202b-d84a-4ef2-96ae-bc7aa566780a/ynan_a_2268307_f0004_c.jpg)
Using the experimental data, the size of the unit cell can be determined as: (i) The lengths of the platelets measured by atomic force microscopy are = 100 nm for Medina et al. and
= 400 nm for Li et al. [Citation29, Citation30], (ii) thickness of the platelets
can be directly measured by Scherrer size from WAXD in , and (iii) the dimensions
and
are estimated from EquationEqs. (1)
(1)
(1) and Equation(2)
(2)
(2) supported by data in and the given MTM platelet volume fraction [Citation29, Citation30].
3. Results and discussion
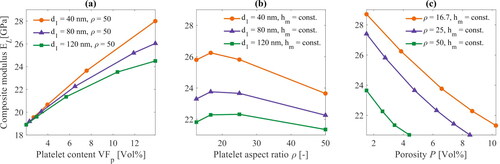
3.1. Composite modulus: the volume fraction, platelet aspect ratio and porosity
A parametric study was carried out varying
and
while keeping
= 200 nm to investigate effects of the volume fraction of the platelets, aspect ratio of the platelet, and porosity on the in-plane composite modulus. shows the computed
as a function of VFp for three configurations:
= 40, 80 and 120 nm with a constant MTM aspect ratio of 50. The voids have negligible influence on
at very low platelet content, but a significant divergence in the
predictions can be seen at VFp = 13 vol%. The
differ by 15% at VFp = 13 vol% by changing from small voids (
=40) to large voids (
=120). The predictions would diverge even more for higher platelet content. The
versus aspect ratio was also studied in three configurations:
= 40, 80 and 120 nm while
= 20 nm as shown in . In this case, porosity is driven in two ways, e.g. along with the platelet thickness in the abscissa, and through the three curves by
The same trend of low
for high porosity was found where the green curve (
= 120 nm) exhibited lower
than the other two. In addition, for all curves,
increases to aspect ratio
≈ 15, and then steadily drops until
= 50. This behaviour is due to the effect of platelet volume fraction via the parameter
on porosity via the parameter
The last graph in demonstrates how the porosity directly affects
for aspect ratios
= 16.7, 25 and 50 while
= 20 nm. Here, porosity was increased by varying
for all cases and the
decreases towards high porosity levels. The example illustrated in is not trivial to visualize because the VFp,
and P are simultaneously counteracting each other for
Interestingly, the example shows how to optimize a system when the size of the platelets is controlled (e.g. identifying the maximum value of
at
≈ 15), which fits the materials design purpose in this study. Coupling the proposed geometry with FE-based computational homogenization turns out to be a useful material design tool for optimization studies such as those carried out by Barthelat [Citation14], but adding porosity effects, as introduced in the unit cell.
Figure 5. Parametric study from the FE model showing how the composite modulus in the longitudinal direction is affected by the platelet volume fraction, platelet aspect ratio, and porosity. The length of the platelet is = 200 nm, while varying
and
in different configurations. Note the info on fixed quantities in each graph.
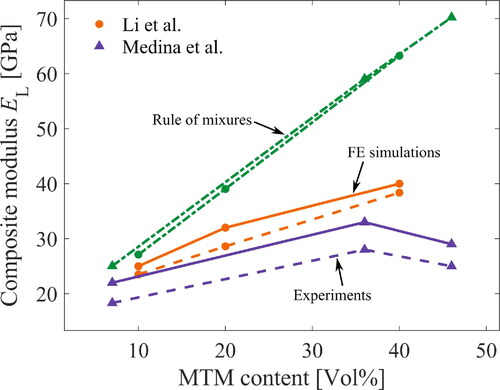
3.2. Composite modulus: case studies
To investigate whether the results are reasonable, a new set of simulations were performed where the geometric parameters of the unit cell – the dimensions
and
– were estimated from experiments [Citation29, Citation30]. The size of the nanoplatelets is known (
and
) from the Scherrer size and AFM measurements. The remaining quantities
and
are calculated by the EquationEqs. (1)
(1)
(1) and Equation(2)
(2)
(2) given that the Porosity and volume fraction of the platelets are also known. The parameters in the three sets of simulations for each material system were deliberately chosen to match the experimental modulus drops for Medina et al. [Citation29] while the modulus keeps increasing for Li et al. [Citation30]. The input values for all dimensions are tabulated in .
Table 1. Input values for geometrical microstructure parameters (see ) on which the predictions in and are based.
shows the predictions of versus VFp, where the same trend is found between simulations (solid line) and experiments (dashed line). The predictions are slightly higher than the experimental data, but the values are comparable. As seen in the experiments, the modulus decreases in Medina et al. and it correlates with increased platelet thickness from 3 to 5 nm. From the porous material modeling perspective, this lowers the stress in the platelets (c.f. shear lag assumptions, e.g. Jackson et al. [Citation17] and Kotha et al. [Citation18]) and the lower stress in the platelets obviously leads to lower composite modulus when computing EquationEq. (3)
(3)
(3) . The analysis is complex but the lower stress in platelets is primarily because of associated porosity, see . The aspect ratio (lp/hp) is also lowered, but this leads to a weaker effect. The other material system (Li et al. [Citation28]) has a lower aspect ratio of the platelets but a very low porosity, which provides a higher composite modulus than for Medina et al. [Citation29]. The modulus drop does not happen in the Li et al. TOCN/MTM system because the thickness of the platelets is constant (2.5 nm) for the three simulations. The graph also contains calculated values by the rule of mixtures from EquationEq. (6)
(6)
(6) (in green) for the sake of comparison. Interestingly, for low volume fraction, the rule of mixtures predicts the composite modulus well, but it deviates for high platelet content. The rule of mixtures does not account for aspect ratio and porosity effects, which are important in this problem as shown in ; High platelet content leads to relatively thick tactoids and large voids.
Figure 6. In-plane composite modulus predictions as well as experimental values for two CNF/MTM material systems. The solid lines are the FE simulations, which follow the same trend as the experiments (dashed lines). the rule of mixtures in green overestimates the modulus for high MTM content.
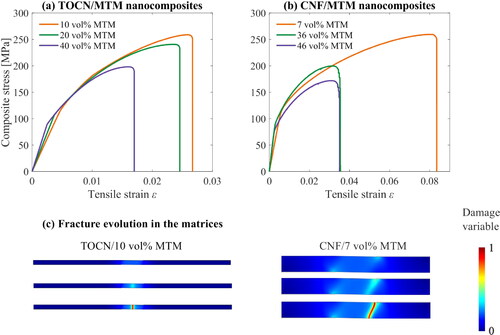
3.3. Composite strength and toughness: case studies
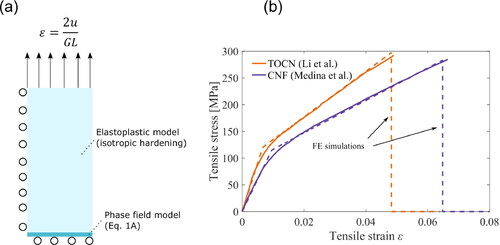
Here, six simulations for strength analysis were performed where the size of the unit cells are listed in . The predicted stress-strain curves shown in were plotted so that the composite stress was computed by EquationEq. (3)(3)
(3) and the tensile strain by applied displacement over half length of the unit cell. The simulations were executed until complete rupture of the matrices (i.e. when the phase field damage variable reached a unit value). The values of composite stress for the two nanocomposites are comparable to experimental observations in [Citation29, Citation30]. Strain-to-failure was decreased from matrix strain concentration effects as the MTM content was increased, in agreement with experimental observations [Citation29, Citation30]. shows fields of the damage evolution in the matrices from a few load steps to complete matrix rupture for TOCN/MTM and CNF/MTM nanocomposites with lower MTM content. The fields reveal where the fracture occurs as well as crack orientation. For the CNF/MTM nanocomposite with 7 vol% MTM, the matrix rupture occurs near the ends of the platelets and is inclined, which indicates shearing in the matrix before fracture. For CNF/MTM nanocomposites with 10 vol% MTM and all other remaining examples, the matrix rupture occurred in the middle matrix segment region connecting the two platelets (c.f. dimension
in ). The crack is straight and perpendicular to platelet orientation. Values of ‘matrix thickness’
15 nm result in matrix failure due to shearing and
10 nm result in matrix failure due to tension. Higher
also lead to higher strain-to-failure in the composites. Note that the CNF matrix is modeled as orthotropic elastic and isotropic plastic, allowing for matrix ductility.
Figure 7. Stress-strain curves (a–b) based on one-fourth of the unit cell and computed from the nanocomposite data in . The fields (c) illustrate the nature of matrix deformation and fracture during increased loading.
The dimension is related to the volume fraction of MTM. High values of
means low MTM content in nanocomposites. High
allows nanofibril sliding, which promotes global plasticity and high strain-to-failure for the nanocomposites [Citation36]. Lower
means high MTM content and higher local strain (and stress) in the CNF matrix at a given global composite strain. The strain to failure of the nanocomposite is thus reduced.
4. Concluding remarks
Modulus and stress-strain behavior of cellulose/clay (CNF/MTM) nanocomposites were modeled based on a two-dimensional unit cell with voids and imperfect cellulose/clay interfaces, in order to analyze reasons for lower nanocomposite mechanical properties found in previous publications. Predictions for in-plane modulus for these nacre-mimetic nanocomposites follow the experimental trend for nanocomposites with different MTM contents. Since nanocomposites have imperfect structures, classical micromechanical models without voids, such as the rule of mixtures, cannot provide good estimate values, especially for high MTM content.
Stress-strain curves of the nanocomposites with different MTM contents were also predicted based on imperfect cellulose/clay interfaces (CZM) and a damage development of the cellulose matrices (the phase-field damage model), including cellulose matrix plasticity and voids. Stress and strain levels were well predicted including the decreased strain to failure with increased clay content. Local strain concentration effects and damage development were magnified with increased clay content, and the nature and location of matrix and interface damage could be identified.
Recent experimental work on CNF/MTM nanocomposites has shown that the extent of MTM agglomeration (tactoid formation, stacking of platelets) can be very limited [Citation30], even at MTM content as high as 40 vol%. Yet modulus and strength are much lower than expected from micromechanics. The present investigation suggests that porosity, imperfect interfaces and strain concentration effects are important reasons. The CNF/MTM interface problem in particular needs further work, both in terms of materials design to improve nanocomposite properties but also modeling efforts based on nanostructure data. Since continuum mechanics models have limitations for nanocomposites, they need to be combined with other approaches, e.g. molecular dynamics analysis of interface problems.
Acknowledgements
The authors acknowledge financial support by Knut and Alice Wallenberg (KAW) foundation through the Wallenberg Wood Science Center. Discussions with Dr. Lengwan Li on his sample preparation and experimental results of MTM/TOCN nanocomposites are also acknowledged.
Disclosure statement
No potential conflict of interest was reported by the authors.
Additional information
Funding
Notes on contributors
Marcus Vinícius Tavares da Costa
Marcus Vinícius Tavares da Costa received a PhD degree in Engineering Physics with specialization in Applied Mechanics from Uppsala University, Sweden, in 2020. After, he was a postdoctoral researcher at Royal Institute of Technology (KTH) investigating the strength-toughness balance of novel cellulose nanocomposites by exploring microstructures, weak interfaces, anisotropy, and lamella thickness. He is currently an assistant professor at Karlstad University, Sweden.
Lars A. Berglund
Lars A. Berglund is a professor in Wood composites at Royal Institute of Technology (KTH). He has been a visiting researcher at Stanford University, Cornell University and Kyoto University. His research focus is environmentally friendly composites based on nanocellulose and wood. He has published more than 300 journal papers, obtained around 10 patents, examined more than 30 PhD’s and is a member of the Royal Swedish Academy of EngineeringSciences.He justfinished anERCAdvancedGrant project on wood nanotechnologies. He has more than 35,000 citations and an H-index of 93 at Google Scholar.
References
- Berglund LA, Peijs T. Cellulose biocomposites—from bulk moldings to nanostructured systems. MRS Bull. 2010;35(3):201–207. doi:10.1557/mrs2010.652.
- Montanari C, Olsén P, Berglund LA. Sustainable wood nanotechnologies for wood composites processed by in-situ polymerization. Front Chem. 2021;9(483):682883. doi:10.3389/fchem.2021.682883.
- Liu A, Walther A, Ikkala O, et al. Clay nanopaper with tough cellulose nanofiber matrix for fire retardancy and gas barrier functions. Biomacromolecules. 2011;12(3):633–641. doi:10.1021/bm101296z.
- Launey ME, Munch E, Alsem DH, et al. A novel biomimetic approach to the design of high-performance ceramic–metal composites. J R Soc Interface. 2010;7(46):741–753. doi:10.1098/rsif.2009.0331.
- Barthelat F. Architectured materials in engineering and biology: fabrication, structure, mechanics and performance. Int Mater Rev. 2015;60(8):413–430. doi:10.1179/1743280415Y.0000000008.
- Barthelat F, Yin Z, Buehler MJ. Structure and mechanics of interfaces in biological materials. Nat Rev Mater. 2016;1(4):16007. doi:10.1038/natrevmats.2016.7.
- Ritchie RO. The conflicts between strength and toughness. Nat Mater. 2011;10(11):817–822. doi:10.1038/nmat3115.
- Hou Y, Guan Q-F, Xia J, et al. Strengthening and toughening hierarchical nanocellulose via humidity-mediated interface. ACS Nano. 2021;15(1):1310–1320. doi:10.1021/acsnano.0c08574.
- Mathiazhagan S, Anup S. Influence of platelet aspect ratio on the mechanical behaviour of bio-inspired nanocomposites using molecular dynamics. J Mech Behav Biomed Mater. 2016;59:21–40. doi:10.1016/j.jmbbm.2015.12.008.
- Yvonnet J. Computational homogenization of heterogeneous materials with finite elements. Springer International Publishing; 2019.
- Hull D, Clyne TW. An introduction to composite materials. Cambridge University Press; 1996.
- Zhu L, Narh KA. Numerical simulation of the tensile modulus of nanoclay-filled polymer composites. J. Polym. Sci. B Polym. Phys. 2004;42(12):2391–2406. doi:10.1002/polb.20112.
- Boccaccini AR, Eifler D, Ondracek G. Determination of the young’s modulus of platelet reinforced composite materials. Materials Science and Engineering: a. 1996;207(2):228–233. doi:10.1016/0921-5093(95)10156-X.
- Barthelat F. Designing nacre-like materials for simultaneous stiffness, strength and toughness: optimum materials, composition, microstructure and size. J Mech Phys Solids. 2014;73:22–37. doi:10.1016/j.jmps.2014.08.008.
- Barthelat F, Rabiei R. Toughness amplification in natural composites. J Mech Phys Solids. 2011;59(4):829–840. doi:10.1016/j.jmps.2011.01.001.
- Christensen RM. Mechanics of composite materials. Newburyport: Dover Publications; 2012.
- Jackson AP, Vincent JFV, Turner RM. The mechanical design of nacre. Proc Roy Soc London B Biol Sci. 1988;234(1277):415–440.
- Kotha SP, Li Y, Guzelsu N. Micromechanical model of nacre tested in tension. J Mater Sci. 2001;36(8):2001–2007. doi:10.1023/A:1017526830874.
- Begley MR, Philips NR, Compton BG, et al. Micromechanical models to guide the development of synthetic ‘brick and mortar’ composites. J Mech Phys Solids. 2012;60(8):1545–1560. doi:10.1016/j.jmps.2012.03.002.
- Ji B, Gao H. Mechanical properties of nanostructure of biological materials. J Mech Phys Solids. 2004;52(9):1963–1990. doi:10.1016/j.jmps.2004.03.006.
- Gao H, Ji B, Jager IL, et al. Materials become insensitive to flaws at nanoscale: lessons from nature. Proc Natl Acad Sci U S A. 2003;100(10):5597–5600. doi:10.1073/pnas.0631609100.
- Kim Y, Kim Y, Lee T-I, et al. An extended analytic model for the elastic properties of platelet-staggered composites and its application to 3D printed structures. Compos Struct. 2018;189:27–36. doi:10.1016/j.compstruct.2018.01.038.
- Karakoç A, Miettinen A, Virkajӓrvi J, et al. Effective elastic properties of biocomposites using 3D computational homogenization and X-ray microcomputed tomography. Compos Struct. 2021;273:114302. doi:10.1016/j.compstruct.2021.114302.
- Singh A, Sandhu TS, Pal S. Interplay of various fracture mechanisms in bio-inspired staggered structure. Mech Mater. 2019;139:103215. doi:10.1016/j.mechmat.2019.103215.
- Tan W, Martínez-Pañeda E. Phase field predictions of microscopic fracture and R-curve behaviour of fibre-reinforced composites. Compos Sci Technol. 2021;202:108539. doi:10.1016/j.compscitech.2020.108539.
- Bui TQ, Hu X. A review of phase-field models, fundamentals and their applications to composite laminates. Eng Fract Mech. 2021;248:107705. doi:10.1016/j.engfracmech.2021.107705.
- Henriksson M, Berglund LA, Isaksson P, et al. Cellulose nanopaper structures of high toughness. Biomacromolecules. 2008;9(6):1579–1585. doi:10.1021/bm800038n.
- Mianehrow H, Lo Re G, Carosio F, et al. Strong reinforcement effects in 2D cellulose nanofibril–graphene oxide (CNF–GO) nanocomposites due to GO-induced CNF ordering. J Mater Chem A Mater. 2020;8(34):17608–17620. doi:10.1039/D0TA04406G.
- Medina L, Nishiyama Y, Daicho K, et al. Nanostructure and properties of nacre-inspired clay/cellulose nanocomposites—synchrotron X-ray scattering analysis. Macromolecules. 2019;52(8):3131–3140. doi:10.1021/acs.macromol.9b00333.
- Li L, Maddalena L, Nishiyama Y, et al. Recyclable nanocomposites of well-dispersed 2D layered silicates in cellulose nanofibril (CNF) matrix. Carbohydr Polym. 2022;279:119004. doi:10.1016/j.carbpol.2021.119004.
- Kuang L, Zhu Q, Shang X, et al. Molecular dynamics simulation of nanoscale elastic properties of hydrated Na-, Cs-, and Ca-montmorillonite. Appl Sci. 2022;12(2):678. doi:10.3390/app12020678.
- Nakamura KI, Wada M, Kuga S, et al. Poisson’s ratio of cellulose I? and cellulose II. J. Polym. Sci. B Polym. Phys. 2004;42(7):1206–1211. doi:10.1002/polb.10771.
- Song G, Lancelon-Pin C, Chen P, et al. Time-dependent elastic tensor of cellulose nanocrystal probed by hydrostatic pressure and uniaxial stretching. J Phys Chem Lett. 2021;12(15):3779–3785. doi:10.1021/acs.jpclett.1c00576.
- Molnár G, Rodney D, Martoïa F, et al. Cellulose crystals plastify by localized shear. Proc Natl Acad Sci U S A. 2018;115(28):7260–7265. doi:10.1073/pnas.1800098115.
- Miehe C, Hofacker M, Welschinger F. A phase field model for rate-independent crack propagation: robust algorithmic implementation based on operator splits. Comput Method Appl Mech Eng. 2010;199(45-48):2765–2778. doi:10.1016/j.cma.2010.04.011.
- Zhang Y, Yu J, Wang X, et al. Molecular insights into the complex mechanics of plant epidermal cell walls. Science. 2021;372(6543):706–711. doi:10.1126/science.abf2824.
- Tavares da Costa MV, Li L, Berglund LA. Fracture properties of thin brittle MTM clay coating on ductile HEC polymer substrate. Mater Design. 2023;230:111947. doi:10.1016/j.matdes.2023.111947.
- Zhou S, Rabczuk T, Zhuang X. Phase field modeling of quasi-static and dynamic crack propagation: COMSOL implementation and case studies. Adv Eng Softw. 2018;122:31–49. doi:10.1016/j.advengsoft.2018.03.012.
- Fang J, Wu C, Rabczuk T, et al. Phase field fracture in elasto-plastic solids: abaqus implementation and case studies. Theor Appl Fract Mech. 2019;103:102252. doi:10.1016/j.tafmec.2019.102252.
- Bourdin B, Francfort GA, Marigo JJ. Numerical experiments in revisited brittle fracture. J Mech Phys Solids. 2000;48(4):797–826. doi:10.1016/S0022-5096(99)00028-9.
- Mianehrow H, Berglund LA, Wohlert J. Interface effects from moisture in nanocomposites of 2D graphene oxide in cellulose nanofiber (CNF) matrix – a molecular dynamics study. J. Mater. Chem. A. 2022;10(4):2122–2132. doi:10.1039/D1TA09286C.
- Wang RZ, Suo Z, Evans AG, et al. Deformation mechanisms in nacre. J. Mater. Res. 2001;16(9):2485–2493. doi:10.1557/JMR.2001.0340.
Appendix A.
Material parameters for CNF and TOCN matrices
The chosen elastic-plastic version of phase field models that govern only the matrix domain is defined as [Citation39]
(A.1)
(A.1)
where
is the damage variable,
is the elastic strain tensor,
is the stress tensor,
is the effective hardening modulus,
is the initial yield stress and
is equivalent plastic shear strain. When the damage variable
reaches a unit value, fracture happens. Otherwise, the material is intact. The second integral accounts for the fracture process [Citation35, Citation40], where
is fracture energy and
is the length scale parameter that governs the size of the fracture zone. The properties
and
have to be calibrated. As mentioned in Section 2.3, this version of the phase-field damage model was chosen because the ductility of the CNF and TOCN matrices originated from the nanofibrils network. In particular, the sliding of nanofibrils has a major contribution (above 60%) to plasticity in cellulose microfibrils [Citation36]. For this damage mechanism, the fracture toughness of sliding is 0.2 J/m2 [Citation8] and this value was therefore used in EquationEq. (A.1)
(A.1)
(A.1) throughout this work. The model in Eq. (A1) is essentially calibrated from the stress-strain curves on the neat matrices reported in the main references [Citation29, Citation30]. The calibration is performed as the 2D plane stress approach in the same geometries used in tensile testing, e.g. stripes where the gauge lengths GL were set in the optical extensometers. The geometry as one-fourth of stripes is used to reduce the calculation time. Symmetry boundary conditions are set on the left and bottom while prescribed displacement on top as shown in . The phase-field damage model is then set in a small domain of the geometry to localize the fracture and avoid unnecessary calculation time. The in-build COMSOL plasticity material model as isotropic hardening is used for the remaining regions. Higher-order quadrilateral elements were used with mesh refinement in the phase field domain.
Figure A1. (a) Boundary conditions and material models and (b) FE predictions overlapped on the experimental results.
shows the calibrated stress-strain curves of each matrix overlapped with the experimental results. The curves were fitted well for both matrices where material parameters from Eq. (A1) are reported in . In phase field model calibration, the strain-to-failure was adjusted from the parameter reported also in .
Table A1. Input values for prediction in .
Appendix B.
Composite strength: effect of the interfacial shear strength
The bilinear cohesive zone modeling needs the interfacial shear strength as an input. The sensibility of this material parameter is verified in this section on the stress-strain curves where composite in-plane stress is calculated by EquationEq. (3)(3)
(3) . Here, arbitrary dimensions were chosen as
= 4 nm,
= 20 nm,
= 40 nm and
= 200 nm as an example. In addition, we assume the interfacial fracture toughness as 1 J/m2 from previous work [Citation37].
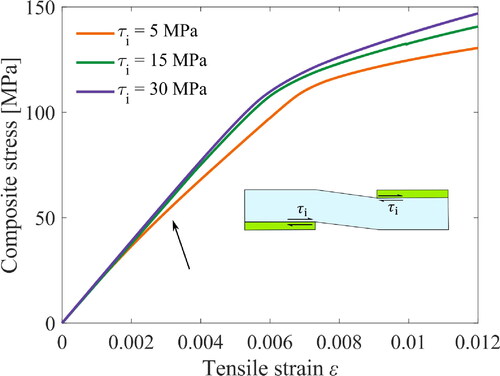
shows the curves from three sets of values: 5, 15 and 30 MPa. The first value of 5 MPa was measured for clay/cellulosic interfaces in a previous study [Citation37]. The curve from this value provides a slope deviation after the initial curve (see the arrow), which is not seen in the experimental observations [Citation29, Citation30]. In the numerical setting, this curve deviation is originated from platelet sliding and poor stress transfer. For the higher values of 15 to 30 MPa, the transition resembles the experimental data, which indicates, in turn, an unexpectedly stronger interfacial strength since the system has a chemically weak interaction at the nanofibrils/clay interface without a binder. During the composite assembly, the high aspect ratio platelets act as a nucleate site for the agglomeration of nanofibril bundles [Citation41]. The nanofibrils placed and compacted on the rough surfaces of the platelets promote an interlocking mechanism during tension [Citation42]. In this work, instead of explicitly setting the roughness of platelets in the geometry, we increase the interfacial shear strength up to 30 MPa in the cohesive zone modeling because adding such details in the modeling would increase dramatically the computation time.
Figure B1. Stress-strain curves from the one-fourth of the unit cell computed from three distinct values of interfacial shear strength.