
 ?Mathematical formulae have been encoded as MathML and are displayed in this HTML version using MathJax in order to improve their display. Uncheck the box to turn MathJax off. This feature requires Javascript. Click on a formula to zoom.
Abstract
Structural health monitoring (SHM) of brittle structures will require versatile sensing instrumentation that can transmitting transient loadings into rapid electrical responses. This research investigated the sensing performance of CNT Buckypaper (CNT-BP) thin-films on stressed fiber-reinforced composites, which are integral materials to various industries of the infrastructure. Three-point bending experiments revealed an extraordinary gauge factor (∼40) and impressive response linearity. Electrical responses were instantaneous; moreover, low force impacts were detectable, the sensors provided clear indications of spatial recognition. Most importantly, the manufacturing methods are scalable and cost effective compared to commercialized strain gauges. This study examined micro-strain measurements (<1%) of carbon fiber composites, in which bending strain of 0.002% could be detected. In addition, damage progressions of glass fiber composites were recorded in response to low-impact energies. Less than 20 J of impact energy was detectable by the sensor, and the severity could be assessed from drastic changes in the sensing behavior.
Graphical Abstract
1. Introduction
Fiber-reinforced polymer composites (FRPCs) have become integral materials in the aerospace, civil, automotive, and marine industries of the global infrastructure [Citation1,Citation2]. The shortcomings for composite materials lie within the inherent brittleness and ensuing low tolerance for matrix cracking; therefore, maintenance is imperative for performance and safety. Large-scale sensing systems would streamline maintenance by collecting and interpreting real-time, unbiased data on mechanical performance [Citation3–6]. Piezoresistive strain gauges are a pillar in effective structural health monitoring (SHM) systems. Babanajad et al. developed an SHM system for the Manhattan Bridge, which is comprised of strain gauges and accelerometers that monitored the dynamic structural behavior in response to train crossings [Citation7]. Their intentions were to identify and locate misaligned rail joints. The fusion of vibrational and flexural data from the sensors provided raw mechanical information that can diagnose structural deficiencies throughout the railway. In another study, which avoided the use of accelerometers, Zymelka et al. deployed an SHM system of thin-film, strain gauge arrays that monitored dynamic deformations throughout a busy highway in Japan [Citation8]. The system produced a strain distribution that could identify the areas of potential fatigue.
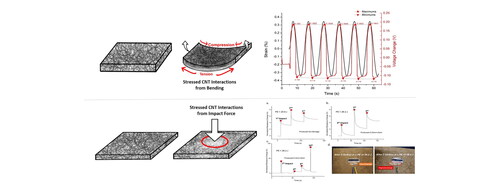
Carbon nanotubes (CNTs) possess impressive multifunctionality that is attractive in sensing applications [Citation9,Citation10]. Both theoretically and experimentally, it is proven that CNTs have an electrical conductivity of 3 × 10⁶ S/m, a thermal conductivity of 2000–3500 W/m·K [Citation11,Citation12], mechanical strength of 100 GPa [Citation12], Young’s modulus of 1 TPa [Citation13], and a piezoresistive gauge factor (GF) of 2900 [Citation12,Citation14]. Dispersion science has led to the scalable production of free-standing, polymer-free CNT thin films known as buckypaper (BP) [Citation15,Citation16]. This research intends to advance the exploration of a carbon nanotube buckypaper (CNT-BP) sensors by investigating its ability to detect micro-strains (<0.5%), low-force impacts, and potential property degradation in fiber-reinforced plastics (FRPs). As stress is applied to a dense CNT network, the CNT-CNT interactions deform and often separate thus altering percolation and the ensuing electrical resistance [Citation9]. When the applied stress is removed, the network relaxes. The stress and relaxation of the network produces a relatively elastic electrical response that can be measured, visualized, and collected.
The CNT-BP films presented in the research were fabricated with multi-walled carbon nanotubes (MWCNTs) filtrated from an aqueous dispersion. The final properties are attractive, as the resultant films possess a thickness, areal density, electrical conductivity and elastic modulus of 10 µm, 5 g/m2, 200 S/cm and 3.6 GPa, respectively. CNT-BP is low-profile and compliant to integrate with ink-jet printed circuitry, which offers low-cost and scalable manufacturing methods. In our prior work, as a strain gauge, the designed CNT-BP sensor exhibited sensitivity that was nearly a magnitude higher (8×) than metallic strain gauges [Citation17]. This research explored the response drift, potential strain resolution, detection of direct and indirect impacts, and the potential deterioration in composite. As a strain gauge, CNT-BP can detect 10 µm of deflection in carbon fiber composites. The sensor can also detect less than 20 J of impact energy in glass fiber composites. This research reveals CNT-BP as an impressive and scalable sensing material that can integrate into low-cost flexible circuitry for direct measurement of real-time structural behavior in brittle materials like fiber-reinforced composites.
2. Materials and methods
2.1. Multi-walled carbon nanotube buckypaper fabrication
The fabrication of CNT-BP first involves producing a uniform dispersion of MWCNTs in aqueous medium via an ultrasonic probe sonicator. The design goal is to minimize the large CNT bundles without damaging or truncating individual nanotubes. The length of the CNTs has a profound influence on the final properties of the CNT-BP [Citation18]. Triton-X surfactant is added to further reduce the surface energies among CNT bundles, which have an affinity for each other, leading to high-quality dispersions that promote robust CNT networks during film fabrication [Citation15,Citation16,Citation19]. After the dispersion step, the aqueous suspension is filtrated through a mesh filter onto a polymer substrate before drying. The dried buckypaper film is then peeled from the substrate and repeatedly washed with distilled water. After washing, the film is annealed at 850 °C under argon gas for 4 h to remove residual surfactant and impurities. presents a 2 m-long continuous roll of CNT buckypaper in addition to a scanning electron microscopy (SEM) image of the final tightly packed CNT network [Citation20]. In contrast to CNT/matrix nanocomposite sensors, which involve the dispersion of CNTs into an insulating binding material, the CNT network in buckypaper is dense and free from insulating bonders. As a result, percolation is lively and coupling characteristics like piezoresistivity are enhanced. presents a broad illustration of piezoresistivity in CNT-BP. The bending of the CNT network introduces tension to the joint interactions while impacting propagates stress waves throughout these interactions.
Figure 1. Continuous roll of carbon nanotube buckypaper with high magnification of microscopy image of CNT network structure.
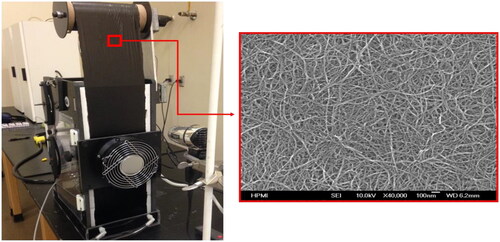
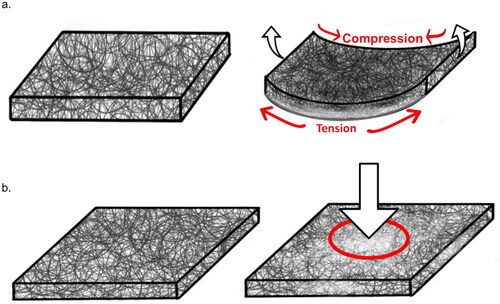
Figure 2. Illustration of structural response to a. flexural strain and b. low-force impact. External stress and strain deform the CNT network, leading to changes in electrical resistance.
2.2. Inkjet printed sensor design
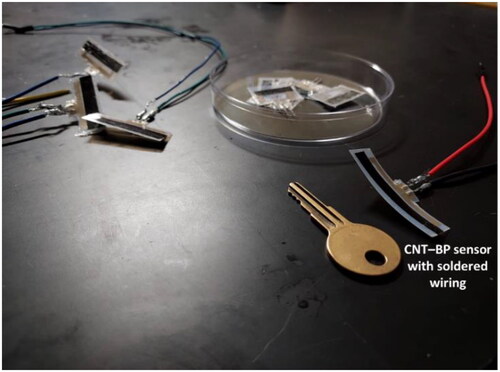
The primary components making up the sensor structure are an ink-receptive polymer film, printed circuitry, a strip of CNT-BP, and a laminating film. illustrates the manufacturing process. Silver ink electrodes are printed onto thin polyethylene terephthalate (PET) substrate using a single-pass inkjet printer (i.e. Epson EcoTank Printer) and commercially available, water-based silver ink from NovaCentrix. The PET film has an ink-receptive coating, and the composition of the ink includes 25 wt.% silver particles ( ≈ 60–80 nm), 1–15 wt.% ethylene glycol, and 60–75 wt.% water. The ink is emission-free and dries quickly, and the printer produces minimal waste. Once the electrodes are printed, a CNT-BP strip (2 cm × 0.5 cm × 7 µm) is positioned between the PET circuit and laminating film. The electrodes are fixed to each end of the CNT-BP strip. After lamination, contacts are crimped to the printed electrodes for plug and play measurements. displays the low-profile design of the CNT-BP sensor. Inkjet printing has the advantages of short production time, low cost, minimal waste, high spatial resolution, and good reproducibility.
Figure 3. Process flow of scalable sensor manufacturing process that includes printing with a typical inkjet printer and easy lamination.
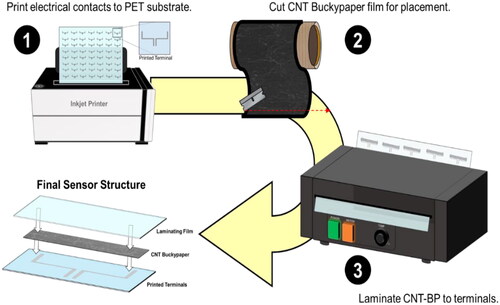
Figure 4. Final low-profile CNT-BP sensor design and size perspective using mailbox key. Sensors are 220 µm thick.
2.3. Manufacturing carbon fiber reinforced plastic coupons for flexural testing
Plain weave, T-300 carbon fiber-reinforced vinyl ester is the material used to perform sensing experiments on computer-controlled three-point bending strain. The panel is manufactured via a vacuum bagging infusion process (VIP) using 8 fiber layers in accordance with the ASTM D790 [Citation21]. Using an OMAX waterjet, ten specimens are cut according to the standard. The final fiber volume fraction of the panel was 65%, and the dimensions were 14 cm × 1.3 cm with a thickness of 3.8 mm.
2.4. Manufacturing glass fiber reinforced plastic panels for impact testing
E-glass fiber reinforced epoxy (EPON 862) is the material used to perform sensing experiments on low-force impacts. Damages to glass fiber composite are more discernible than carbon fiber, which avoids the need for ultrasonic c-scanning. EPON 862 provides good impact resistance for experimental flexibility. A glass fiber panel was manufactured via VIP according to the ASTM D7136 standard for drop-weight impact testing [Citation22]. Using an OMAX waterjet, ten specimens were cut according to the standard dimensions of 15 cm × 10 cm. The final specimens were 4.04 mm thick with a fiber volume fraction of 70%.
2.5. Characterization of buckypaper sensors
CNT-BP sensors were carefully attached to the center of each specimen using an epoxy-based adhesive (Loctite 401) using methods outlined by strain gauge manufacturers. The sensors were connected to a Wheatstone bridge circuit, and the measurements were recorded using a Keithley multimeter and visualized via LabView. The Wheatstone bridge ensures accuracy when measuring gauge factor. Three-point bending deflections were generated and recorded by the MTS 858 dynamic testing system, shown in . An initial deflection (δ) of 0.8 mm was applied to each specimen prior to generating sinusoidal deflections ranging from ±0.01–2 mm at frequencies of 0.1 Hz. The pre-existing strain was used to represent a natural deflection and keep the load pin in contact with the specimen to produce full sinusoidal strain cycles in the specimen. summarizes the various bending strains applied according to the applied deflections on a rectangular beam with a span length (L), width (w), and thickness (t) of 11.5 cm × 13 mm × 3.8 mm, respectively. Bending strain calculations were made using EquationEquation 1(1)
(1) . The initial deflection, which equates to 0.138% strain, was considered the starting value (0% strain) for normalization.
(1)
(1)
Figure 5. Three-point bending test on carbon fiber reinforced plastic (CFRP) coupons. (a) position of load pin prior to testing or as it disengages with specimen, (b) position of load pin after loading initial deflection, (c) full bending deflection CFPR coupon, (d) sensors are attached to the underside of each coupon and plugged into a multimeter and flat cable.
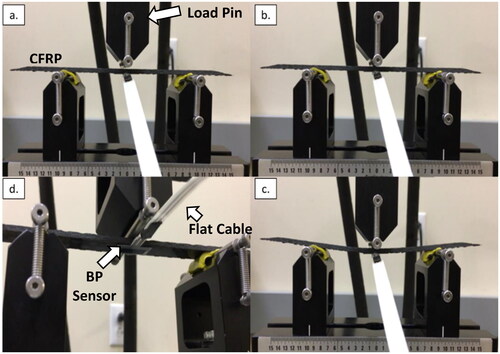
Table 1. List of experimental bending deflections and ensuing bending strain.
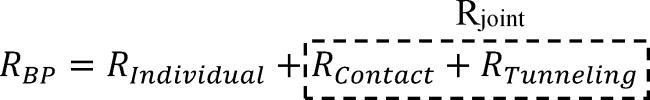
The mathematical expressions of piezoresistivity in a CNT network are critical to understanding the sensing responses of CNT-BP. Equation 2 presents the electrical resistance of buckypaper in terms of three principal components: (1) the intrinsic resistance of the individual CNTs (RIndividual), (2) the contact resistance among connected nanotubes (RContact), and (3) the tunneling resistance among neighboring nanotubes [Citation9,Citation10,Citation17]. Due to the remarkable elastic modulus (∼1TPa) of individual CNTs, RIndividual has a negligible role in the piezoresistivity of buckypaper. Such high stiffness requires substantial localized stress to strain individual nanotubes.
Stresses and strains expand the CNT network introducing gaps that reduce the contact area and tunneling distances between CNT bundles. In theory, the weakened interaction and interfacial sliding at joints induce changes to the overall electrical resistance of CNT-BP. This is the essence of piezoresistivity. In Equation 2, the global resistance of buckypaper is expressed as RBP = RIndividual + Rjoint, where Rjoint denotes the variable percolation pathways. It encompasses the RContact and RTunneling [Citation4,Citation13,Citation16,Citation18]. illustrates the general concept of a CNT network’s response to stress.
 (2)
(2)
Sensitivity, which is measured by gauge factor, is a key performance metric. To determine the gauge factor, the CNT-BP sensor is connected to a Wheatstone Quarter-Bridge (WQB) circuit, as illustrated in . A small voltage (Vin < 3 V) is applied to the circuit to stimulate the sensing response. The voltage (Vout) across the CNT-BP is then monitored using a multimeter and NI Labview software. As presented in EquationEquation 3(3)
(3) , Vout can be expressed in terms of Vin and the resistors (Rx) that establish the WQB circuit [Citation17].
(3)
(3)
Figure 6. Schematic of the Wheatstone bridge characterization setup, where Vin = 3 V and RBP ≈ R2 = R3 = R4 to balance the bridge.
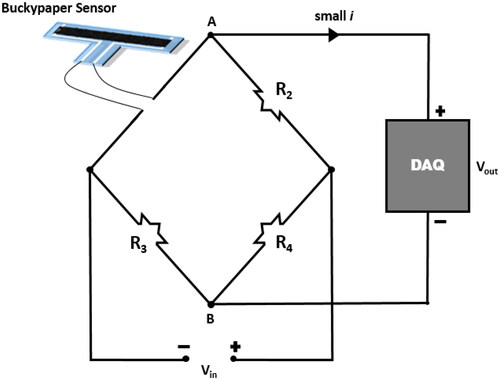
The WQB circuit is balanced. If the bridge is balanced, Vout is null when the sensor is at rest. As a result, R2–4 are known values that are chosen to balance the bridge. EquationEquation 4(4)
(4) presents the general rule for balancing a WQB circuit. The average resistance of the sensors (RBP) in this research was 50Ω; thus, the resistance of each resistor was equivalent (R2–4 = 50Ω), which is a simplified approach to balancing the circuit.
(4)
(4)
EquationEquation 5(5)
(5) expresses changes to the output voltage from EquationEquation 3
(3)
(3) as ΔVout, which occurs in response to changes to the resistance of the buckypaper sensor (ΔRBP). In other words, CNT-BP serves as the variable resistor in the WQB circuit.
(5)
(5)
By deploying equivalent resistors for R2–4, EquationEquation 5(5)
(5) can be simplified to quantify piezoresistivity with respect to normalized voltage changes in the circuit, as expressed in EquationEquation 6
(6)
(6) .
(6)
(6)
The gauge factor mathematically expresses the response of the BP sensor to applied strain (ε). After solving for ΔRBP in EquationEquation 6(6)
(6) , the gauge factor (GF) can be determined using EquationEquation 7
(7)
(7) .
(7)
(7)
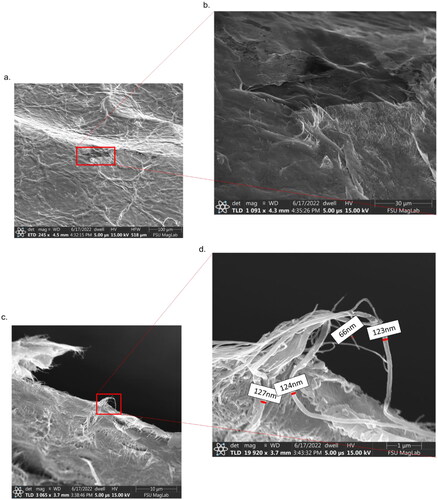
presents SEM images that reveal the continuous network of intertwined nanotubes in CNT-BP. displays a partially folded sample of CNT-BP. At low magnification (<250×), the microstructure presents itself as a densely packed arrangement with tube bundles bulging from the surface. Along the fold, discontinuities in the network appear at higher magnification (>1000×), as displayed in . In principle, as ruptures appear throughout a strained CNT-BP, they will raise Rjoint from EquationEquation 1(1)
(1) by spreading the CNT network and breaking CNT-CNT contacts. For deeper visualizations of the CNT-BP microstructure, presents a ripped edge of CNT-BP film at ∼3000× and ∼20,000× that reveal long and stiff nanotube bundles that are more pronounced and gnarly. The diameter of the CNT bundles ranged from 60 to 150 nm. From the SEM images, BP can be explained as a fibrous mat comprised of an immeasurable number of randomly aligned and twisted nanotubes. The combination of electrical properties and mechanical interlocking provokes the coupling characteristics (piezoresistivity) expressed in EquationEquation 1
(1)
(1) . By designing a sensor for direct measurements, this research will explore these structural-property relationships as they are transmitted as electrical signals.
Figure 7. SEM images of (a) deformed CNT buckypaper containing a discontinuity; (b) high magnification of the discontinuity; (c) the edge of fracture CNT-BP; and (d) high magnification of overhanging bundles of CNTs along the edge.
2.6. Retrofitting for pre-existing damage detection
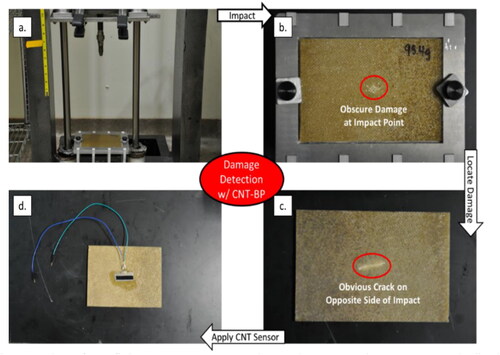
The sensitive response in CNT-BP has encouraged the exploration of damage detection fiber reinforced plastics. Low-force impact can cause barely visible impact damage (BVID) in fiber reinforced composites. BVID produces minimal indications to the naked eye, yet surface deformations, delamination, and possible fiber blow-out may occur. A standardized impactor was used to impact the center of five GFRP panels (GFRP-d) to generate BVID. The specified drop-weight mass and height for inducing the damages were 8.78 kg and 30.5 cm, respectively, which equates to 26.2 J of potential energy. These parameters were screened and determined through preliminary impact tests of GFRP panels. After damaging the panels, the underside of each panel was fitted with a CNT-BP sensor using an epoxy-based adhesive. Five pristine GFRP panels (GFRP-p) were also fitted with sensors to establish a baseline sensing response for undamaged panels. Damage features like micro-cracking and fiber blowout can introduce deformities that induce piezoresistive responses in the CNT-BP sensor. The sensing responses of GFRP-p and GFRP-d were compared to investigate the possibility of damage detection. presents the flow of retrofitting damaged GFRP panels.
Figure 8. Flow of retrofitting CNT-BP sensors to damaged GFRP panels. (a) ASTM standardized; drop-weight impactor, (b) obscure damage from low-force impact, (c) microcracking on underside of GFRP panel, (d) attached CNT-BP sensor.
2.7. Assessing impact severity and damage progression
After establishing a response baseline, low force impacts were collected and transmitted into sensor readings. Each GFRP-p panel was impacted at 20.9 J of potential energy. These parameters were determined through trial and error to establish a baseline sensory response to nondestructive impact events. After the baseline responses were known, for pristine panels were established, damage was introduced and propagated by continuously impacting the panels at using 26.2 J of potential energy (mass = 8.78 kg; height = 30.5 cm). Repetitive impacts at this setting have been found to gradually propagate damage through GFRP-p panels. The successive impacts were monitored for potential indicators of deterioration. Furthermore, after a series of impacts, the signal drift of the sensors was monitored to reveal changes to the baseline response as damage features become more pronounced.
3. Results and discussion
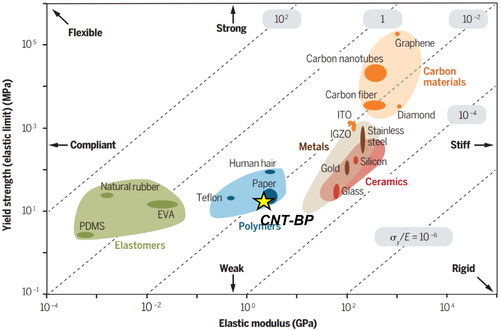
Mechanical flexibility is a key feature for CNT-BP to facilitate shape conformability. As presented in EquationEquation 8(8)
(8) , the yield strength (σy), Young’s modulus (E), and thickness (t) of the CNT-BP determine the figure of merit (FOM) for flexibility (fFOM). Through dynamic mechanical analysis, the relevant mechanical properties can be directly measured and compared to the various materials (i.e. plastics, metals, and carbon-based materials) in the Ashby chart shown in . With a thickness, tensile yield strength, and Young’s modulus of 220 µm, 42 MPa, and 3.2 GPa, respectively, the CNT-BP sensor exhibits comparable flexibility to paper and polymeric thin films.
(8)
(8)
Figure 9. Ashby chart of the CNT-BP sensor and various materials according to elastic limit and elastic modulus.
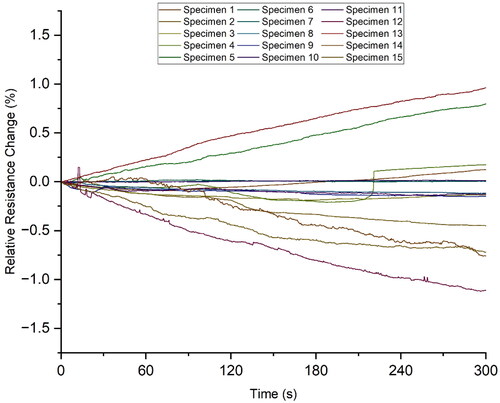
Before performing sensing experiments, the baseline response of the CNT-BP sensor needs to be established. Each sensor was connected to a data acquisition system that monitors the resting resistance for 5 min. depicts the normalized resistance change, which exhibits a favorable drift (±0.005%/s). Random spikes in the sensing response rarely occur, and if they do, the spikes are insignificant (<0.5%). In sensing, Type-1 errors need to be avoided, as false positives can result from noisy signals. The steadiness of the electrical resistance in the dense and interconnected CNT-BP network helps mitigate the need for signal conditioning and promotes interpretable data for reliable binary models.
Figure 10. Resting resistance of CNT-BP sensors.
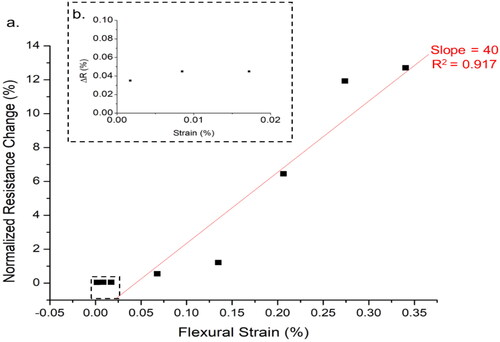
An MTS 858 dynamic testing system was used to apply and monitor controlled three-point deflections in CFRP coupons according to ASTM standard D790 [Citation21]. The fitted sensors were connected to a Wheatstone Quarter Bridge to ensure accurate gauge factor calculations. A calibration curve is plotted in , in which the slope of the plot estimates the gauge factor with good linearity (R2 = 0.92). The linearity validates the synergy between the applied mechanical deformations to the specimen and the electrical responses from the CNT-BP network.
Figure 11. Potential calibration curve of CNT-BP strain sensing.
As evidenced in , the gauge factor of the buckypaper strain gauge can surpass 50. This is impressive sensitivity at low applied strains, and the value presented by the strain gauge was reinforced during flexural tests of strains larger than 0.138%, which was designated as the initialized strain prior to testing. During these tests, the load pin would raise above the neutral axis of the CFRP coupon. The disengagement was not reflected in the data produced by the tester, but it was reflected in the sensory response from the BP strain gauge. The results display a distinct difference between the collective peaks of maximums and minimums. The maximum values represent deflection, while the minimum values represent relaxation at the neutral axis. For reference, the true strain range applied by the tester was [−0.34%, 0.138%] instead of the assumed [−0.34%, 0.34%]. After the pre-existing strain relaxed to the neutral axis, the load pin disengaged from the sample. As a result, the magnitudes of the deflection sensory response (0.185) and relaxation sensory response (0.119) were not equivalent. The strain gauge provided a true representation of the strain behavior of the tested GFRP specimen, while the dynamic tester incorrectly simulated the behavior from user-submitted parameters.
Figure 12. Output voltage response to 0.34% of cyclical strain (100 mHz) with plotted maximum and minimum voltage values. The regression slopes indicate good stability and consistency.
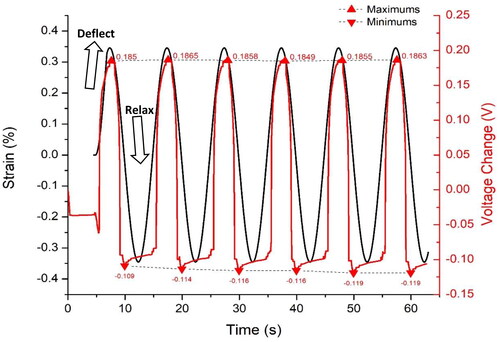
To quantify response stability, the figure plots a linear regression using the local peaks and troughs of the sinusoidal signal. Ideally, the slope of each regression should approach 0 to signify flatness. Accordingly, the slopes of the peaks and trough regression lines are 7.16 × 10⁻⁶ and −1.93 × 10⁻⁴, respectively. The potential for response repeatability can be attributed to the mechanical interlocking of the CNT network in BP, which exhibits an impressive elastic modulus of 3.7 GPa. Given the coupling characteristics in CNT-BP, this mechanical elasticity is expected to influence elasticity in the electrical sensing response.
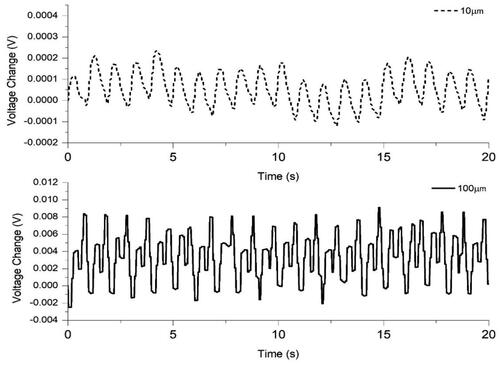
Brittle materials like FRPs fail at low strains (<1%), so there is a need to detect bending deflections that traditionally go undetected with commercial strain gauges. Detecting mechanical changes early will avoid degradation and facilitate preventative maintenance. presents cyclical sensing results of 0.017% and 0.002% flexural strains at a frequency of 1 Hz. The sensitivity of the sensor results in the detection of deflections as low as 10 µm. Even slight deflections contort the CNT-CNT contact points sufficient to generate clear electrical responses that display repeatability. The CNT-BP sensor can detect deflections that are essentially invisible. The presented sensing results suffice for binary indications of strain; however, research efforts need more dedication towards minimizing the response drift, which is inherent to CNT-based sensors [Citation23,Citation24].
Figure 13. Printed BP strain gauge response to 10 μm and 100 µm of deflection.
Over the last decade, there are several sensor studies that have showcased the sensing ability of CNT networks; however, the manufacturing of practical sensing devices typically involved detailed dispersion sciences, expensive printing equipment, and complex deposition procedures that are tolerable at the laboratory scale but unattractive for high-throughput manufacturing [Citation25]. lists notable references of recent CNT-based sensors. CNT strain gauges have displayed high gauge factors compared to commercial strain gauges at large strains. In comparison to other CNT-based sensors, the CNT-BP in this research is attractive due its high gauge factor (∼50) at low strains (<0.2%); moreover, the outlined manufacturing methods are scalable and low-cost while avoiding the need for complex CNT-polymer dispersions [Citation26].
Table 2. Notable CNT-based stain gauges.
In addition to low failure strains, composite materials possess low impact strength and are susceptible to persistent failure modes (i.e. crack propagation) long after impact. The strong piezoresistivity of CNT-BP provides a means for recording live impact events. In preliminary investigations, manual impacts were recorded. illustrates the manual test set up, which involves a hammer, a sturdy laboratory workbench, and a attached and connected CNT-BP sensor. By striking the proximity of the sensor, voltage responses were collected, as shown in . The sensor immediately detected both direct and indirect hammer strikes, which produce piezoresistive responses that were drastically different from each other. For example, direct impacts to the CNT-BP sensor produce voltage responses that are 100× larger than responses from indirect impacts. The ability to detect and distinguish direct and indirect impacts promotes the potential for spatial recognition. Though spatial recognition is outside of the scope of this research, these results establish an opportunity for future investigation.
Figure 14. Illustration of hammer strike test on a laboratory workbench with attached sensor varied impact locations.
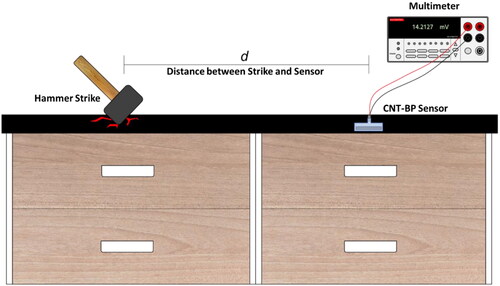
Figure 15. Plots of impact detection: a. voltage responses to single impacts at various distances; b. voltage responses to quick and successive hammer strikes; c. verification of detecting all five hammer strikes.
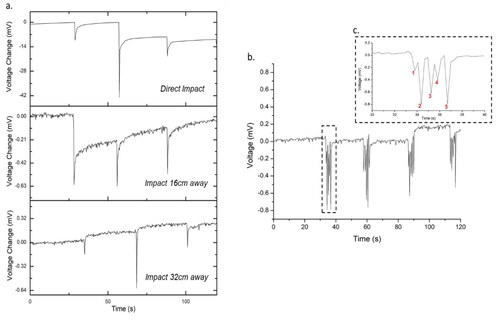
reinforces the quick sensing responses presented in the flexural strain experiments. The results in reveal the ability to detect direct and indirect impacts individually. The sensors were allotted 30 s to relax between three separate impact strikes on the workbench at varying distances from the sensor. showcases the sensor’s ability to detect five successive hammer strikes occurring 30 cm away from the location of the sensor. This is due to the propagation of mechanical stress waves from impacting a rigid structure. The electromechanical coupling in the CNT network is even responsive to stress waves. Though the response magnitude varies more than the previous strain measurements, the distinct voltage spikes serve as binary (i.e. true or false) responses to impact events [Citation14]. The preliminary investigations on impact detection provide grounds for standardized testing, which enables quantifiable impact and damage data points to correlate with the electrical responses in CNT-BP.
Figure 16. Comparison of passive sensory drift for pristine and damaged samples (dent depth = 0.15 mm).
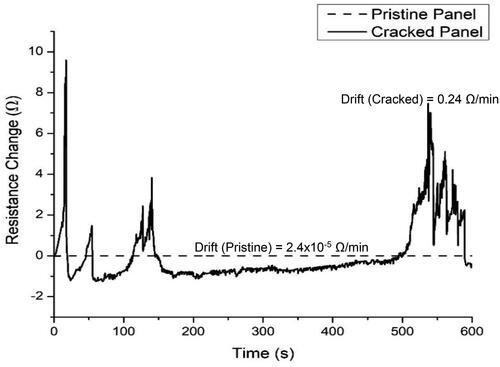
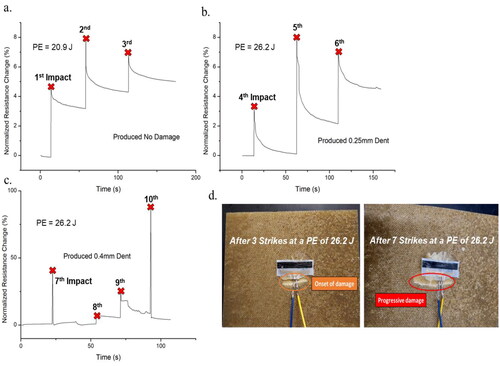
Figure 17. Three series of impact strikes; (a) baseline impact response to nondestructive impact, (b) impact response as 0.25 mm dent forms, (c) impact response as dent grew from 0.25 mm to 0.4 mm, (d) photos of progression of damage after onset (0.25 mm) and propagation (0.4 mm).
Accordingly, ASTM D7136 standard impact tests were performed on glass fiber-reinforced using a drop-weight impactor. Measurable dents formed with increasing impact energy (J) expressed by EquationEquation 9(9)
(9) . E denotes the potential energy of the impactor prior to the drop; m denotes the mass of the impactor (kg); g denotes gravitational acceleration (9.81 m/s2); and H denotes the drop-height of the impactor (m).
(9)
(9)
Before impacts, the surfaces of the GFRP panels were measured for variability. Using a tip micrometer, the thickness of each panel was measured at fifteen positions. The average (4.04 mm) and standard deviation (40 µm) were calculated. The surfaces of pristine panels proved to be effectively flat with a coefficient of variation (CV) of 0.01. After impacts, the tip micrometer was used to measure the depth of the dents produced by the impactor. As displayed in , an unstrained sensor had a relatively flat baseline response. In brittle structures, damage features may form in between significant impact events. Micro-cracks and delamination may induce surface features underneath the sensor and within the sensor-composite interface. Ultimately, brittle cracking in composites formed detectable deformities on the panel surface. To justify this claim, two sets of GFRP panels were used in this study. The first set of panels were pristine and undamaged (GFRP-p) when the CNT-BP sensors were attached. The second set of panels (GFRP-d) were damaged by an impact strike. Sensors were attached to each group of panels to monitor resting resistance for signal comparisons. It was determined that the high sensitivity of the sensor eliminated the need for a Wheatstone bridge circuit. As a result, these standardized impact tests showcased passive sensing, in which external voltage and complex circuitry were not required.
As shown in , damage to GFRP-d panels is often obscure on the surface of the impact point; however, clear micro-cracking may occur on the underside surface of the panel (). Damage is quantified using a point micrometer by averaging the maximum dent depth measured along the impact surfaces of the GFRP-d panels. After attaching the CNT-BP sensors to the panels, the resting resistance was monitored for signal comparisons. also reinforces the resting signals introduced in . The baseline signals for GFRP-panels were flat and indicated the absence of brittle cracking. The dotted plot in the graph presents the 10-minute resistance drift of a CNT-BP sensor attached to a pristine panel. The drift rate on GFRP-p panels was as low as 2.4 × 10⁻⁵ Ω/min and exhibited strong linearity (R2 = 0.994). The uniform surface, which exhibited a CV of 0.01, encouraged a stable piezoresistive signal. As cracking occurred from impact damage, deformities were present in the GFRP-d panel and within the sensor-composite interface. The damage features were akin to strain, in which the surface loses uniformity and forced mechanical changes to the CNT network. It is assumed that the irregular surface influences a drastically different resting behavior in the sensor compared to sensors attached to uniformly flat surfaces. As a result, the sensing drift (%/s) of sensors on damage panels was higher than pristine panels by four orders of magnitude. The results in are attractive because they encourage a potential path for damage detection in retrofitting applications. The approach to retrofitting existing structures is critical to SHM system designs.
To further investigate diagnosing impact severity and potential damage, the GFRP-p panels were impacted several times with CNT-BP sensors attached. After the screening experiments, the parameters of the impact tester were configured for nondestructive impact events. Note that this baseline was established using a mass of 7 kg and height of 0.0305 m. To introduce damage, the mass of the impactor was increased to 8.78 kg while keeping the drop-height constant. Three separate series of successive impacts were documented. After each series, the dent depth was measured using the tip micrometer. As seen in , the dent increased to 250 µm and 400 µm following three and seven impact strikes, respectively. As brittle cracking propagated, the sensor detected the growing deformities on the surface. In addition, mechanical stress waves from succeeding impacts displayed a different behavior. For example, normalized resistance responses to impacts increased from 4.6% to 8% to 89% for the undamaged, 0.25 mm dented, and 0.4 mm dented samples, respectively.
Figure 18. Detection of onset and progression of damage; (a) damage after one and four impact strikes; (b) passive sensory drift in response to damage, which can be quantified by the depth of the dent after impact.
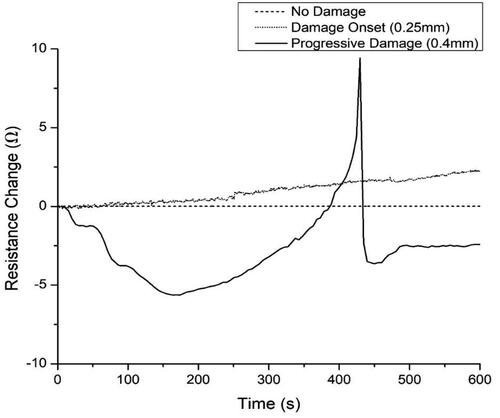
As depicted in , matrix cracking may rarely occur at the location of the CNT-BP sensor; however, with impressive sensitivity, juxtaposed transient stresses were sufficient to produce network changes in CNT-BP and produce a detectable piezoresistive response. presents resting resistance signals of undamaged and damaged panels. As damage features grew, the signal noise magnified. The impact dents and ensuing deformations in the CNT network caused erratic resting responses that may insinuate the presence of unwanted structural changes [Citation9].
To summarize the presented results, the CNT-BP sensor detected micro-strains, impact force, and potential damage features in brittle composite materials. The electrical responses to transient stress were immediate and distinct, and the sensors required low-cost manufacturing methods and simple circuitry. Though spatial recognition requires extensive exploration, the results of this research provide foundational data for future research in the area.
4. Conclusion
In this report, carbon nanotube buckypaper was presented as a potential strain, impact, and damage sensor that can advance the structural health monitoring of brittle materials. As a strain gauge, the CNT-BP sensor exhibited a gauge factor of 40 and established a linear relationship with the degree of strain. Linearity promotes reliability and calibration. The sensor detected bending deflections as low as 10 µm with promising repetition. By detecting invisible deflections, the sensor can potentially identify structural flaws early. Also, sensing signals exhibited minimal noise, as the normalized signal drift was less than 0.01%/s, which helps avoid Type I errors. In terms of impact sensing, the CNT-BP sensor could detect and distinguish single and successive impact events with quick and interpretable electrical resistance changes. Additionally, the sensor could distinguish the proximity of the impact strike. The combination of registering each impact event with the potential for spatial recognition is promising for large scale structural health monitoring. The sensitivity of the sensor has led to passive sensing, which does not require voltage to operate. As it pertains to signal noise, when at rest and without attachment to a damage feature, the electrical resistance of the sensor exhibited low drift with a rate as low as 2.4 × 10⁻⁵ Ω/min and strong linearity ( = 0.994). This is significant because a predictable and noiseless baseline promotes reliable and interpretable data collection that requires minimal conditioning. Early studies reveal the potential for CNT-BP sensors to identify acute mechanical changes to glass fiber reinforced plastic (GFRP) panels from low impact forces. Sensors that were attached to pre-existing, obscure damage exhibited signal drift rates that were up to four orders higher than sensors on pristine GFRP panels. This displayed the potential for passive damage sensing through retrofitting. In addition to detecting pre-existing damage, the sensors detected the onset and progression of damage to pristine GFRP panels. Dent depth was used to quantify damage, in accordance with an ASTM standard. As dent depth increased, both the impact-induced and signal drift responses were magnified. CNT-BP sensors have the potential to assess the severity of impact, as damages influence larger structural deformations upon impact. Lastly, the progression of damage can be monitored through the signal drift, as the drift magnifies with damage propagation. This research was intended to advance the detection of unexpected deterioration to the stiff, yet brittle materials in the infrastructure. The combination of ink-jet manufacturing and passive sensing makes the CNT-BP sensor an attractive component to structural health monitoring in smart structures in various industries.
Acknowledgements
The authors acknowledge the strong support from the High-Performance Material Institute in Tallahassee, FL, USA and the Laboratoire de Génie Électrique et Ferroélectricité (LGEF) in Villeurbanne, France. We also dedicate this work to the memory of Marquese Pollard, an irreplaceable contributor to this research.
Disclosure statement
The authors declare that they have no known competing financial interests or personal relationships that could influence the research work reported in this paper.
Additional information
Funding
Notes on contributors
Joshua DeGraff
Joshua DeGraff is faculty and a post-doctoral research fellow in the Industrial and Manufacturing Engineering department at the Florida A&M University-Florida State University College of Engineering (Tallahassee, FL). His research interests involve sensors and actuators, composite materials, nanocomposite fabrication, and process control.
Pierre-Jean Cottinet
Pierre-Jean Cottinet is an associate professor in the Electrical Engineering department at Institut National des Sciences Appliquées de Lyon in Villeurbanne, France. His research interests involve the fabrication and testing of smart materials, electroactive polymers, 4D printing, and energy harvesting.
Minh-Quyen Cottinet
Minh-Quyen Cottinet is an associate professor in the Electrical Engineering department at Institut National des Sciences Appliquées de Lyon in Villeurbanne, France. Her research interests involve the fabrication and testing of polymer composites, electroactive polymers, multifunctional materials, sensors and actuators.
Tarik Dickens
Tarik Dickens is an associate professor in the Industrial and Manufacturing Engineering department at the Florida A&M University-Florida State University College of Engineering (Tallahassee, FL). His research interests involve the areas of composite structure design, intelligent processing, additive and automated processing, and mechanical testing with a focus on failure prognosis (with interconnected sensors).
Kunal Joshi
Kunal Joshi is an engineer that obtained his PhD from the Industrial and Manufacturing Engineering department at the Florida A&M University-Florida State University College of Engineering (Tallahassee, FL) in 2018. His research interests involve exploring structural health monitoring techniques using triboluminescent materials.
Marquese Pollard
Marquese Pollard obtained his PhD from the Industrial and Manufacturing Engineering department at Florida A&M University-Florida State University College of Engineering (Tallahassee, FL) in 2023. His research interests involve 3D printing, multifunctional materials, composite materials, sensing, and process modeling.
Grace Johnson
Grace Johnson is an undergraduate research assistant in the Industrial and Manufacturing Engineering department at Florida A&M University-Florida State University College of Engineering (Tallahassee, FL). She also double majors in French. Her research has involved mechanical testing, sensors, nanocomposite manufacturing, and the post-processing of composite materials.
Anghea Dolisca
Anghea Dolisca is an undergraduate research assistant in the Biomedical Engineering department at Florida A&M University-Florida State University College of Engineering (Tallahassee, FL). Her research has involved sensor manufacturing and testing, nanocomposite fabrication, and the optimization of dispersion techniques.
Richard Liang
Zhiyong Liang is a Sprint Eminent Scholar Chair Professor in the Industrial and Manufacturing Engineering department at the Florida A&M University-Florida State University College of Engineering in Tallahassee, Florida. He also serves as the director of the High Performance Materials Institute. His research interests involve composite materials and processing, polymer materials, multifunctional materials, and simulation and process modeling.
References
- Zagainov GI, Lozino-Lozinski GE. Composite materials in aerospace design. Vol. 6. Cham: Springer Science & Business Media, 1996.
- Kossakowski PG, Wciślik W. Fiber-reinforced polymer composites in the construction of bridges: opportunities, problems and challenges. Fibers. 2022;10(4):37. doi: 10.3390/fib10040037.
- Fujino Y, Siringoringo DM, Ikeda Y, et al. Research and implementations of structural monitoring for bridges and buildings in Japan. Engineering. 2019;5(6):1093–1119. doi: 10.1016/j.eng.2019.09.006.
- Svendsen BT, Frøseth GT, Øiseth O, et al. A data-based structural health monitoring approach for damage detection in steel bridges using experimental data. J Civil Struct Health Monit. 2022;12(1):101–115. doi: 10.1007/s13349-021-00530-8.
- Ahmed H, Nasrazadani S, Ju S. Review paper on harsh environmental structural health monitoring. Int J Sci Res Eng Trends. 2021;7:2304–2314.
- Kumar R, Hossain A. Experimental performance and study of low power strain gauge based wireless sensor node for structure health monitoring. Wireless Pers Commun. 2018;101(3):1657–1669. doi: 10.1007/s11277-018-5782-6.
- Tochaei EN, Fang Z, Taylor T, et al. Structural monitoring and remaining fatigue life estimation of typical welded crack details in the Manhattan bridge. Engineering Structures. 2021;231:111760. doi: 10.1016/j.engstruct.2020.111760.
- Zymelka D, Togashi K, Kobayashi T. Concentric array of printed strain sensors for structural health monitoring. Sensors. 2020;20(7):1997. doi: 10.3390/s20071997.
- Obitayo W, Liu T. A review: carbon nanotube-based piezoresistive strain sensors. Journal of Sensors. 2012;2012:1–15. doi: 10.1155/2012/652438.
- Saxena S, Srivastava AK, Thomas S, et al. Carbon nanotube-based sensors and their application. In: Thomas S, Grohens Y, Vignaud G, Kalarikkal N, James J, editors. Nano-optics. Amsterdam: Elsevier, 2020. p. 265–291. doi: 10.1016/B978-0-12-818392-2.00010-X.
- Li Q W, Li Y, Zhang X F, et al. Structure-dependent electrical properties of carbon nanotube fibers. Adv Mat. 2007;19(20):3358–3363. doi: 10.1002/adma.200602966.
- Danish M, Luo S. A new route to enhance the packing density of buckypaper for superior piezoresistive sensor characteristics. Sensors. 2020;20(10):2904. doi: 10.3390/s20102904.
- Yu MF, Lourie O, Dyer MJ, et al. Strength and breaking mechanism of multiwalled carbon nanotubes under tensile load. Science. 2000;287(5453):637–640. doi: 10.1126/science.287.5453.637.
- Luo S, Liu T. SWCNT/graphite nanoplatelet hybrid thin films for self-temperature-compensated, highly sensitive, and extensible piezoresistive sensors. Adv Mater. 2013;25(39):5650–5657. doi: 10.1002/adma.201301796.
- Bai Y, Lin D, Wu F, et al. Adsorption of triton X-series surfactants and its role in stabilizing multi-walled carbon nanotube suspensions. Chemosphere. 2010;79(4):362–367. doi: 10.1016/j.chemosphere.2010.02.023.
- Rojas JA, Ardila-Rodríguez LA, Diniz MF, et al. Optimization of triton X-100 removal and ultrasound probe parameters in the preparation of multiwalled carbon nanotube buckypaper. Materials & Design. 2019;166:107612. doi: 10.1016/j.matdes.2019.107612.
- DeGraff J, Liang R, Le MQ, et al. Printable low-cost and flexible carbon nanotube buckypaper motion sensors. Materials & Design. 2017;133:47–53. doi: 10.1016/j.matdes.2017.07.048.
- Banna AH, Kayang KW, Volkov AN. Effects of the nanotube length and network morphology on the deformation mechanisms and mechanical properties of cross-linked carbon nanotube films. J Appl Phys. 2021;129(10):105101. doi: 10.1063/5.0033442.
- Park JG, Louis J, Cheng Q, et al. Electromagnetic interference shielding properties of carbon nanotube buckypaper composites. Nanotechnology. 2009;20(41):415702. doi: 10.1088/0957-4484/20/41/415702.
- Horne G, Liang Z. Systems and methods for continuous manufacture of buckypaper materials. 2018. https://www.freepatentsonline.com/9909259.html.
- ASTM International. Standard test methods for flexural properties of unreinforced and reinforced plastics and electrical insulating materials. https://www.astm.org/d0790-17.html.
- ASTM International. Standard test method for measuring the damage resistance of a fiber-reinforced polymer matrix composite to a drop-weight impact event. https://www.astm.org/d7136_d7136m-15.html.
- Yang H, Yuan L, Yao X, et al. Monotonic strain sensing behavior of self-assembled carbon nanotubes/graphene silicone rubber composites under cyclic loading. Compos Sci Technol. 2020;200:108474. doi: 10.1016/j.compscitech.2020.108474.
- Jin L, Chortos A, Lian F, et al. Microstructural origin of resistance–strain hysteresis in carbon nanotube thin film conductors. Proc Natl Acad Sci U S A. 2018;115(9):1986–1991. doi: 10.1073/pnas.1717217115.
- Zhang H, Bilotti E, Peijs T. The use of carbon nanotubes for damage sensing and structural health monitoring in laminated composites: a review. Nanocomposites. 2015;1(4):167–184. doi: 10.1080/20550324.2015.1113639.
- Kanoun O, Bouhamed A, Ramalingame R, et al. Review on conductive polymer/CNTs nanocomposites based flexible and stretchable strain and pressure sensors. Sensors. 2021;21(2):341. doi: 10.3390/s21020341.
- Rasathi S, Geetha K, Ilavarasi R, et al. Experimental investigation for gauge factor of carbon nanotube strain sensor. Int J Res Eng Sci. 2022;10:40–45.
- Chen C, Chu F, Zhang Y, et al. Fabricating flexible strain sensor with direct writing graphene/carbon nanotube aerogel. ACS Appl Electron Mater. 2023;5(3):1429–1436. doi: 10.1021/acsaelm.2c01338.
- Min S-H, Lee G-Y, Ahn S-H. Direct printing of highly sensitive, stretchable, and durable strain sensor based on silver nanoparticles/multi-walled carbon nanotubes composites. Compos B Eng. 2019;161:395–401. doi: 10.1016/j.compositesb.2018.12.107.
- Roh E, Hwang B-U, Kim D, et al. Stretchable, transparent, ultrasensitive, and patchable strain sensor for human–machine interfaces comprising a nanohybrid of carbon nanotubes and conductive elastomers. ACS Nano. 2015;9(6):6252–6261. doi: 10.1021/acsnano.5b01613.
- Zhang X, Xiang D, Wu Y, et al. High-performance flexible strain sensors based on biaxially stretched conductive polymer composites with carbon nanotubes immobilized on reduced graphene oxide. Compos A Appl Sci Manuf. 2021;151:106665. doi: 10.1016/j.compositesa.2021.106665.
- Xiang D, Zhang X, Harkin-Jones E, et al. Synergistic effects of hybrid conductive nanofillers on the performance of 3D printed highly elastic strain sensors. Compos A Appl Sci Manuf. 2020;129:105730. doi: 10.1016/j.compositesa.2019.105730.
- Cortés A, Sánchez-Romate XF, Jiménez-Suárez A, et al. Mechanical and strain-sensing capabilities of carbon nanotube reinforced composites by digital light processing 3D printing technology. Polymers. 2020;12(4):975. doi: 10.3390/polym12040975.