
ABSTRACT
Background
Patient safety culture (PSC) is a vital feature to assess the ability of any healthcare setting in addressing and reducing patients harm. This study attempted to assess the PSC in Intensive Care Units (ICUs) at Alexandria Main University Hospital (AMUH) from the point of view of physicians and nurses.
Methods
A cross-sectional study was implemented in two ICUs at AMUH over period of six months. Seventy-two participants were interviewed using the Hospital Patient Safety Scale, customized by the Agency for Healthcare Research and Quality (AHRQ).
Results
The average positive response to individual items in the patient safety scale ranged from 2.7% to 79.2%. The “Teamwork within Units” dimension had the utmost average percentage positive score (63.5%) amongst all participants, on the other hand, the “Non-Punitive Response to Errors” dimension had the lowest one (12.0%). Less than half (45.8%) of the interviewed participants rated patient’s safety at the hospital as accepted.
Conclusions
PSC is friable in targeted ICUs, much of work is needed to raise the responsiveness of health care givers regarding this issue. Executives and supervisors need to encourage the practices of PS through a blame free culture.
1. Introduction
Health care systems are developing quickly and working in progressively complex situations. This is related with expanding prospects of framework disappointment. This influences administration beneficiaries in various manners extending from close to misses with no damage, to temporary or permanent serious injuries or even death [Citation1]. Patient Safety (PS) is a growing global public health challenge. It refers to efforts to minimize preventable harm to a patient during receiving healthcare services. Patient Safety Culture (PSC) is described as a division of organizational culture, which relates specially to beliefs and values regarding PS within healthcare organizations [Citation2].
Patient harm owed to adverse events (AEs) is one of the top ten reasons of mortality and incapacity across the universe. [Citation3] Several PS measures have been carried out in advantageous countries. However, they had variable effect [Citation4].The condition in low and/or middle income countries (LMICs) is further serious where 66% of the worldwide weight of adverse events resulting from unsafe care occur [Citation5].
PS and quality of healthcare delivery systems, could be enhanced by implementing a network of interventions based on leadership, teamwork, and behavior change. Merits of assessing the existing PSC include increasing staff awareness on PSC; evaluating the present state of PSC in the organization; analyzing PSC trends over time and evaluating the impact of improvement interventions. [Citation6] Multiple methods have been suggested, including usage of supervisory data, health record notes, patient studies, and incident reports. [Citation7]Numerous questionnaires and assessment tools were established at the beginning of this century. In the 2000s, surveys and appraisal instruments were created. [Citation8] The reasonable broadness of the PSC by its definition is reflected in the wide scope of themes covered by these instruments [Citation9].
Risk management programs have gained significant importance in Intensive Care Units (ICUs). Such settings represent high-risk areas for AEs that could result from the multifaceted nature of health care services, the large number of interventions performed, long clinical stays, and the patients’ delicate ailments [Citation10,Citation11].
This study aims at assessing PSC perception among ICUs staff of Alexandria Main University Hospital (AMUH). This assessment will be reflected in planning for interventional strategies to improve PSC in ICUs.
2. Materials and methods
2.1. Study design and setting
This was a cross-sectional study conducted in the second and third ICU sat the AMUH. The ICUs of AMUH are consisting of three general units described as Medical/Surgical Critical Care units. Those are the first, second, and third units. Also, there are specialized ICUs for; chest, cardiology, internal medicine in addition to ICUs of Al-Moasat, educational hospital and the triage room. The research was conducted in the second and third ICUs of AMUH. The first ICU was not included in the research as it was under development during the research period. The second unit consists of two halls with a total of ten beds while the third unit consists of three halls with a total of eighteen beds. It was executed over a period of six months (August 2018–January 2019). The study was a part of a larger study aimed at implementation of proactive risk management tool for promoting PS in ICUs at AMUH.
2.2. Study participants
The convenient sampling technique was adopted. Data were filled and completed by ICUs’ nurses, physicians and administrators/managers in charge who agreed to participate in filling the questionnaire. The In addition, nurses who had contact with patients and working full 72time were selected. Participants were recruited from both studied units. A total of physicians and nurses completed the survey. Response rate calculated to be 57.0%.
2.3. Data collection
2.3.1. Study tool
Data was collected by the researchers by using the Hospital PS scale (HSOPSC), established by the Agency for Healthcare Research and Quality (AHRQ).The questionnaire involves two parts: the first one includes demographic characteristics, work position and years of working experience. The other part was PSC composites which comprised of 12 safety culture composites and a total number of 42 items. Six composites consist of four items; “teamwork inside units,” “handoffs and transitions,” “teamwork between units,” “staffing,” “supervisor/manager expectations and actions,” and “overall perceptions of PS.” While the other six composites consist of three items; “management support for PS,” “organizational learning and continuous improvement,” “communication openness,” “feedback and communication about error,” “nonpunitive response to errors,” and “frequency of events reported.” [Citation6] A pilot study was conducted to test the study tool on 10 healthcare workers, data from pilot study were not included.
2.3.2. Data analysis
Objectives, purposes, expected benefits of the study was explained to the participants. Confidentiality of data was ensured by the researchers. Respondents’ identities were kept confidential to protect their anonymity. The study was approved by the Research Ethics Committee of Faculty of Medicine, Alexandria University. Prior official permission was achieved from the head of critical care medicine department to hold the study.
Composite scores were calculated by summation of positive response percentages for all items divided by the number of items in each composite. The response to each item was scored on a 5-point Likert scale ranging from one for “strongly disagree” to five for “strongly agree.” However, three composites utilized the frequency response choice ranging from one for “never” to five for “always.” Both positively and negatively worded items were included in the survey. For the positively phrased items; positive response percentage was the sum of respondents who replied either; always, most of the time, strongly agree or agree. While for the negatively phrased items; positive response percentage was the sum of respondents who replied either; never, rarely, strongly disagree or disagree. For the item of “work area/unit PS Grade,” positive response percentage is the combined percentage of participants who replied “very good” or “excellent” for the item. The score of overall perception of PSC composites was calculated by dividing the sum of the positive response percentages of the 42 items by their number to get the average [Citation6].
These scores communicated how positively respondents reply to the items in each PSC composite: if the composite score was higher than 75%, then the composite reflected a strength zone; if the scores ranged from 75% to 50%, then the composite reflected a potential for improvement zone; while if lower than 50%, the composite reflected a weakness zone [Citation12]. Statistical analysis was achieved by Statistical Package for Social Sciences (SPSS), version 21 [Citation13]. Qualitative variables were presented in figures and percentages; for quantitative variables mean and standard deviation were used. Pearson correlation was used to measure the correlation between PSC composites. Statistically significant results were considered if P value was ≤ 0.05.
3. Results
shows that more than half of the participants (52.8%) were nurses, while the two-fifths were physicians (43.1%) and the rest (4.2%) were in managerial or administrative position. Most of participants (93.1%) had direct contact with patients. less than half of them (45.9%) had an experience of 6 years or more of work in their current position. More than three quarters of participants (79.1%) worked for 40 hours or more per week
Table 1. Baseline and working characteristics of study participants at the second and third ICUs of AMUH; 2019
shows scores for the 42 items. They are sorted by the PSC composite they are proposed to measure. The items are ordered inside each composite as they present in the questionnaire. The percentage of positive response to individual items ranged from 2.7% to 79.2%
Table 2. Item-Level positive response for the 42 survey items
and summarize the 12 composite scores of PSC. The highest composite score was 63.5% for Teamwork within Units. The next highest one was 56.4% for organizational learning and continuous Improvement. Other composites approaching 50% were for “supervisor/manager expectations and actions promoting PS” & “feedback and communication about error.” The lowest reported scores were handoffs and transitions (19.4%) and nonpunitive response to errors (12.0%). Total composite percent positive score was 37.3%.
Table 3. Average composite percent positive scores for PSC dimensions
Table 4. Correlation between PSC composite scores
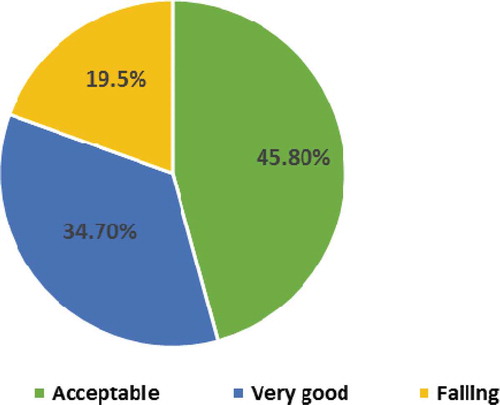
shows that the Proportion of participants who perceived PS as acceptable was 45.8%. About third (34.7%) of them perceived it as very good. While 19.5% perceived it as failing. None of participants perceived it neither as excellent nor poor. Positive response to the Work Area/Unit Patient Safety Grade item was 34.7% ().
Figure 1. Average percent of respondents giving their work area a PS grade
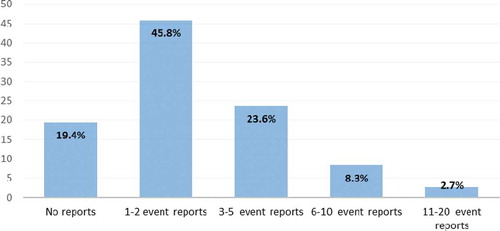
About one fifth (19.4%) of the respondents mentioned that no events were reported in the last 12 months. While two fifths (45.8%) mentioned that 1–2 events were reported ().
Figure 2. Frequency of events’ reporting by participants in the past 12 months
4. Discussion
Patient Safety is a crucial element of healthcare quality. Assessment of PSC is the first step to improve the healthcare services provided through healthcare settings [Citation14].
The present study revealed a friable PSC in most composites. Positive response percentages to individual items ranged from 2.7% to 79.2% with a mean total of 37.3%.Similarly, Salem M et al in 2019 [Citation15] and El-Shabrawy et al in 2015 [Citation16], reported scores of 39.3% and 40%consecutively. However, studies conducted in year 2017 in Cairo [Citation17] and Iran, [Citation18] showed higher scores (62.0%) and (57.7%) respectively [Citation17,Citation18]. Also, higher scores were reported in studies implemented on the level of the hospital rather than ICUs; such as El-Sherbiny et al in 2020 [Citation19], with score of 46.5%. Similar pattern of higher scores were found in Arab countries such as; Ghobashi et al in 2014 [Citation20] with score of 69.0%, El-Jardali et al in 2010 [Citation21] with score of 61.5% and Alahmadi in 2010 [Citation22] with score of 61.0%. High scores of 65.0%, 64.0%, 65.0%, and 52.2% were also, reported in studies in China 2013 [Citation23], Taiwan 2010 [Citation24], USA 2010 [Citation25], and the Netherlands 2013 [Citation26] respectively. These findings might be explained in a study executed in Egypt [Citation27] which highlighted the relation between decreased positive perception of PSC composites and the culture of blame.
Aiming a positive score more than 75% in any composite was reflecting the desired level. In the present study, no composite reached such a score. The utmost score was 63.5% for the composite of “Teamwork within Units.” Followed by a score of 56.4% for the “organizational learning and continuous improvement” composite and a score of 49.2% for the “supervisor/manager expectations and actions promoting PS” composite. These three composites could be considered as areas with potential for improvement. These findings were in line with a study in Jordan 2015 [Citation28] with score of 78.8% for “Teamwork within Units” composite. According to Reason’s model of PSC, [Citation29] teamwork is revealing the degree of collaboration, cooperation, and mutual respect among personnel working in the same environment. On other hand, lower score (36.7%) was given to “Teamwork across the Units” composite. This finding was in line with the Jordanian study in 2015 [Citation28]. Difficulty in working with staff from other units, is translated by lack of harmonization between the hospital’s departments. This may increase the chances of errors and AEs [Citation30]. ”Organizational learning-continuous improvement” composite had the highest score (51.0%) by Salem et al in 2019 [Citation15].
The lowest reported score (12.0%) was for “Non-Punitive Response to Errors” composite. This is similar to the scores of 16.0% by Salem et al in 2019 [Citation15], 19.8% by Aboul- Fotouh et al in 2012 [Citation31], 21.0% in Jordanian study in 2015, [Citation28] and 26.8% in a Saudi Arabian study in 2014 [Citation32]. However, higher score (44.0%) was reported in a study in USA hospitals 2010 [Citation25]. The Low score of this composite features the nearness of fault and disgrace culture and the correctional reactions to mistakes [Citation30].
The composite score for “Handoffs and Transitions” composite was 19.4%. It is near to the score of 24.0% reported by Salem et al in 2019 [Citation15]. However, lower than scores reported by studies in Jordan 2015 [Citation28] and in Egypt 2020 [Citation19]. The low score of this composite indicates that the majority of patients’ problems occur during shift exchanges.
Similar to previous PSC studies [Citation21,Citation32], clinical work force staffing is a territory that need improvement around the world. In the present investigation, the members whined of staff deficiency, long working hours and therefore more reliance on brief and under preparing attendants who are skilled enough. Numerous examinations uncovered that the staff lack prompts an expansion in outstanding burden that consequently lead to more medical errors [Citation33–36].
The overall PS grade was rated acceptable by 45.8% of the study participants. This is similar to Salem et al in 2019 [Citation15], where the overall PS grade was rated acceptable by 47.5% of its participants. On the other hand, in Alahmadi study in 2010 [Citation22] the overall PS grade was rated very good or excellent by two thirds of participants. This distinction in scores could be identified with the fluctuating procedures embraced to improve quality and security of medicinal services administrations.
The composite score for “Frequency of Events Reported” composite was 28.6%. Similarly, El-Sherbiny et al in 2020, [Citation19] reported a score of 30.4%. However, lower score (6.0%) was reported by Salem et al in 2019. [Citation15]Reporting of events is not frequent at the ICUs and it happens more for sentinel events. Thus, reporting is not reflecting the actual number of errors. There are possibly many reasons for underreporting of events including fear, the presence of a punitive response to errors besides believing that reporting would not usually result in an actual change [Citation28].The percentage of participants agreed on reporting one to two reports over the last 12 months was 45.8%.In comparison, higher score was found in a study in Iran 2017 [Citation18], where 63.0% of its participants mentioned reporting one to two reports in the last 12 months. This distinction could be ascribed to the diverse in settings, number of members and PS activities.
5. Limitations of the study
The used convenience sampling method was grounded on choosing willing participants who were available at the time of data gathering. The low Response rate (57.0%) could be explained by high work load and the busy working area. Data collected was based on participants’ self-report. Fear of penalties may affect the accuracy in completing the questionnaire. This was lessened by anonymous questionnaires. Also, PSC needed to be viewed from other healthcare givers’ perception for example; under training nursing students, pharmacists and from patients’ perception as well.
6. Conclusion and recommendation
The current study shows that the grade of PS is generally low at AMUH ICUs. No composite had a score higher than 75%, and 10 out of 12 composites represented scores lower than 50%. All PSC composites need improvement starting with regular assessment of PSC along with continuous monitoring and increasing the healthcare providers’ awareness of demanded PSC. Training paramedical students on skills supporting PSC is strongly recommended. Usage of proactive risk management that focus on the errors in the system or process, rather than individual’s fault. It is also, recommended to generate an internet-based AEs reporting system available all day long that permits the healthcare workers to namelessly report incidents.
Disclosure statement
No potential conflict of interest was reported by the authors.
Additional information
Notes on contributors
Eman Samy Ibrahim Foda
Eman Samy Ibrahim Foda Assistant lecturer of Public Health, Preventive and Social Medicine, Community Medicine Department, Faculty of Medicine Alexandria University, Egypt.
Afaf Gaber Ibrahim
Afaf Gaber Ibrahim Professor of Public Health, Preventive and Social Medicine, Community Medicine Department, Faculty of Medicine, Alexandria University, Egypt.
Aida Mohey Mohamed Ali
Aida Mohey Mohamed Ali Professor of Public Health, Preventive and Social Medicine, Community Medicine Department, Faculty of Medicine, Alexandria University, Egypt.
Ahmed Moustafa El-Menshawy
Ahmed Moustafa EL-Menshawy Lecturer of Critical Care Medicine, Faculty of Medicine,Alexandria University, Egypt
Heba Mahmoud Taha Elweshahi
Heba Mahmoud Taha Elweshahi Assistant Professor of Public Health, Preventive and Social Medicine, Community Medicine Department, Faculty of Medicine, Alexandria University, Egypt.
References
- Godycki-Cwirko M, Esmail A, Dovey S, et al. Patient safety initiatives in Central and Eastern Europe: A mixed methods approach by the LINNEAUS collaboration on patient safety in primary care. Europ J General Pract. 2015 Aug 14; 21(sup1):62–68.
- de Bienassis K, Kristensen S, Burtscher M, et al. Culture as a cure: Assessments of patient safety culture in OECD countries; 2020
- Slawomirski L, Auraaen A, Klazinga N. The economics of PS: strengthening a value-based approach to reducing patient harm at national level. Econ Patient Saf. March 2017;96.
- National Academies of Sciences. Engineering, and medicine. Crossing the global quality chasm: improving health care worldwide. Washington (DC): The National Academies Press; 2018.
- Jha AK, Larizgoitia I, Audera-Lopez C, et al. The global burden of unsafe medical care: analytic modelling of observational studies. BMJ Qual Saf. 2013;22:809–815.
- Sorra J, Gray L, Streagle S. AHRQ hospital survey on patient safety culture: user’s guide. Rockville, MD: Agency for Healthcare Research and Quality; 2016.
- Keers RN, Williams SD, Cooke J, et al. Causes of medication administration errors in hospitals: a systematic review of quantitative and qualitative evidence. Drug Saf. 2013 Nov 1;36(11):1045–1067.
- Ausserhofer D, Schubert M, Desmedt M, et al. The association of patient safety climate and nurse-related organizational factors with selected patient outcomes: a cross-sectional survey. Int J Nurs Stud. 2013 Feb 1;50(2):240–252.
- Morello RT, Lowthian JA, Barker AL, et al. Strategies for improving patient safety culture in hospitals: a systematic review. BMJ Qual Saf. 2013 Jan 1;22(1):11–18.
- Anderson JE, Kodate N, Walters R, et al. Can incident reporting improve safety? Healthcare practitioners’ views of the effectiveness of incident reporting. Int J Qual Health Care. 2013 Apr 1;25(2):141–150.
- Gonçalves LA, Andolhe R, Oliveira EM, et al. Nursing allocation and adverse events/incidentes in intensive care units. Rev Esc Enferm USP. 2012;46:71–77.
- Sorra J, Famolaro T, Dyer N, et al. Hospital survey on patient safety culture: comparative database report. Rockville, MD: Agency for Healthcare Research and Quality; 2009.
- IBM Corp. Released 2012. IBM SPSS Statistics for Windows, version 21.0. Armonk, NY: IBM Corp
- Sharabi M, Davidow M. Service quality implementation: problems and solutions. Int J Qual Serv Sci. 2010 Jul 6;2:189–205.
- Salem M, Labib J, Mahmoud A, et al. Nurses’ perceptions of patient safety culture in intensive care units: a cross-sectional study. Open Access Maced J Med Sci. 2019 Nov 15;7(21):3667–3672.
- El-Shabrawy EM, Anwar MM, Mostafa ZM. Assessment of patient safety culture among health care workers in Beni-Suef University Hospital, Egypt. Egypt J Community Med. 2017;35(3):11–19.
- Ballangrud R, Hedelin B, Hall-Lord ML. Nurses’ perceptions of patient safety climate in intensive care units: a crosssectional study. Intensive Crit Care Nurs. 2012;28(6):344–354.
- Farzi S, Moladoost A, Bahrami M, et al. Patient safety culture in intensive care units from the perspective of nurses: a cross-sectional study. Iran J Nurs Midwifery Res. 2017 Sep;22(5):372.
- El-Sherbiny NA, Ibrahim EH, Abdel-Wahed WY. Assessment of patient safety culture among paramedical personnel at general and district hospitals, Fayoum Governorate. Egypt J Egypt Public Health Assoc. 2020;95:4.
- Ghobashi MM, Mosleh EHA, Al-Doseri FA. Assessment of patient safety culture in primary health care settings in Kuwait. Epidemiol Biostatistics Public Health. 2014;11(3):1–5.
- Jardali F, Jaafar M, Dimassi H, et al. The current state of patient safety culture in Lebanese hospitals: a study at baseline. Int J Qual Health Care. 2010;22(5):386–395.
- Alahmadi HA. Assessment of patient safety culture in Saudi Arabian hospitals. Qual Saf Health Care. 2010 Oct 1;19(5):e17.
- Nie Y, Mao X, Cui H, et al. Hospital survey on patient safety culture in China. BMC Health Serv Res. 2013;13:228.
- Chen IC, Li HH. Measuring patient safety culture in Taiwan using the hospital survey on patient safety culture (HSOPSC). BMC Health Serv Res. 2010;10:152.
- Westat R, Sorra J, Famolaro T, et al. Hospital survey on patient safety culture: 2010 user comparative database report. Agency for Healthcare Research and Quality US Department of Health and Human Services; 2010. [accessed 2020 September]. https://www.ahrq.gov/sops/surveys/hospital/index.html
- Wagner C, Smits M, Sorra J, et al. Assessing patient safety culture in hospitals across countries. Int J Qual Health Care. 2013;25(3):213–221.
- World Health Organization. Regional Office for the Eastern Mediterranean. Report on the workshop on discussion of the results of the patient safety study and their dissemination for policy change, Alexandria, Egypt, 28-31 January 2008. https://apps.who.int/iris/handle/10665/115980
- Khater WA, Akhu-Zaheya LM, Al-Mahasneh SI, et al. Nurses’ perceptions of patient safety culture in Jordanian hospitals. Int Nurs Rev. 2015;62:82–91.
- Berger Z, Flickinger TE, Pfoh E, et al. Promoting engagement by patients and families to reduce adverse events in acute care settings: a systematic review. BMJ Qual Saf. 2014 Jul 1;23(7):548–555.
- Sammer CE, Lykens K, Singh KP, et al. What is patient safety culture? A review of the literature. J Nurs Scholarship. 2010;42:156–165.
- Aboul-Fotouh A, Ismail N, Ez Elarab H, et al. Assessment of patient safety culture among healthcare providers at a teaching hospital in Cairo, Egypt. A.M. EMHJ. 2012;18:4.
- El-Jardali F, Sheikh F, Garcia NA, et al. Patient safety culture in a large teaching hospital in Riyadh: baseline assessment, comparative analysis and opportunities for improvement. BMC Health Serv Res. 2014;14:122.
- Shahril Abu Hanifah M, Ismail N. Fatigue and its associated risk factors: a survey of electronics manufacturing shift workers in Malaysia. Fatigue: Biomed, Health Behavior. 2020 Jan 2;8(1) :49–59.
- Friesdorf W, Buss B, Marsolek I. Patient safety by treatment standardization and process navigation – a systems ergonomics management concept. Theor Issues Ergon Sci. 2007;8:469–479.
- Hayajneh YA, Abualrub RF, Almakhzoomy IK. Adverse events in Jordanian hospitals: types and causes. Int J Nurs Pract. 2010;16:374–380.
- Ross J. Understanding patient safety culture: part I. J Peri-Anesthesia Nurs. 2011;26:170–172.