
ABSTRACT
Aim of the study
This study aims to investigate the nonalcoholic fatty liver disease (NAFLD) serum molecular profile among individuals diagnosed with type 2 diabetes (T2DM).
Methods
In this observational case-control investigation, 120 participants were included and subdivided forming 4 different groups as follows: group І: NAFLD non diabetic individuals, group ІІ: T2DM without NAFLD patients, group III: NAFLD diabetic patients and group IV: healthy control. MALAT1 and MEG3 expression in serum from all groups was measured.
Results
Expression of MALAT1 was upregulated in NAFLD and diabetic patients (p = 0.037 and 0.033 respectively). The cutoff value was determined for MALAT1 expression in NAFLD and diabetic by the ROC curve and was > 0.54 and > 0.67 respectively. By multivariate analysis, the only reliable indicator for MALAT1 expression in NAFLD and diabetics was determined to be ESR. Furthermore, we found that NAFLD patients showed greater MEG3 expression than those with T2DM (p = 0.033).
Conclusion
Expression of MALAT1 was upregulated in NAFLD and T2DM indicating that it might be an early diagnostic marker for both diseases and helps in the development of novel therapeutic agents. Moreover, MEG3 expression was higher among NAFLD patients than those NAFLD patients with T2DM, which suggests the feasibility of decreased MEG3 expression could be a viable predictive biomarker for early T2DM detection among NAFLD-diagnosed patients.
1. Introduction
NAFLD prevalence, which is considered one of the most frequent liver disorders, is becoming a world wide public health concern. When fat accounts for more than 5 to 10% of the liver’s weight, the disease arises.It may cause cirrhosis, hepatocellular cancer (HCC), and hepatic fibrosis, which would increase mortality and morbidity. Therefore, indicators for the diagnosis of NAFLD are urgent needs [Citation1]. According to age, sex, and ethnicity, NAFLD prevalence may differ. Actually, it appears that aging is connected with the rise in both the NAFLD prevalence and liver disease stage [Citation2]. In addition, men have a two times greater frequency of NAFLD than women [Citation3,Citation4].
Diabetes mellitus (DM) has become a serious health issue worldwide. It is characterized by a chronic hyperglycemia state and disturbance in the metabolism of carbohydrates, fat, and protein. It is related to the deficiency of absolute or relative insulin secretion and/or insulin action, which is controlled by a variety of factors, including inherited and environmental influences.It affects the vascular system and leads to micro and macroangiopathy [Citation5].
People with type 2 DM (T2DM) have a very high NAFLD prevalence. In fact, according to some research, NAFLD affects between one-third and two-thirds of diabetic individuals [Citation6,Citation7]. Estimates from several research have revealed that T2DM patients who are asymptomatic have a high burden of advanced fibrosis, ranging from 5% to 7% [Citation6,Citation7]. Patients with NAFLD frequently have high blood levels of triglycerides (TG) and low serum high-density lipoprotein (HDL) levels. It is believed that 50% of people with dyslipidemia who visit lipid clinics develop NAFLD [Citation8,Citation9].
Moreover, there is a clear link between NAFLD and the risk of DM. If someone has NAFLD, their chance of acquiring DM increases by around 5-fold [Citation10]. Additionally, it has been shown that improved NAFLD lowers the risk of acquiring DM.[10]Till now; it is unpredictable which people with NAFLD will acquire DM [Citation11].
To better understand the molecular basis of NAFLD, gene expression profiling has long been used [Citation12,Citation13]. The existence of NAFLD has been linked to DNA methylation modification and gene expression alteration [Citation14].
The study’s purpose was to examine NAFLD serum molecular profile in T2DM patients and controls using RT-qPCR to identify a disease-serum molecular profile that may be validated for early NAFLD diagnosis in T2DM patients while also introducing novel screening and diagnostic methods.
2. Materials and methods
After giving their signed informed consent; this case-control study was including 120 participants subdivided forming four different groups at Alexandria University’s Internal Medicine Department; group І: 30 adult NAFLD nondiabetic patients, group ІІ: 30 adult T2DM patients without NAFLD, group III: 30 adult NAFLD with T2DM and group IV: 30 healthy subjects.
Exclusion criteria included chronic liver disease, a recent traumatic or surgical history, hematological disorders or malignancy, chronic inflammatory or autoimmune related diseases, a recent severe significant infection history at the study admission time, CKD with eGFR 60 ml/min per 1.73 m2, and also alcoholics.
All participants had their height and weight assessed in order to determine their body mass index (BMI). The superior iliac crest and the lower rib border were used to estimate the waist circumference. A mercury sphygmomanometer was also used for systolic and diastolic blood pressure measuring.
This study adhered to our institution’s human subject’s ethical guidelines as well as the Helsinki Declaration.The Alexandria University Faculty of Medicines Ethics Committee is responsible for offering ethical approval with reference number IRB NO: 00012098 – NAW NO: 00018699.
2.1. Laboratory investigations
A Biosystem (BTS350) analyzer was used to measure each participant’s fasting blood glucose and insulin level, complete profile of lipids, tests of liver function, C reactive protein (CRP), and serum-involved uric acid.The Modification of Diet in Renal Disease (MDRD) equation was employed to obtain the estimated GFR. Individuals’ insulin resistance was measured using the Homeostatic Model Assessment for Insulin Resistance (HOMA-IR).Also, complete blood count (CBC)was measured by MINDRAY BC-3000 plus analyzer, glycated hemoglobin (HbA1C) was measured by Mispa-i2 analyzer, and erythrocyte sedimentation rate (ESR).
2.2. Genomic study
According to the manufacturer’s recommendations, the RNeasy Mini kit was used to extract RNA from serum. (catalog # 217004, Qiagen, Germany). The samples of RNA were kept at −80°C before being used. Total RNA Reverse transcription to single-stranded cDNA was performed by the use of a thermal cycler (Simpli Amp, Applied Biosystems, Thermo Scientific, USA) configured according to the manufacturer’s instructions using the High-Capacity Transcription kit of cDNA Reverse transcription. (catalog # 4375575, Applied Biosystems, USA). Using a (RT-qPCR), the MALAT1 and MEG3 gene expressions were determined.Quantification and analysis were carried out on the STRATAGENE MX3005P real time QPCR system (Sigma-Aldrich, USA) according to manufacturer instructions. To determine relative expression, the target gene expression was normalized first to that of the G6PD mRNA house keeping gene and then determined using the 2−ΔΔCT method. Each response assay plate also underwent non-template control (NTC) procedures.
3. Results
Regarding demographic data and risk factors of the four studied groups (), there was a statistically significant difference among the four study groups concerning age (p < 0.001*). In terms of the risk factors prevalence, there was a difference with statistical significance between the four included study groups concerning BMI (p = 0.13) and hypertension (p = 0.032). However, a difference with no statistical significance was found among the four groups in terms of gender, and smoking.
Table 1. Comparison between the different studied groups according to demographic data and prevalence of risk factors.
Diabetic patients, without NAFLD (group II) or with NAFLD, (groups III(showed significantly increased ESR, FBS, and HbA1c than patients with NAFLD only (group I).Also, they showed significantly increased GFR, fasting insulin, and HOMA IRthan controls (group IV). ()
Table 2. Comparison between the different studied groups according to ESR, CRP, FBS, HbA1c, Fasting insulin, HOMA-IR, Total cholesterol, HDL, LDL, TG, AST, ALT, serum uric acid, and eGFR.
Table 3. Comparison between the different studied groups according to MALAT1 and MEG3 genes expression.
The expression of the MALAT1 and MEG3 genes was assessed among the research-involved groups (). A difference with no statistical significance was found as regards MALAT1 expression among the four studied groups (p = 0.085). However, a statistically significant difference was observed regarding MEG3 expression among the four groups (p = 0.007). Groups I (NAFLD) and II (T2DM) showed higher MEG3 gene expression than group IV (controls). Also, MEG3 gene expression was higher significantly among group I (NAFLD) than in group III (NAFLD with diabetes) (p = 0.033).
Table 4. univariate and multivariate Linear regression analysis for the parameters affecting MALAT gene expression (n = 60) for NAFLD patient group (I + III).
Table 5. Univariate and multivariate Linear regression analysis for the parameters affecting MALAT gene expression (n = 60) for diabetic patient group (II + III).
Table 6. Univariate and multivariate Linear regression analysis for the parameters affecting MEG gene expression (n = 60) for NAFLD patient group (I + III).
Table 7. Univariate and multivariate Linear regression analysis for the parameters affecting MEG gene expression (n = 60) for diabetic patient group (II + III).
Furthermore, NAFLD patients (groups I and III together) displayed significantly higher MALAT1 and MEG3 gene expression when compared with the study-involved controls (p = 0.037 and 0.007, respectively). Additionally, compared to the control, only MALAT1 expression, but not MEG3 gene expression, was significantly higher among diabetic patients (groups II and III together) (p = 0.033). (Supplementary data)
3.1. Validity of MALAT1 and MEG 3 genes expression to discriminate between patients and controls
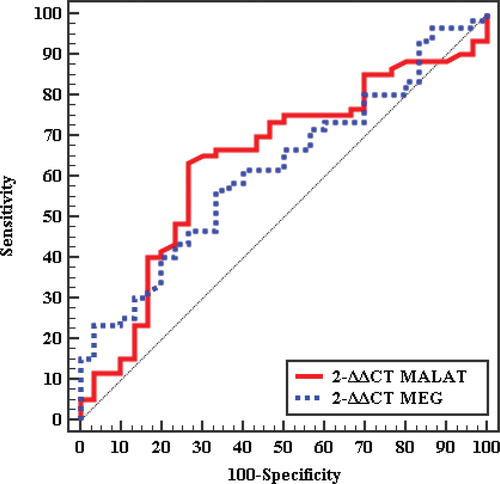
In , the receiver operating curve (ROC) shows the cutoff value for MALAT1 expression to diagnose NAFLD patients was > 0.54 with an 0.635 detected area under the curve (AUC),71.67% sensitivity, and 53.33% specificity. The cutoff value for MEG 3 expression to diagnose NAFLD patients was > 1.197 with an 0.676 AUC and 61.67% sensitivity and 73.33% specificity.The cutoff value for MALAT1 expression to distinguish between diabetic patients from the control group was also determined by the ROCcurve and the cutoff was > 0.67 with 0.639AUC, 70% sensitivity,and 56.67% specificity.
Figure 1. Right figure shows ROC curve for MALAT1 and MEG3 genes expression to discriminate diabetic patient (groups II & III) from controls while left figure shows ROC curve for MALAT1 and MEG3 genes expression to discriminate NAFLD patient (groups I & III) from controls.
3.2. Linear regression analysis
In univariate analysis, ESR and CRP were significant predictors of MALAT1 gene expression in both NAFLD (group I & III), () and diabetic (group II & III), () patients, and FBS, and GGTin NAFLD patients. In multivariate analysis, ESR only was associated with MALAT1 gene expression and it was the only reliable indicator of MALAT1 gene expression in patients with NAFLD and diabetes. Also, in univariate analysis, HDL and Hb were significant predictors of MEG3 gene expression in NAFLD (group I & III), () and age, total cholesterol, and LDL in diabetic (group II & III), () patients. In multivariate analysis, Hb only was associated with MEG3 gene expression in NAFLD patients.
3.3. Correlation study
A detailed correlation analysis of MALAT1 and MEG3 expression was done with numerous clinical and biochemical parameters of the study participants and was summarized in the supplementary Tables . In diabetic individuals (groups II & III), MALAT1 gene expression was correlated positively with eGFR and inversely correlated with ESR. Additionally, in controls (group IV), MALAT1 expression had a positive correlation with HbA1 and a negative correlation with AST.The MEG3 expression was inversely correlated with age in diabetic patients (groups II & III), ESR in NAFLD patients (groups I & III), and total cholesterol and LDL in diabetic without NAFLD patients (group II). (:7)
4. Discussion
NAFLD affects up to 20% of the general population and may be up to 90% of those adults with obesity. Steatosis, hepatitis, and fibrosis are among the vast range of lesions that NAFLD may cause different degrees of these three types of lesions might develop in the same patient. Fibrosis may proceed to cirrhosis and HCC in 20% and 10% of cases, respectively [Citation15]. NAFLD is most prevalent in the Middle East and South America, where as it is least prevalent in Africa. The following: obesity (51.34%), T2DM (22.51%), dyslipidemia (69.16%), hypertension (39.34), and metabolic syndrome (42.54%) were all among the metabolic comorbidities linked with NAFLD [Citation16].
There is a clear association between both NAFLD and diabetes risk. If a person has NAFLD, their chances of acquiring diabetes rise by around 5-fold. The NAFLD and T2DM association may be described by insulin resistance, dyslipidemia, and hepatic TG buildup in NAFLD, as well as a dysfunctional B-cell among those with T2DM. People with T2DM are more likely than healthy people to develop significant liver diseases such as cirrhosis, fibrosis, and HCC [Citation17].
The major study purpose was to evaluate the NAFLD-related serum molecular profile of T2DM patients and healthy controls using (RT-qPCR) and to identify a disease-specific pattern that can be validated for early detection of NAFLD in T2DM, thereby providing a potential screening and diagnostic tool.
In the current investigation, all diabetes-diagnosed patients (groups II and III) had substantially higher BMI and waist (p = 0.006 and < 0.001 respectively). According to Prasad and Gupte S. et al, [Citation18] who studied 30 patients with T2DM and 32 controls, patients diagnosed with diabetes had significantly greater BMI and waist circumference than controls (p = 0.015 and p= <0.001, respectively).
In this study, there were no statistically significant differences in lipid profile, functions of the liver, and uric acid across all groups. In contrast to our findings, Shrestha N, and Bhatt NP et al. [Citation19] studied 100 patients, 62 (62%) male, and 38 (38%) female. Based on their ALT levels, the patients were subdivided forming two groups: those with normal ALT levels and others with elevated levels of ALT, and it was discovered that NAFLD patients reported significantly increased levels of ALT (p = 0.001) but no significant rise in AST or GGTlevels. The difference between their study and ours may be attributed to different inclusion criteria and ethnic populations.
A lot of studies show that diabetics have considerably higher levels of transaminases than non-diabetics, especially with NAFLD [Citation20,Citation21]. In contrast to our findings, Shrestha N and Bhatt NP et al [Citation19] discovered a significant increase statistically in both serum ALT and GGT among diabetic patients in comparison to the involved controls in their study which include 105 patients newly diagnosed with T2DM without a liver disease history, with p = 0.003 and p = 0.001, respectively. The variation between their and our investigations might be attributed to differences in inclusion criteria and ethnic populations.
Long non-coding RNAs (lncRNAs) are increasingly becoming recognized as contributors to biological processes that influence disease pathophysiology in humans. For many years, researchers have been studying the lncRNAs’ role in obesity, T2DM, and related comorbidities such as NAFLD development [Citation22]. In the current investigation, there was a relation of statistical significance among MALAT1, MEG3 gene, and T2DM. Expression of the MALAT1 gene was substantially greater among patients diagnosed with diabetes (groups II&III) than among those control-involved participants (p = 0.033). Also, group II (diabetic patients only) showed higher MEG3 gene expression than controls (p = 0.043). In agreement with our study, Prasad and Gupte S. et al. [Citation18] discovered that patients with diabetes had considerably higher MALAT1 and MEG3 levels of gene expression than controls. (p < 0.05).
The expression of MALAT1 gene in this investigation was increased significantly among all patients diagnosed with NAFLD (group I&III) than among the controls (p = 0.037) and the expression of MEG3 was significantly increased among the NAFLD diagnosed groups (group I&III) than those considered as controls (p = 0.037). Also, the MEG3 expression was significantly increased among those involved in group I (NAFLD) than in group III (NAFLD with diabetes) (p = 0.033).
In agreement with our study, Yu F and Lu Z et al. [Citation23] revealed that MALAT1 gene expression was upregulated in both liver fibrotic tissues and hepatic stellate cells (HSCs) which are activated. There was also a negative loop of feedback between levels of MALAT1 and also miR-101b. Different inclusion criteria may account for the disparity between their study and ours. Kim Ya and Park KK et al. [Citation24] showed that MALAT1 improves hepatic steatosis and insulin resistance by enhancing the SREBP-1c protein nuclear stability. Also, Leti F and Legendre C et al. [Citation25] found that MALAT1 expression upregulation may contribute to NAFLD development via processes involving inflammatory chemokines. In contrast to our study, Khalifa O and Errafi K et al. [Citation26] revealed that MEG3 expression was decreased in correlation with the NAFLD progression. The difference between their study and ours may be attributed to different inclusion criteria, ethnic populations, and sample size.
5. Conclusion
We concluded that MALAT1 expression was upregulated in NAFLD and diabetic patients which suggests the possibility to be an early diagnostic marker for both diseases that helps in the development of novel therapeutic agents. In NAFLD and diabetic individuals, ESR was revealed to be the sole significant predictor of MALAT1 gene expression. Furthermore, the expression of MEG3 was greater among NAFLD patients than those having NAFLD with T2DM, implying that decreasing MEG3 expression might be considered a possible predictive biomarker for early T2DM diagnosis in NAFLD patients.
Biographical state
Please include a brief biography for each author. This might be a brief (no more than 200 words) copy of your department’s website or an academic networking page.
Supplemental Material
Download ()Disclosure statement
The authors declare that there are no stated conflicts of interest.
Supplementary material
Supplemental data for this article can be accessed online at https://doi.org/10.1080/20905068.2023.2251221
Additional information
Notes on contributors
Eman Yousef Moursi
Eman Yousef Moursi Professor at Internal Medicine department, Faculty of Medicine, Alexandria University. Dr Eman has experience and multiple publications in the field of Internal medicine and Diabetes.
Pacint Elsayed Moez
Pacint ElSayed Moez Professor of Clinical Pathology Faculty of Medicine Alexandria University. Professor Moez is also the Director of Medical Research Centre and Executive Director of Proteomics Lab.
Ehab Mostafa Hassouna
Ehab Mostafa Hassouna Professor of Internal Medicine, Faculty of Medicine, Alexandria University, Egypt. Prof Ehab has experience and multiple puplications in the field of Internal Medicine and Hepatobiliary diseases.
Eman Zakareya Elkemary
Eman Zakareya ElKemary Lecturer at Clinical and Chemical Pathology department, Faculty of Medicine, Alex University. Dr. Eman has experience and multiple publications in the field of clinical chemistry and molecular biology.
Geilan Mahmoud Marei
Geilan Mahmoud Marei Assistant Colleague of Internal Medicine department and Specialist in Clinical Nutrition, Faculty of Medicine, Alexandria University, Egypt. Dr Geilan has experience in the field of Internal Medicine and Clinical Nutrition.
Mohammed Said Sayed Shater
Mohammed Said Sayed Shater Lecturer of Internal Medicine, Faculty of Medicine, Alexandria University, Egypt. Dr Mohammed has experience and multiple puplications in the field of Internal Medicine and Hepatobiliary diseases.
Mai Hesham Mohammed Badrah
Mai Hesham Mohammed Badrah Assistant Professor at Internal Medicine department, Faculty of Medicine, Alexandria University. Dr Mai has experience and multiple publications in the field of Internal medicine and Diabetes.
References
- Pouwels S, Sakran N, Graham Y, et al. Non-alcoholic fatty liver disease (NAFLD): a review of pathophysiology, clinical management and effects of weight loss. BMC Endocr Disord. 2022;22(1):63. doi: 10.1186/s12902-022-00980-1
- Younossi ZM. Non-alcoholic fatty liver disease - a global public health perspective. J Hepatol. 2019;70(3):531–544. doi: 10.1016/j.jhep.2018.10.033
- Henry L, Paik J, Younossi ZM. Review article: the epidemiologic burden of non-alcoholic fatty liver disease across the world. Aliment Pharmacol Ther. 2022;56(6):942–956. doi: 10.1111/apt.17158
- Younossi ZM, Marchesini G, Pinto-Cortez H, et al. Epidemiology of nonalcoholic fatty liver disease and nonalcoholic steatohepatitis: implications for liver transplantation. Transplantation. 2019;103(1):22–27. doi: 10.1097/TP.0000000000002484
- Ramraj B, Duraisamy R, Kumar MPS. Complications of diabetes mellitus: a review. Drug Invent Today. 2019;12:98–103.
- Mallet V, Parlati L, Martinino A, et al. Burden of liver disease progression in hospitalized patients with type 2 diabetes mellitus. J Hepatol. 2022;76(2):265–274. doi: 10.1016/j.jhep.2021.09.030
- García-Compeán D, Kumar R, Cueto-Aguilera Á ND, et al. Body weight loss and glycemic control on the outcomes of patients with NAFLD. The role of new antidiabetic agents. Annals Of Hepatology. 2022;28(4):100751. doi: 10.1016/j.aohep.2022.100751
- Martínez-Arranz I, Bruzzone C, Noureddin M, et al. Metabolic subtypes of patients with NAFLD exhibit distinctive cardiovascular risk profiles. Hepatology. 2022;76(4):1121–1134. doi: 10.1002/hep.32427
- Martin A, Lang S, Goeser T, et al. Management of dyslipidemia in patients with non-alcoholic fatty liver disease. Curr Atheroscler Rep. 2022;24(7):533–546. doi: 10.1007/s11883-022-01028-4
- Chung W, Promrat K, Wands J. Clinical implications, diagnosis, and management of diabetes in patients with chronic liver diseases. World J Hepatol. 2020;12(9):533–557. doi: 10.4254/wjh.v12.i9.533
- Mantovani A, Petracca G, Beatrice G, et al. Non-alcoholic fatty liver disease and risk of incident diabetes mellitus: an updated meta-analysis of 501 022 adult individuals. Gut. 2021;70(5):962–969. doi: 10.1136/gutjnl-2020-322572
- Hoang SA, Oseini A, Feaver RE, et al. Gene expression predicts histological severity and reveals distinct molecular profiles of nonalcoholic fatty liver disease. Sci Rep. 2019;9(1):12541. doi: 10.1038/s41598-019-48746-5
- Cai C, Song X, Yu C. Identification of genes in hepatocellular carcinoma induced by non-alcoholic fatty liver disease. Cancer Biomark. 2020;29(1):69–78. doi: 10.3233/CBM-190169
- Hyun J, Jung Y. DNA methylation in nonalcoholic fatty liver disease. Int J Mol Sci. 2020;21(21):8138. doi: 10.3390/ijms21218138
- Dhamija E, Paul SB, Kedia S. Non-alcoholic fatty liver disease associated with hepatocellular carcinoma: an increasing concern. Indian J Med Res. 2019;149(1):9–17. doi: 10.4103/ijmr.IJMR_1456_17
- Abdo Gabali M, SAEED O. Study of prevalence of nonalcoholic fatty liver disease in type II diabetes mellitus patients and variations in liver enzymes and lipid profile in diabetic patients with fatty liver in comparison with patients without fatty liver. Med J Cairo Univ. 2019 March;87(March):687–691. doi: 10.21608/mjcu.2019.52525
- Gutiérrez-Cuevas J, Lucano-Landeros S, López-Cifuentes D, et al. Epidemiologic, genetic, pathogenic, metabolic, epigenetic aspects involved in NASH-HCC: current therapeutic strategies. Cancers (Basel). 2022;15(1):23. doi: 10.3390/cancers15010023
- Prasad K, Gupte S. Non alcoholic fatty liver disease (NAFLD) in type 2 diabetes mellitus patients-significance of ALT. Int J Health Clin Res. 2014;3(12):281–283.
- Shrestha N, Bhatt NP, Neopane P, et al. Hepatic involvement with elevated liver enzymes in Nepalese subjects with type 2 diabetes mellitus. Int J Biochem Res Rev. 2017;16(1):1–8. doi: 10.9734/IJBCRR/2017/31935
- Cai J, Zhang XJ, Ji YX, et al. Nonalcoholic fatty liver disease pandemic fuels the upsurge in cardiovascular diseases. Circ Res. 2020;126(5):679–704. doi: 10.1161/CIRCRESAHA.119.316337
- Anoop S, Misra A, Bhatt SP, et al. High fasting C-peptide levels and insulin resistance in non-lean & non-obese (BMI >19 to < 25 kg/m(2)) Asian Indians with type 2 diabetes are independently associated with high intra-abdominal fat and liver span. Diabetes Metab Syndr. 2019;13(1):708–715. doi: 10.1016/j.dsx.2018.11.041
- Sathishkumar C, Prabu P, Mohan V, et al. Linking a role of lncRnas (long non-coding RNAs) with insulin resistance, accelerated senescence, and inflammation in patients with type 2 diabetes. Hum Genomics. 2018;12(1):41. doi: 10.1186/s40246-018-0173-3
- Yu F, Lu Z, Cai J, et al. MALAT1 functions as a competing endogenous RNA to mediate Rac1 expression by sequestering miR-101b in liver fibrosis. Cell Cycle. 2015;14(24):3885–3896. doi: 10.1080/15384101.2015.1120917
- Kim YA, Park KK, Lee SJ. LncRNAs act as a link between chronic liver disease and hepatocellular carcinoma. Int J Mol Sci. 2020;21(8):2883. doi: 10.3390/ijms21082883
- Leti F, Legendre C, Still CD, et al. Altered expression of MALAT1 lncRNA in nonalcoholic steatohepatitis fibrosis regulates CXCL5 in hepatic stellate cells. Transl Res. 2017;190:25–39. doi: 10.1016/j.trsl.2017.09.001
- Khalifa O, Errafii K, Al-Akl NS, et al. Noncoding RNAs in nonalcoholic fatty liver disease: potential diagnosis and prognosis biomarkers. Dis Markers. 2020;2020:8822859. doi: 10.1155/2020/8822859