
ABSTRACT
Ecosystem accounting has become one of the key components in the revision of international statistical standards. Expansion of the System of Environmental-Economic Accounting for ecosystem services follows the rapid progress of science in this area as well as expanding applications to sustainability challenges. In this contribution, we discuss approaches to accounting of ecosystem assets as a natural capital basis that is critical for ecosystem service delivery. Based on examples from the Czech Republic, a Central European country, we illustrate the construction of ecosystem extent accounts based on the methodology of Land and Ecosystem Accounting. This analysis is complemented by monetary ecosystem asset accounting through quantification of the present value of future ecosystem service flows. Ecosystem condition is represented by the Mean Species Abundance indicator, which gauges the direction of ecosystem naturalness. Based on the demonstration of approaches to ecosystem asset accounting, we discuss selected aspects of ecosystem condition measurements, valuation, and policy implications of ecosystem asset accounting at the national level.
Introduction
During the past several years, substantial effort of both international organizations and scientific community has been devoted to the development of Experimental Ecosystem Accounting within the System of Environmental-Economic Accounting (SEEA) within the United Nations Statistical Division (Obst Citation2015; UN Citation2014a, 2014b). The SEEA framework was developed as a tool for analyzing the environment and its relationship to economic and other human activities (UN Citation2014a). It aims to integrate environmental data into standard measures of economic activity as recorded by the System of National Accounts (SNA).
The central framework of SEEA (SEEA CF) was adopted by the United Nations Statistical Commission (UNSC) in 2012. One year later, UNSC launched the SEEA Experimental Ecosystem Accounting (SEEA EEA) framework (UN Citation2014b). The SEEA CF starts from the perspective of the economy and its economic units and incorporates relevant environmental information concerning natural inputs, residual flows, and environmental assets. It is a multipurpose framework that describes the interaction between the economy and the environment, the stocks of environmental assets as well as changes in such stocks. On the other hand, SEEA EEA starts from the perspective of ecosystems and links ecosystems to economic and other human activities. It complements the SEEA CF as it reports flows of ecosystem services and changes in ecosystem assets and links this information to economic and other human activities.
A primary motivation for ecosystem accounting is that separate analysis of ecosystems and the economy does not adequately reflect the fundamental relationship between humans, the environment, and sustainability (Hecht Citation2005; Mäler, Aniyar, and Jansson Citation2008). In this context, SEEA EEA provides a platform for integration of relevant information on ecosystem extent, ecosystem condition, ecosystem services, and ecosystem capacity with information on economic and other human activities as well as the associated beneficiaries (households, businesses, and governments). This context responds to the growing demand for providing policy-relevant information in areas such as sustainable development.
Several countries have already implemented components of natural capital and ecosystem accounting. The Australian Bureau of Statistics established a System of Environmental-Economic Accounts, including environmental assets (ABS Citation2014). In the Netherlands, the Natural Capital Program is aimed at incorporating natural capital into decision-making in several domains involving a wide range of stakeholders (Ruijs and van Egmond Citation2017). Experimental Ecosystem Accounting was tested in Limburg province in the Netherlands by compiling biophysical and monetary ecosystem accounts (Remme et al. Citation2015). The UK Office for National Statistics released Ecosystem Service Accounts 1997–2015 based on provisioning, regulatory, and cultural services and also including natural capital asset valuation (ONS Citation2018). The development of SEEA EEA has been rapidly progressing in many countries (WAVES Citation2017). According to the Global Assessments on Environmental-Economic Accounting (Statistical Commission Citation2018), 69 countries have programs on environmental-economic accounting. In the majority of countries, consistent ecosystem accounting is still lacking. However, as indicated above, several countries and regions are already testing and experimenting with ecosystem accounts.
The aim of this article is to provide examples of approaches to ecosystem asset accounting at the national level. We illustrate the structure of national ecosystem asset accounts by using a Land and Ecosystem Accounting framework including monetary valuation of ecosystem services and ecosystem condition assessment represented by the Mean Species Abundance indicator. Asset accounts have been experimentally assembled for the area of the Czech Republic. We discuss aspects of further development and implementation of SEEA EEA at the national level.
Methods
In SEEA EEA, ecosystem assets are defined as spatial areas containing a combination of biotic and abiotic components and other characteristics that function together. This definition is consistent with the definition of ecosystem which is in SEEA EEA defined in accordance with the Convention on Biological Diversity as “a dynamic complex of plant, animal and micro-organism communities and their nonliving environment interacting as a functional unit” (UN Citation2014b). Biotic components comprise living components of ecosystems, such as flora, fauna, and micro-organisms. Abiotic components include non-living conditions such as soil, air, solar radiation, and water. Combination of biotic and abiotic components leads to ecosystem processes and functions, such as photosynthesis, primary productivity, nutrient cycling, or decomposition (UN Citation2014b) which are precondition for the generation of ecosystem services.
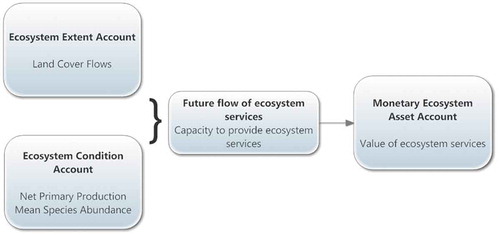
Ecosystem asset accounts encompass the ecosystem extent and condition account and the ecosystem asset account in monetary terms expressed as expected ecosystem service flows (UN Citation2014b; Hein et al. Citation2016; UN Citation2017) (). For the ecosystem extent biophysical account, we apply the Land and Ecosystem Accounting methodology (EEA Citation2006; Weber Citation2007). The ecosystem condition account is illustrated on the basis of the Mean Species Abundance (MSA) indicator, which has also been suggested as an approach to biodiversity accounting. The monetary ecosystem asset account is constructed based on the future expected flow of a basket of ecosystem services, where the value of ecosystem services is a function of ecosystem extent and the capacity of land cover types to provide services ().
Figure 1. Schematic depiction of the structure of ecosystem asset accounts
Ecosystem extent account
The purpose of ecosystem extent accounts is to give initial information on the extent of different ecosystems, to show trends in ecosystem area change, to provide information on ecosystem degradation, and to serve as the basis for other SEEA EEA accounts (UN Citation2017).
According to the SEEA EEA Technical Recommendations (UN Citation2017), ecosystem extent account compatible with the SEEA EEA will be similar in structure to land accounts from the SEEA Central Framework (SEEA CF) (UN Citation2014a) but will differ in the types of areas being accounted for. In practice, there is correspondence between land cover classes and ecosystem types. Therefore, the difference between ecosystem types and land cover classes rests usually at the level of mapping detail within the classification system. In this analysis, we used two equivalent land cover/ecosystem maps, the CORINE Land Cover (CLC) and the Consolidated Layer of Ecosystems of the Czech Republic (CLES) (Vačkář et al. Citation2018). CLES introduces more subtle classification of natural ecosystem types.
The ecosystem extent account can be at the first step approached using the methodology of the Land and Ecosystem Accounting (LEAC) framework proposed by the European Environment Agency (EEA 2006; Weber Citation2007). This framework has been applied to account for the changes in the potential of ecosystems to supply ecosystem services in Europe (Haines-Young, Potschin, and Kienast Citation2012). The LEAC presents the biophysical account for land and ecosystem change and the framework for accounting of land cover flows (LCFs), which record changes in ecosystem extent according to human activity and natural processes. LEAC is derived from the SEEA CF and accounts for ecosystem assets as the difference between the opening stock and the closing stock. We consider ecosystem extent account to be equivalent to land cover account. LEAC in line with the SEEA CF (UN Citation2014a) record opening and closing stock and difference between them attributed to the additions to stock or reductions in stock by managed expansion/regression and natural expansion/regression, respectively. Additions to stock or reductions in stock are in the LEAC system classified as specific categories of LCFs.
LCFs represent various processes of the cause of change in land cover assets. SEEA CF defines these processes leading to change in land cover assets as managed expansion, natural expansion, managed regression, and natural regression (UN Citation2014a). For example, building an industrial warehouse on arable land can be classified as a managed expansion according to the SEEA CF (UN Citation2014a) because it represents a process of land cover change (LCC) generated by human activity. In more detailed LEAC classification, this managed expansion is reflected by LCF31 Sprawl of industrial and commercial sites: nonurban land uptake by new industrial and commercial sites (EEA 2006). Equivalently, on the other side of the balance sheet, loss of arable land is recorded as managed regression or consumption of land cover within the same category of human activity.
To develop an ecosystem extent account based on land cover account, we used CLC spatial data. CLC enables analysis of land use changes and LCFs. Land cover and ecosystem conversions and changes are the basis of land cover accounting. The stock of ecosystem extent is represented by the area of particular land cover classes. CLC is available for time periods corresponding to the years 1990, 2000, 2006, and 2012 (the latest available information on land cover). We present the land cover account based on an analysis of the most recent LCFs for the period 2006–2012. While CLES represents more detailed ecosystem extent map, it is not available for different time periods and thus does not enable comparison of ecosystem asset changes in time.
LCFs are reflecting the process of LCC, i.e., conversions between different categories of ecosystems. Recording of these changes and accounting for LCF enables analysis of aggregate trends in conversions between different land cover categories. The spatial nature of CLC enables tracking of the conversions in the form of consumption of the initial land cover and formation of new land cover. The construction of LEAC requires assembling a matrix of spatial transitions between different land cover/ecosystem categories. Based on the LCC matrix, LCF can be delineated and aggregated across different LCC transitions. LEAC aggregates and records all changes and types of LCC. The classification of LCF is based on aggregation of land cover and ecosystem extent changes ().
Table 1. Classification of LCFs. EEA 2006
Ecosystem condition account
Ecosystem condition indicates the state of the ecosystem and its capacity to provide flows of ecosystem services (Hein et al. Citation2016). Currently, there is no standardized procedure for accounting of ecosystem condition. Condition indicators could incorporate specific aspects of ecosystem structure (e.g., standing biomass, species occurrence) or processes (e.g., net primary production (NPP)) (Hein et al. Citation2016). According to SEEA EEA, a collection of indicators of the functioning and integrity of the given ecosystem is related to a reference condition (UN Citation2014b). This notion of ecosystem condition is related to the concepts of ecological integrity and ecosystem intactness. The notion of ecosystem integrity is at the basis of the planetary boundary concept, with biophysical control variables identified for all ecosystems and biomes (Mace et al. Citation2015).
We illustrate ecosystem condition accounting by applying the MSA approach. MSA is an indicator of naturalness and ecosystem intactness (Alkemade et al. Citation2009). It is defined as the mean abundance of original species relative to their abundance in undisturbed ecosystems. MSA is quantified by the GLOBIO model (Alkemade et al. Citation2009), which incorporates the measure of land conversion, impact from infrastructure and fragmentation, nitrogen deposition, and climate change. However, nitrogen deposition and climate change are sometimes omitted from the calculation (Sharp et al. Citation2018). The conceptual model is based on the notion that biodiversity loss is characterized as the decrease in abundance of many original species and the increase in abundance of a few other (often opportunistic) species as a result of human activities. Biodiversity loss in turn contributes to the deterioration of ecosystem condition.
To estimate ecosystem condition, we performed MSA quantification using CLC. MSA indices were assigned to CLC categories based on the level of human influence on ecosystems according to our previous analysis based on CLES (Vačkář et al. Citation2016). CLES is a detailed source on ecosystem extent in the Czech Republic. All MSA values have been expressed as a percentage of the original natural state: 0 (low naturalness) and 100 (high naturalness). Water bodies have been excluded from the ecosystem condition analysis. Artificial surfaces have low values of MSA (0–10%) as only a small fraction of natural ecosystems is retained in these highly influenced areas. Natural ecosystems have high values of MSA (100%) as they retain the majority of original species. Managed ecosystems have MSA values in the middle range (40–50%) according to the intensity of human activities within the ecosystem. As a baseline, we take the original state before the conversion. For example, semi-natural grasslands are an organic component of the Central European landscape. Therefore, grassland mapped as a natural habitat was assigned maximum naturalness of 100%.
Monetary asset account
An ecosystem asset in monetary terms is based on the concept of the present value of ecosystem services derived from the asset (UN Citation2017, Chapter, 7). We take equivalent approach based on the valuation of change in expected ecosystem service flows. Based on LEAC representing the ecosystem extent account, we estimate changing value of ecosystem services induced by LCC. The ecosystem service monetary asset account is thus based on the valuation of LCF. This required assembling a matrix of value changes of ecosystem services, which generated coefficients of value change reflecting LCF. Value coefficients were multiplied by the LCC matrix to estimate the change in the value of ecosystem services change due to LCC.
Valuation of ecosystem services was based on the value transfer approach. Economic valuation based on the value transfer approach utilizes monetary estimates from existing studies and transfers them into a novel policy context (Brander et al. Citation2011). Ecosystem service flows for each land cover category have been identified according to the national valuation study in the Czech Republic () (Frélichová et al. Citation2014; Vačkář et al. Citation2018). We used the EKOSERV database of ecosystem service values and quantified the economic value per unit area of the flow of ecosystem services derived from land cover types (Frélichová et al. Citation2014; Vačkář et al. Citation2018).
Table 2. Identification of ecosystem services for estimation of monetary asset values
Future expected ecosystem service flows are valued as a present value. We calculated the present value by aggregating the discounted flow of ecosystem services from land cover categories using a 5% discount rate and 20-year time period. The resulting value of ecosystem services was multiplied with the area of land cover categories changed in the period 2006–2012. We excluded urban green areas from the valuation of ecosystem assets for artificial areas. While the value of the flow of ecosystem services urbanized surfaces was set to zero, flow of ecosystem services from urban green areas can reach considerable values per hectare of land.
Results
Ecosystem extent
In the Czech Republic, there are 870 possible changes between land cover categories, i.e., changes that could occur based on a combination of all types of LCCs. However, in reality, 155 LCCs have occurred and are detectable. In total, 190,650 ha of land were changed in the period 2006–2012, which is 2.42% of the country’s total area. The dominant LCCs are connected to agricultural and forest management (LCF4 and LCF7). However, there is a continuing trend of decreasing arable land (−111,784 ha). Most former arable land was transformed into pastures and grasslands (93,596 ha). Another important trend is the increase in the area of artificial surfaces, i.e., urbanized, industrial and transport areas (9199 ha). While the area of pastures increased, the area of natural grassland and heathland decreased by 1395 ha. There was also an increase in forest area due to afforestation and forest creation. Complete Land and Ecosystem Asset accounts are presented in .
Table 3. Land and ecosystem account for the Czech Republic, 2006–2012. Consumption of land cover presents the loss of area of original land cover, while formation of land cover presents new land cover created by human activity or natural processes classified in LCFs types. Consumption and formation of land cover is balanced
Dominant LCF is represented by LCF4 agricultural internal conversions containing an area of 107,347 ha. LCF7 forest creation and management is the second largest LCF with an area of 57,147 ha. The remaining LCFs are comparably smaller, comprising a total area of 26,156 ha. Total turnover of land cover type is relatively high for pastures, making up 9.5% of the total pasture area. The structure of LCFs indicates that almost all changes are induced by human activity. Only 98 ha were changed due to natural and multiple causes (LCF9).
Important aspect of the resulting Land and Ecosystem Account is the balance of all realized LCFs. Therefore, the consumption of original land cover has to be balanced with the formation of new land cover. In this case, 190,650 ha consumed from 2006 (beginning of the accounting period) was balanced with the same amount of newly formatted land cover in 2012 (end of the accounting period). Despite some negative trends (such as increasing land sealing or declining area of natural grasslands), in the total balance sheet there can be seen shift toward more “natural” land cover types. The dominant trend is represented by the increase in the pasture area changed for the arable land or the increase in forested area.
Ecosystem condition
Ecosystem condition was measured using MSA, indicating the divergence from the original natural state. Total net changes in ecosystem condition are 12,374 MSA ha−1 (). Therefore, ecosystem condition in the Czech Republic improved in the period 2006–2012 as measured by MSA changes. Most of this impact can be attributed to the conversion of arable land to pastures. However, human activities significantly influenced ecosystem condition as measured by the departure from the natural state. Aggregate improvement in ecosystem condition is reflecting LCCs described in Section 3.1. Total MSA of the Czech Republic was reduced by 69% in comparison with the original state. Both results based on CLC and CLES are equivalent without significant difference.
Table 4. MSA changes as indication of ecosystem condition. Table presents balance of changes in MSA induced by LCC
The largest changes in MSA were induced by the conversion of originally forested areas into urbanized surfaces and agricultural land. The change in ecosystem condition was negative for the increase in urbanized areas (−1775 MSA ha−1) and changes in arable land (−1218 MSA ha−1). The most profound change in the improvement of ecosystem condition is the increase of pastures and meadows (). As pastures are converted mainly from the arable land category, this represents a positive gain of 12,910 MSA ha−1. Conversion to forests and forest management also partly contributed to the improvement of ecosystem condition as measured by the MSA index (2155 MSA ha−1).
Monetary ecosystem asset account
Ecosystem assets in monetary terms present a net gain of EUR 4 billion in present value terms in the period 2006–2012 (). The positive change was caused mainly by transformation of arable land into pastures and by the increase of forested areas. This transformation supports provision of ecosystem services with higher value per hectare. The LCC of arable land to pastures and forests generates gains of EUR 1.9 billion and EUR 1.4 billion, respectively. Transformation of various land covers into pastures and forests generates net gains of EUR 1.7 billion and EUR 4 billion, respectively. However, these gains have been partly offset by urbanization and agricultural utilization.
Table 5. Monetary value of change in future flows of ecosystem services based on LCCs (thousand EUR)
The largest loss of ecosystem services in present value terms is manifested by increasing urbanization. Only a small fraction of arable land has been changed directly into urban green surfaces (10 ha), equivalent to the value change of EUR 698,000. Otherwise, the ecosystem service value lost due to urbanization is negative, with a total loss of EUR 1.5 billion. Despite the total net loss of arable land, part of the country’s grassland and permanent cultures is still being converted to arable use and contributed to the ecosystem service value loss of EUR 467 million.
Monetary asset account based on valuation of changes in expected ecosystem service flows derived from changed land cover is reflecting improving ecosystem condition. Therefore, on all measures of ecosystem extent, ecosystem condition, and monetary value, the ecosystem asset base in the Czech Republic is improving.
Discussion
Ecosystem asset accounts represent the core component of ecosystem accounting at the national level, together with ecosystem service supply and use in physical and monetary terms. In this analysis, we present different components of ecosystem asset accounts, namely ecosystem extent, ecosystem condition, and monetary ecosystem asset account. Ecosystem asset accounts can track the degradation or improvement of natural capital at the national level. Here we discuss aspects of measuring ecosystem condition, valuation approaches for ecosystem assets and policy aspects of implementation of SEEA EEA at the national level.
Measurement for SEEA EEA
SEEA EEA was developed as satellite accounts according to the definition of SNA. There are still multiple challenges in measuring relevant ecosystem characteristics and assembling credible ecosystem asset accounts. The theoretical basis of ecosystem accounting is undoubtedly complex, with recent conceptual advances in the areas of natural capital, natural assets, and nature’s contributions to people (Martinez-Harms et al. Citation2018). Natural assets are the basis of the sustainable flow of ecosystem services and, therefore, ecosystem asset accounting is an important component of sustainability and natural capital accounting (Mace et al. Citation2015). The ecosystem extent account can be assembled relatively straightforwardly, as we show in this analysis. At the European level, CLC data enable provide the only comparable and periodically repeated measurements of LCFs and changes in land/ecosystem extent.
Ecosystem condition is a more complicated concept and no unified guidelines are available for constructing the accounts on ecosystem condition. Ecosystem condition is close to the ecological integrity concept, as well as to other related concepts such as ecosystem stability and ecosystem health (Roche and Campagne Citation2017). Some insights from the measurement of ecological integrity could possibly be applied in ecosystem condition accounting. The ecological integrity concept was introduced to capture ecosystem composition, structure and functioning on the basis of indicators describing the status and trend of key ecosystem drivers and attributes (Wurtzebach and Schultz Citation2016. The capacity to provide a sustainable flow of ecosystem services is dependent on ecosystem functioning and biodiversity (Balvanera et al. Citation2013).
Here we illustrate ecosystem condition accounting by applying the MSA indicator. This is a relatively straightforward approach to the assessment of the “intactness” of natural environment with regard to the reference condition of original species composition (Alkemade et al. Citation2009). The MSA indicator captures the integrity of an ecosystem by comparing the current state with the reference condition, usually approximated by the natural original state. The aspect of ecosystem functioning can be approximated by more a “dynamic” measures such as NPP, which is the amount of biomass produced by photosynthetic processes in ecosystems. Humans considerably influence the amount of NPP remaining in ecosystems through human appropriation of net primary production (HANPP) (Haberl, Erb, and Krausmann Citation2014). As we demonstrated in our previous work, HANPP is negatively correlated with MSA and both indicators measure inverse aspects of human impacts on ecosystems (Vačkář et al. Citation2016). The measurement of ecosystem condition will require an additional set of indicators for appropriate assessment and monitoring.
MSA had already been suggested as an indicator for biodiversity accounting (UN Citation2014b). Undoubtedly, accounting of biodiversity will be somehow linked with accounting of biodiversity condition. There is long-term evidence that biodiversity is important for various aspects of ecosystem functioning (Tilman, Isbell, and Cowles Citation2014). The ecosystem service cascade concept recognizes the role of ecosystem functioning in the production of ecosystem services and it has been applied in various policy processes (La Notte et al. Citation2017; Potschin-Young et al. Citation2018). While ecological integrity is based on direct measurements and sampling of the ecosystem state, MSA and related approaches are based on modeling drivers of ecosystem and biodiversity change. However, human pressures are also to a large extent determining ecosystem condition.
Economic valuation in ecosystem accounting
In this study, we apply the value transfer approach so as to evaluate in monetary terms the change in the future capacity of an ecosystem asset to provide ecosystem services. The reduction of the ecosystem asset’s capacity to perpetuate the flow of ecosystem services implies the level of degradation (Edens and Hein Citation2013) and economic valuation would then signal a welfare change. Applying the right valuation method is crucial for providing a good representation of this change. As we show in the results, for the Czech Republic the degradation is negative and the capacity to provide a future flow of ecosystem services is actually improving. The applicability and eligibility of a set of economic valuation methods is extensively discussed in the SEEA EEA technological framework (UN Citation2014b). The main principle is that valuation methods in ecosystem accounting should align with the methods used in the SNA. In this respect, valuation has to be applied in exchange terms and not in welfare value terms. The exchange value concept implies an observable market that would reflect a price which consumers would pay to the ecosystem asset (producer) for enjoying an ecosystem service. The transaction of ecosystem services is frequently not obvious, as there no real markets that would impose a price. In this case, other valuation techniques can be applied, such as cost-based approaches or revealed preference methods. The description of techniques and their eligibility for accounting purposes are reported in Table 6.1 of SEEA EEA (UN Citation2017).
In SEEA EEA consultation draft document (UN Citation2017), there is discrete note about the benefit transfer method and its use in the absence of resources for primary data collection. Nonetheless, the benefit transfer method is not included in the list of appropriate valuation techniques (Table 6.1 in UN (Citation2017). The benefit transfer in a way entails all valuation techniques as a meta-method (even though it follows its own protocol of implementation) and hence an eligible benefit transfer can be employed as long as it incorporates only studies that have applied techniques compatible with the SNA principles. That may explain why it does not have a distinguishable presence in SEEA EEA guidelines. Though, it may also remain a questionable technique as quoted by Edens and Hein (Citation2013) who placed themselves quite critically against benefit transfer techniques in ecosystem accounting, considering the nature of the method itself, i.e., that it refers to a compilation of a different set of studies employing different valuation approaches that are not always consistent with the valuation principles of the SNA. Although benefit transfer may seem like a “black box” among methods, it can still be a useful tool for ecosystem accounting especially when accounting is performed on the national scale where collection of primary data can be quite time and budget demanding. The benefit transfer can be approached in different ways (Plummer Citation2009) but for ecosystem accounting the critical point is that the values transferred are in exchange and not in welfare values terms. The key factor is the right selection of studies that will be used for the transfer of values considering both that the valuation approaches of primary studies are appropriate for the accounting purpose and as well as that the values transferred are representable for the ecosystems under consideration (UN Citation2017).
Policy aspects of SEEA EEA implementation
The final challenge of developing ecosystem accounting at the national level is the implementation of SEEA EEA. Implementation of SEEA usually follows the modular approach, where the most relevant types of accounts are picked up and implemented by national statistical offices (UN Citation2014a). The implementation of SEEA EEA starts with strategic planning and building the appropriate institutional mechanisms and arrangements (UNSD Citation2013). Despite recent developments in SEEA EEA, the implementation of SEEA EEA at the national level has been rather limited. Vardon, Burnett, and Dovers (Citation2016) name several reasons for this lack of “policy pull,” including the lack of knowledge, exclusion of policymakers from the process of developing accounts, and lack of political acceptability of decisions reflecting the complex relationship between the environment and human wellbeing.
Strategic aspects of SEEA EEA can be organized according to the “policy quadrant” (UNSD Citation2013). Quadrant III is focused directly on Ecosystems: Improving the State of the Environment and Reducing Impacts. The overarching policy and strategic context is currently given by the sustainable development goals (SDGs). SDG monitoring can benefit from the development of SEEA EEA (Ruijs, van der Heide, and van Den Berg Citation2018). According to SDG target 15.9, countries should, by 2020, integrate ecosystems and biodiversity values into national and local planning, development processes and poverty reduction strategies, and accounts. The proposed indicator is related to the implementation and reporting of SEEA at the national level. While EU countries have already implemented some modules of SEEA (e.g., material flows, environmental expenditure, air pollution), integration of ecosystem and biodiversity values requires directly implementing Experimental Ecosystem Accounting. At the EU level, project KIP-INCA led by Eurostat aims to design and implement an integrated accounting system for ecosystems and their services in the EU (La Notte et al. Citation2017). Several countries have already started implementation of SEEA EEA, including United Kingdom (ONS Citation2018) and Netherlands (Remme et al. Citation2015).
SEEA EEA is crucial for monitoring and evaluating complex linkages between ecosystems and human society. Ecosystem accounting provides analytical tools for in-depth evaluation of the impacts of ecosystem changes on the economy and other human activity. According to the information pyramid (UN Citation2014c), coherent ecosystem accounts enable construction of consistent ecosystem asset indicators and aggregates. For example, land and ecosystem asset accounts can assist decision-making based on complex LCFs. While basic statistics can provide information on changes in the area of different ecosystem types, ecosystem extent accounts combined with LCF accounting can identify the structure of the changes. Similarly, an ecosystem asset account in monetary units can provide information on the risk of losing the most valuable assets in terms of the future flow of ecosystem services.
Implementing ecosystem accounting at the national level requires delineating and communicating clear policy usage of ecosystem accounts. High-level policy indicators are usually derived from accounts. A classic example is GDP derived from national accounts. Banzhaf and Boyd (Citation2012) proposed the Ecosystem Service Index (ESI) as an accounting measure capturing ecosystem services flowing from the stock of ecological assets. The ESI index would combine ecological aspects with economic aspects, i.e., ecosystem service flows based on ecological assets with a particular condition combined with marginal willingness to pay representing the price of ecosystem services from the perspective of welfare. The concept of ESI allows including welfare values as well as using benefit transfer approach (but see Section 4.2 for discussion of valuation approaches).
The communication of ecosystem accounts and their policy use is still in the early stages at the national level. An example of an initiative for the implementation of ecosystem accounts is the UK Natural Capital Committee (ONS Citation2018). The work of this committee follows the comprehensive UK National Ecosystem Assessment. Effective implementation of ecosystem accounts requires some form of a national assessment of ecosystem services, mobilization of knowledge and integration of different aspects of ecosystem service data.
Concerning the policy use of ecosystem asset accounts in the Czech Republic, we developed a “Methodology for ecosystem accounting at the national level” which has been endorsed as a first step toward the development of ecosystem accounts by the Czech Statistical Office and the Ministry of Environment. The methodology has been used to support the analysis of changes in agricultural land in the Czech Republic and to highlight the data inconsistencies between different sources (Czech Statistical Office, State Administration of Land Surveying and Cadastre, LPIS, CLC). However, the implementation process has been initiated by the research project “Developing and testing experimental ecosystem accounting in the Czech Republic” and the process was therefore science-driven. Follow-up activities are foreseen as a part of broader process of a national ecosystem services assessment with ecosystem accounts as a module, supporting also the implementation of the National Biodiversity Strategy and the Strategy on Adaptation to Climate Change in the Czech Republic.
Conclusions
Based on the example of the valuation of a change in ecosystem assets in the Czech Republic, we show that the net change in ecosystem assets on many measures is positive. Therefore, measured by the ecosystem asset accounting approach, the state of ecosystems is improving. This is determined mainly by the decreasing area of arable land with lower ecosystem service values per unit area. Lost arable land has been replaced by ecosystems with a higher flow of economic value, especially pastures and, to some extent, forests. The increasing monetary value of ecosystem assets is reflected also in improvements in ecosystem condition measured by the distance to the natural state and expressed by the MSA indicator. Further work is required to compare the performance of different measures of ecosystem condition for accounting purposes. Countries should be encouraged to adopt a modular approach in SEEA EEA implementation and to experiment with the SEEA EEA structure in close co-operation with the relevant stakeholders. Governments should identify key policy uses for ecosystem accounting (Agarwala et al. Citation2014) that would demonstrate the benefits of accounting and promote data collection.
Correction Statement
This article has been republished with minor changes. These changes do not impact the academic content of the article.
Disclosure statement
No potential conflict of interest was reported by the authors.
Additional information
Funding
Related Research Data
References
- ABS. 2014. Australian Environmental-Economic Accounts 2014. 92. Canberra: Australian Bureau of Statistics, Commonwealth of Australia.
- Agarwala, M., G. Atkinson, C. Baldock, and B. Gardiner. 2014. “Natural Capital Accounting and Climate Change.” Nature Climate Change 4: 520–522. doi:10.1038/nclimate2257.
- Alkemade, R., M. Oorschot, L. Miles, C. Nellemann, M. Bakkenes, and B. Ten Brink. 2009. “GLOBIO3: A Framework to Investigate Options for Reducing Global Terrestrial Biodiversity Loss.” Ecosystems 12: 374–390. doi:10.1007/s10021-009-9229-5.
- Balvanera, P., I. Siddique, L. Dee, A. Paquette, F. Isbell, A. Gonzalez, J. Byrnes, M. I. O’Connor, B. A. Hungate, and J. N. Griffin. 2013. “Linking Biodiversity and Ecosystem Services: Current Uncertainties and the Necessary Next Steps.” BioScience 64: 49–57. doi:10.1093/biosci/bit003.
- Banzhaf, H. S., and J. Boyd. 2012. “The Architecture and Measurement of an Ecosystem Services Index.” Sustainability 4: 430–461. doi:10.3390/su4040430.
- Brander, L., I. Bräuer, H. Gerdes, A. Ghermandi, O. Kuik, A. Markandya, S. D. Navrud, et al. 2011. “Using Meta-Analysis and GIS for Value Transfer and Scaling Up: Valuing Climate Change Induced Losses of European Wetlands.” Environmental and Resource Economics 52 (3): 395–413. doi:10.1007/s10640-011-9535-1.
- Edens, B., and L. Hein. 2013. “Towards a Consistent Approach for Ecosystem Accounting.” Ecological Economics 90: 41–52. doi:10.1016/j.ecolecon.2013.03.003.
- EEA. 2006. Land Accounts for Europe 1990–2000: Towards Integrated Land and Ecosystem Accounting. European Environment Agency. Luxembourg: Office for Official Publications of the European Communities.
- Frélichová, J., D. Vačkář, A. Pártl, B. Loučková, Z. V. Harmáčková, and E. Lorencová. 2014. “Integrated Assessment of Ecosystem Services in the Czech Republic.” Ecosystem Services 8: 110–117. doi:10.1016/j.ecoser.2014.03.001.
- Haberl, H., K. H. Erb, and F. Krausmann. 2014. “Human Appropriation of Net Primary Production: Patterns, Trends, and Planetary Boundaries.” Annual Review of Environment and Resources 39: 363–391. doi:10.1146/annurev-environ-121912-094620.
- Haines-Young, R., M. A. Potschin, and F. Kienast. 2012. “Indicators of Ecosystem Service Potential at European Scales: Mapping Marginal Changes and Trade-Offs.” Ecological Indicators 21: 39–53. doi:10.1016/j.ecolind.2011.09.004.
- Hecht, J. E. 2005. National Environmental Accounting: Bridging the Gap between Ecology and Economy, 272. Washington: Resources for the Future, Routledge.
- Hein, L., K. Bagstad, B. Edens, C. Obst, R. de Jong, and J. P. Lesschen. 2016. “Defining Ecosystem Assets for Natural Capital Accounting.” PloS ONE 11 (11): e0164460. doi:10.1371/journal.pone.0164460.
- La Notte, A., S. Vallecillo, C. Polce, G. Zulian, and J. Maes. 2017. Implementing an EU System of Accounting for Ecosystems and Their Services. Initial Proposals for the Implementation of Ecosystem Services Accounts, EUR 28681 EN; Publications Office of the European Union, JRC107150 Luxembourg, doi:10.2760/214137.
- Mace, G. M., R. S. Hails, P. Cryle, J. Harlow, and S. J. Clarke. 2015. “Review: Towards a Risk Register for Natural Capital.” Journal of Applied Ecology 52: 641–653. doi:10.1111/1365-2664.12431.
- Mäler, K. G., S. Aniyar, and Å. Jansson. 2008. “Accounting for Ecosystem Services as a Way to Understand the Requirements for Sustainable Development.” Proceedings of the National Academy of Sciences of the United States of America 105 (28): 9501–9506. doi:10.1073/pnas.0708856105.
- Martinez-Harms, M. J., S. Gelcich, R. M. Krug, F. J. F. Maseyk, H. Moersberger, A. Rastogi, G. Wambugu, C. B. Krug, E. M. Spehn, and U. Pascual. 2018. “Framing Natural Assets for Advancing Sustainability Research: Translating Different Perspectives into Actions.” Sustainability Science. doi:10.1007/s11625-018-0599-5.
- Obst, K. G. 2015. “Reflections on Natural Capital Accounting at the National Level: Advances in the System of Environmental-Economic Accounting.” Sustainability Accounting, Management and Policy Journal 6 (3): 315–339. doi:10.1108/SAMPJ-04-2014-0020.
- ONS. 2018. UK Natural Capital: Ecosystem Service Accounts, 1997 to 2015. Office for National Statistics and Department for Environment, Food and Rural Affairs (Defra), 23.
- Plummer, M. L. 2009. “Assessing Benefit Transfer for the Valuation of Ecosystem Services.” Frontiers in Ecology and the Environment 7: 38–45. doi:10.1890/080091.
- Potschin-Young, M., R. Haines-Young, C. Görg, U. Heink, C. Jax, and C. Schleyer. 2018. “Understanding the Role of Conceptual Frameworks: Reading the Ecosystem Service Cascade.” Ecosystem Services 29: 428–440. doi:10.1016/j.ecoser.2017.05.015.
- Remme, R. P., B. Edens, M. Schröter, and L. Hein. 2015. “Monetary Accounting of Ecosystem Services: A Test Case for Limburg Province, the Netherlands.” Ecological Economics 112: 116–128. doi:10.1016/j.ecolecon.2015.02.015.
- Roche, P. K., and C. S. Campagne. 2017. “From Ecosystem Integrity to Ecosystem Condition: A Continuity of Concepts Supporting Different Aspects of Ecosystem Sustainability.” Current Opinion in Environmental Sustainability 29: 63–68. doi:10.1016/j.cosust.2017.12.009.
- Ruijs, A., M. van der Heide, and J. van den Berg. 2018. Natural Capital Accounting for the Sustainable Development Goals. Current and Potential Uses and Steps Forward, 38. The Hague: PBL Netherlands Environmental Assessment Agency.
- Ruijs, A., and P. van Egmond. 2017. “Natural Capital in Practice: How to Include Its Value in Dutch Decision-Making Processes.” Ecosystem Services 25: 106–116. doi:10.1016/j.ecoser.2017.03.025.
- Sharp, R., R. Chaplin-Kramer, S. Wood, A. Guerry, H. Tallis, and T. Ricketts. (Eds.) 2018. InVEST +VERSION+ User’s Guide. The Natural Capital Project. Stanford University, University of Minnesota, The Nature Conservancy, and World Wildlife Fund.
- Statistical Commission. 2018. “Global Assessment of Environmental-Economic Accounting and Supporting Statistics.” https://seea.un.org/content/global-assessment-environmental-economic-accounting
- Tilman, D., F. Isbell, and J. M. Cowles. 2014. “Biodiversity and Ecosystem Functioning.” Annual Review of Ecology, Evolution, and Systematics 45: 471–493. doi:10.1146/annurev-ecolsys-120213-091917.
- UN. 2014a. System of Environmental-Economic Accounting 2012 Central Framework. United Nations, European Commission, Food and Agricultural Organization of the United Nations, International Monetary Fund, Organisation for Economic Co-operation and Development. United Nations, New York: World Bank.
- UN.2014b. System of Environmental-Economic Accounting 2012 – Experimental Ecosystem Accounting. United Nations, European Commission, Food and Agriculture Organization of the United Nations, Organisation for Economic Co-operation and Development. United Nations, New York: World Bank.
- UN. 2014c. Seea Implementation Guide. Department of Economic and Social Affairs. New York: Statistics Division, United Nations.
- UN. 2017. Technical Recommendations in Support of the System of Environmental – Economic Accounting 2012 – Experimental Ecosystem Accounting, 193. United Nations: White cover publication.
- UNSD. 2013. “SEEA Implementation Guide – Draft Version 1.0.” Department of Economic and Social Affairs, United Nations Statistics Division. http://unstats.un.org/unsd/envaccounting/workshops/Uganda2013/R-P2.pdf
- Vačkář, D., I. Grammatikopoulou, J. Daněk, and E. Lorencová. 2018. “Methodological Aspects of Ecosystem Service Valuation at the National Level.” One Ecosystem 3: e25508. doi:10.3897/oneeco.3.e25508.
- Vačkář, D., Z. V. Harmáčková, H. Kaňková, and K. Stupková. 2016. “Human Transformation of Ecosystems: Comparing Protected and Unprotected Areas with Natural Baselines.” Ecological Indicators 66: 321–328. doi:10.1016/j.ecolind.2016.02.001.
- Vardon, M., P. Burnett, and S. Dovers. 2016. “The Accounting Push and the Policy Pull: Balancing Environment and Economic Decisions.” Ecological Economics 124: 145–152. doi:10.1016/j.ecolecon.2016.01.021.
- WAVES. 2017. Annual Report 2017. International Bank for Reconstruction and Development/The World Bank, Washington, 60 pp.
- Weber, J. L. 2007. “Implementation of Land and Ecosystem Accounts at the European Environment Agency.” Ecological Economics 61: 695–707. doi:10.1016/j.ecolecon.2006.05.023.
- Wurtzebach, Z., and C. Schultz. 2016. “Measuring Ecological Integrity: History, Practical Applications, and Research Opportunities.” BioScience 66 (6): 446–457. doi:10.1093/biosci/biw037.