
ABSTRACT
Land rehabilitation by area exclosure was the fastest and moderate approach of recovering degraded sites. However, the effect of exclosure on woody species parameters in Jabitehnan district, north-western Ethiopia has not been investigated. Therefore, the current study was conducted (i) to assess and compare diversity, composition and density of woody species in exclosure and adjacent open lands, and (ii) to analyze population structure as well as regeneration status of woody species. A random sampling method was employed to select a total of 40 sample plots (50m*50m). A total of 8 parallel transect lines were used inside and outside the exclosure land in each site for consecutive (50m interval) plot establishment. Species diversity was 1.7 and 3.03 for WG, 1.1 and 2.94 for GW open and exclosures, respectively. Population structure of woody species in exclosures of both sites exhibited an inverted J shape which indicates good regeneration status, while in adjacent open grazing land it exhibited partial bell shape. Generally, exclosure provides various biophysical benefits better than adjacent open grazing lands. It is recommended to protect degraded lands by exclosure via integrating appropriate species and convert their diversity into use so as to develop their potential benefits on land restoration.
Introduction
In the world, larger forest lands have been degraded. The prosperity of civilization is threatened when loss of biodiversity combines with land degradation. Recovery from such lost required several decays of years. Implications of forest degradation and deforestation have been subject for discussion over several decays. Measurements like restoration and rehabilitation of degraded land have been taken even though not adequate to solve it at a global level. Countries like China and Vietnam have made major gains in the forest lost reduction and tree planting initiatives.
In Africa, the rate of plantation expansion is much lower. Study forest rehabilitation is also scant. Major means of livelihood for Ethiopian people rely on natural resource, particularly on land. This drastically increases the countries’ vulnerability for resource degradation (EPA, Citation1998). Thus in Ethiopia forest resource degradation and deforestation has a long history with significant spatial variation. Cyclic deforestation has experienced in the northern half over the past three millennia but relatively recent in the southern half of the country (Dessie and Kleman, Citation2007). According to Bekele (Citation2007) including the major southward expansion, deforestation had intensified since 1950s. The estimated rate of deforestation ranges from 140,000 to 200,000 hectare per year. In the recent past, only about 11% (12.3 million hectares) of land were covered by forest (FAO, Citation2010).
Variation in population growth, climatic and edaphic factors emergency of intensive agriculture, expansion of urban area and trade reduces diversity, and density of species on forest and shrub land leads to decline environmental service and goal (Lemenih and Kassa Citation2014), desertification, land degradation and unsustainable development (Nyssen et al. Citation2004; Mengistu et al. Citation2005; Slik et al. Citation2013; Mulugeta Citation2014).
Rehabilitation and ecological preservation of such degraded land is important for the survival of life on the earth (Cairns, Citation2002), popularly achieved through area exclosure (Lemenih Citation2004). In Ethiopia, though government initiated re-greening efforts began over a century ago, the expanded gap between demand and supply of forest product enhances the rate of deforestation.
Area exclosure, smallholder plantation, and state-owned industrial plantation cover 3, 0.8, and 0.25 million hectares, respectively (Lemenih and Kassa Citation2014). Area exclosures are formerly degraded communal grazing lands that are limited from the intrusion of human and domestic animals through strong fencing the area by locally available material or wire mesh with the aim of encouraging natural regeneration (Mekuria and Aynekulu Citation2013; Teketay et al. Citation2018). Area exclosure from land rehabilitation point of view is expressed through increasing biomass production, soil quality, ecosystem productivity, species diversity, and composition (Cairns Jr Citation2002; UNEP, Citation2010).
Previously exclosure measures have been done in different part of Ethiopia with various themes. This includes:
The Actual and potential contribution of exclosures to enhance the biodiversity of woody species (Birhane, Teketay, and Barklund Citation2006).
Enhancement of diversity, stand structure, and regeneration status of woody species through exclosure (Teketay et al. Citation2018).
Effect of livestock exclusion on tree regeneration of church forest (Wassie et al. Citation2009).
Restoration of native vegetation following exclosure establishment (Mekuria & Veldkamp, Citation2012).
Soil property variation in relation to exclosure and open grazing land use (Yimer, Alemu, and Abdelkadir Citation2015).
Rehabilitation of degraded forest and woodland ecosystem for the sustenance of livelihoods and ecosystem service (Lemenih and Kassa Citation2014).
Carbon sequestration and biodiversity restoration potential (Witt et al. Citation2011).
Diversity and density enhancement of large wild animal (Tigabu et al. Citation2014).
Plant biomass improvement (Mekuria and Veldkamp Citation2012).
Enhancement of species diversity, density, population structure, and regeneration status of woody species (Wassie Citation2002; Tefera et al. Citation2005; Abebe et al. Citation2006; Mulugeta & Achenef, Citation2015).
The Effectiveness of governance and management of area exclosure (Mengistu et al. Citation2005; Lemenih and Kassa Citation2014).
Improvement of several aspects of soil resource and related edaphic condition of degraded land (Yimer, Alemu, and Abdelkadir Citation2015).
The third study was focus on the impact of grazing and trampling on seed germination, survival, and growth of seedlings. On this base, the author reported that grazing was strongly affected by seed bank, germination, seedling growth, and rise rate of mortality, though its magnitude varies with the type of species. Birhane, Teketay, and Barklund (Citation2006) in their study (I) illustrate that better woody vegetation were recorded in exclosure than open grazing land. In addition to this, perception and attitude of the local community towards exclosure land expansion and conservation were assessed and reported as positive.
Mean density, population structure, and regeneration status of woody species inside exclosure land was better than outside exclosure land in case of northern Botswana (Teketay et al. Citation2018). Re-greening practice through area exclosure, afforestation and reforestation, and distill lesson regarding processes, achievements and challenges had been done (Lemenih and Kassa Citation2014). Based on this, the main player (farmers and non-governmental organization), minor players (private sector), and a mixed role player (government) were identified.
As mentioned above, though replicated studies on multiple sites have been done, change of vegetation restoration in the early stage (3.5 years) of exclosure establishment has not been conducted. Specifically, woody species diversity, density, population structure, and regeneration status isn’t well explained. Besides edaphic, climatic, agroeological, and anthropogenic factors, generating baseline information on the above- mentioned woody species parameters is crucial for sustainable management of existed exclosure in areas where natural resource used as major means of livelihood by the residents. This is true in case of Amhara region, West Gojjam zone, Jabi Tehnan district where exclosure measure has been taken before. Promote sustainable ways of rehabilitating/restoration of severely deforested and degraded lands is needed.
Therefore, this study is aimed to produce baseline information on (i) the extent of diversity, composition, and density of woody species in the exclosure and adjacent open lands, and (ii) the manner of population structure, as well as regeneration status of woody species.
Material and methods
Study area description (Table1)
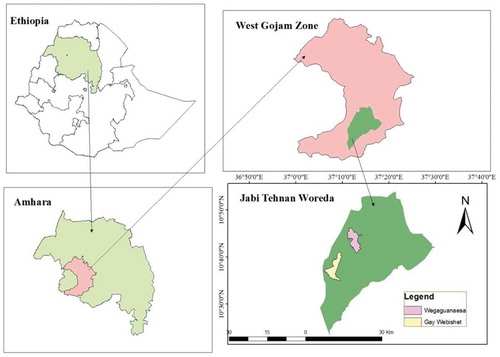
For this case study, the exclosure at Wega Guanaesa and Gay Webishet Keble in Jabi Tehnane district (JD) is used to show the rehabilitation of degraded land in Ethiopia.
JD is situated in West Gojjam zone of the Amhara National Regional state at a distance of 397 km from Addis Ababa. It is found in 36°40ʹE to 36°50ʹE longitude and 10°30ʹ00″ N to 10°40ʹ00″ N latitude at altitude ranges from 1500 to 2300 m.a.s.l (). The average annual rainfall is 1250 mm and the annual temperature varies from 14°C to 32°C. The soils of the district are classified as 60% red, 25% brown, and 15% black soil. Additionally, from fertility point of view, it’s classified as 27% fertile, 71% medium, and 2% infertile soil (Hassen et al. Citation2014).
Figure 1. Map of the study sites
In both exclosure sites, enrichment planting was done to assist natural regeneration at the beginning of exclosure measurement at the same time since 2014.
Methods
Site selection
A reconnaissance survey was undertaken in 37 Keble of the district to identify the presence of area exclosure and adjacent open grazing lands. Accordingly, two Keble one from high altitude (Wega Guanaesa) and other from relatively low altitude (Gay Webishet) were selected purposively since they were the only exclosures that had been established in the same year and initial management practice in the district. Then, each Keble exclosure and adjacent open grazing land size were identified.
Vegetative data sampling design and data collection
To determine species, genera, family, diversity (richness and evenness), population structure, and regeneration status of woody species, a total of eight parallel line transects two in GW site (one for each land use) and six in WG site (three per each land use) with 100 m interval were laid down in and outside exclosure in each site systematically. The number of transect line depends on the vegetation density, spatial heterogeneity of vegetation, and size of the area following Mengistu et al. (Citation2005).
On the transect lines, a total of 40 big quadrats (50 m × 50 m; 10 per each land use in each site) were laid down at 50 m intervals randomly (Gairola, Rawal, and Todaria Citation2008, Margaret, Citation2013; Froumsia et al. Citation2012; Mulugeta Citation2014). So that data on big trees with DBH ≥6 cm were collected. The first quadrant was established 20 m away from the border of the first transect line in order to minimize the border effect. 50 m × 50 m plot size was used since it is in the range of minimum sample area required for representing a vegetation study and keeps environmental factors approximately uniform (Kessler & Bach, Citation1999; Mengistu et al. Citation2005).
Inside the big plot (50 m ×50 m) three nested subplot (20 m*20 m, 5 m*5 m and 2 m*2 m) were established at the four corner and in the center of the big plot then data like DBH and height on each plot for young tree, tree/sapling, seedling or sapling, and for seedling (i.e.,: 4 ≤ DBH<6, 2≤ DBH<4 and DBH<2cm) were captured respectively. According to Lai et al. (Citation2009), it is known that seedling has a diameter <2.5 cm and height <1 m; sapling and shrub have a diameter of 2.5–5 cm, height 1–2 m, and tree and shrub has diameter ≥5 and height ≥ 2 m. This classification was considered in this arbitrary DBH class allocation in each nested plot.
Following the procedure adopted by Mengistu et al. (Citation2005), parameters like plant cover, species diversity, density, frequency, and dominance were used to determine changes after exclosure measurement were employed in the area compared with its adjacent open grazing lands. In each quadrant total number of woody species was recorded. Hypsometer and calliper were used to collect data on diameter at breast height (DBH) and Height. Nomenclatures of woody species were followed flora of Ethiopia and Eritrea (Edward and Hedberg, Citation2000) and Useful trees & shrubs of Ethiopia (Bekele Citation1993, Citation2007).
Data analysis
Composition, density, and dominance of woody species analysis
Data for analysis were collected from December (2017) to January (2018). Compositions of woody species were determined after carefully identifying each species from sampled quadrate and grouping to their respective life form, family, and genera.
Differences between the two land use per each site in diversity, dominance, and density were analyzed by independent sample t-test (using values of Shannon diversity index, density, dominance, and DBH as the response variable and land use as group/independent variable). Independent sample t-test was used because samples were taken from two unrelated population (open and exclosure), number of plots were less than 30(10 per each land use) and equal variance is assumed. Results were considered significant at P < 0.05 level of significance. Data analyses were carried out by SPSS version 20 software and the results of the analysis were summarized and presented using tables and graphs.
The diversity of woody species was analyzed by Shannon diversity index because it best tells the diversity of woody species that had been influenced by anthropogenic factors before (Grig-Smith Citation1983). This index comprises both the richness (a measure of the number of different species in a given site; helps to compare the diversity of species in a different site) and evenness (a measure of the abundance of species which makes richness) of species in a given stand. It gives more weight for rare species.
Evenness/equitability, in biodiversity measure probability of species distribution in the sample quadrats (Magurran Citation2004; Begon et al. Citation2006), were estimated through Shannon Evenness index. It ranges from the value of 0 to 1, where 0 is completely uneven while 1 being completely even population (Magurran Citation2004).
Similarities in species, genera, and family were estimated by SØrensen coefficient of similarity index, which is the best indicator of floristic similarity between two communities (Dice Citation1945; Sorensen, Citation1948; Kent and Coker Citation1992; Xiao et al. Citation2011). So that it’s considered as the most adequate similarity index due to higher projection efficiency is given for commonly existing species in two samples than a unique species (Duarte, Santos, and Melo Citation1999).
The mean basal area of woody species in a sampled quadrate for each land use were performed via estimating basal area per hectare of land for each woody species then sum up all basal area per hectare of land they cover and divide the total value to number of individuals in each plot.
Like this, the mean density (stem/hectare) was performed through converting the total number of woody species (abundance) recorded in the whole quadrate per each land use to equivalent number per hectare. And then sum up all values and divide this value to a product value of a quadrate number and quadrate area. This was done for each land use before comparison measurement was taken. The density of woody species, is the total number of individuals divided by the number of plot times plot area, were used to express how much individuals (stems) of woody species occupied in a given area (hectare). The frequency of species was determined through taking the proportion of a number of sample plots in which particular species recorded to the total number of sample plot times 100. Population structure of woody species were analyzed through histograms constructed by using density of individual species (y-axis) categorized in 6 diameter class (x-axis), that is (DBH class in cm) 1 = <2, 2 = 2–5.5, 3 = 5.5–8.5, 4 = 8.5–11.5, 5 = 11.5–13.5, 6 ≥ 13.5. Based on the profile shown in the structure, regeneration status of woody species was determined.
Result
Woody species composition
A total of 22 and 13 woody species belonging to 16 and 10 families with 18 and 12 genera were recorded in exclosure and adjacent open grazing land of WG site respectively. In the GW site, a total of 24 and 11 woody species belonging to 16 and 9 families with 23 and 10 genera were recorded in exclosure and adjacent open grazing land, respectively (CitationTable 2). The estimated SØrensen similarity index between land uses of WG site was 0.47%; which means that there was 0.53(53%) difference in woody species composition between two land use types. While in between land uses of GW site similarity in composition of woody species was 0.62 (62%).
Table 1. Specific study site description
Table 2. Woody species recorded in the Wega guanaesa and Gay webishet site
Of those recorded species, the maximum area (51.2%) was covered by trees and the minimum area (11.44%) was covered by shrubs or small trees in adjacent open grazing land of WG. Tree and shrub species covered the maximum area (47.54%) while woody species, which belongs to shrub/tree recorded the minimum area share (4.92%) inside exclosure of the same site. Tree and shrub/tree were also accounted the maximum and minimum share in the GW adjacent open grazing land. Regardless of their life forms, of all woody species identified 70.8% in exclosure and 90.9% in adjacent open grazing land of GW, as well as 72.72% in exclosure and 76.92% in adjacent open grazing of WG site were native.
Species diversity, density, and dominance (basal area)
The Shannon diversity index ranges from 1.71 (open grazing land) to 3.03(exclosure) in WG; 1.05 (open grazing) to 2.94 (exclosure) in GW site ().
Table 3. Mean ± SE basal area, density, and woody species diversity per plot
Vernonia auriculifera, Cupressus lustanica, and Osyris quadripartite from exclosure land of WG; Cupressus lusitanica, Vernonia amygdalina, and Acacia abyssinica from its adjacent open grazing land were the top three species with the highest density (Table 2). Leucaena leucocephala, Mangifera indica, and Osyris quadripartita in the exclosure; Carissa spinarum, Croton macrostachyus, and Terminalia brownii in open grazing land were taken as the top three dense species in the GW site (). All ranked species in each land use in their respective sites were put in descending order.
Melianthaceae and Euphorbiaceae followed by Asteraceae and Santalaceae followed by Asteraceae were the first abundant family in open grazing and exclosure land of WG, respectively (). Asteraceae and Apocynaceae followed by Euphorbiaceae and Asteraceae next to Capparidaceae were the first abundant family in open grazing land and exclosure of GW site, respectively ().
From dominance point of view, Fabaceae (36.88%) in open grazing land of WG; Asteraceae (19.85%) in exclosure of WG (); Euphorbiaceae (72.9%) in open grazing land of GW and Fabaceae (23.98%) in exclosure of GW were the first dominant family (). While Combretaceae (1.47%) from open grazing land WG; Myrtaceae (3.32%) from exclosure of WG (); Capparidaceae (0.75%) from open grazing land of GW and Santalaceae (1.15%) from exclosure of GW were the least dominant family ().
Population structure
Population structure in a given site was determined by using species abundance and diameter class (Mengesha Citation2011). In adjacent open grazing land uses of both sites, the absence of woody species in some and domination of few individuals in other classes makes partially bell shape ( and ). This clearly indicated that the performances of existed species were highly related to level of management (disturbance). Oppositely, in the two exclosures, woody species pattern showed more or less inverted J shape indicating that there was active regeneration status ( and ). On the two study sites, the distribution of woody species in the base of stem per hectare was categorized into five regeneration patterns.
Figure 2. Population structure of woody species in adjacent open grazing land of Wega guanaesa site
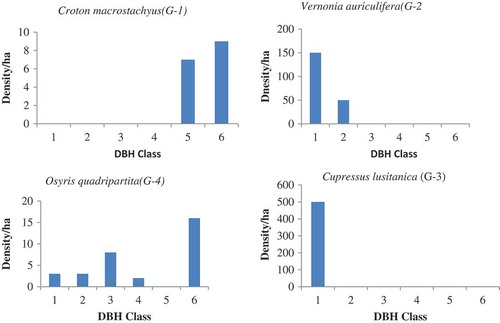
Figure 3. Population structure of woody species in exclosure land of Wega guanaesa site
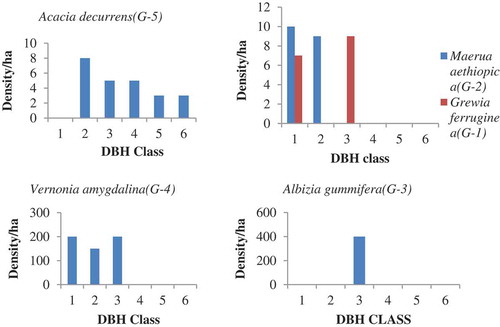
The first pattern showed a reduction in the lower class and a slight rise from middle to upper class. Such J shapes (G-1) were expressed by Bersama abyssinica, Croton macrostachyus, and Eucalyptus camaldulensis in open grazing land of WG (). The species in the second pattern shows higher density in the lower class but slightly reduce later and finally reach to total elimination on the upper class.
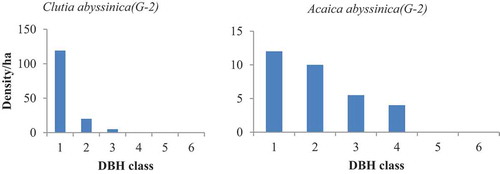
Such inverted J shapes (G-2) were expressed by Inula decipiens, Bersama abyssinica, Vernonia auriculifera, and Rosa abyssinica in open grazing land of WG (); Maerua aethiopica, Terminalia brownii, Carissa spinarum, Acacia abyssinica, Grevillea robusta, Bersama abyssinica, and Osyris quadripartite in the exclosure of WG (); Acacia abyssinica, Clutia abyssinica in the Exclosure of GW (). The third group shows domination of a species in a single class (I shape = G-3). In this class both the lower class (seedling and sapling stage) and the upper class were totally replaced by the middle class. For instance, Cupressus lustanica belonged to this group was from open grazing land of WG ().
Sometimes rather than the remaining class only the lower classes appeared. Species like Terminalia brownii and Carissa spinarum from open grazing land of WG (); Albizia gummifera, Ficus thonningii, Casuarina equisetifolia, Rhus natalensis, Rosa abyssinica, and Cordia africana from exclosure of WG best fit to this pattern (); Cordia africana, Acacia abyssinica, Albizia gummifera, and Carissa spinarum in open grazing land of GW (); Casuarina equisetifolia, Cupressus lustanica, and Cordia africana in the exclosure of GW (). The forth group was irregular shapes (G-4), which were showed by Millettia ferruginea and Osyris quadripartite in open grazing land of WG (); Bersama abyssinica, Croton macrostachyus, and Maerua aethiopica in open grazing land of GW. The fifth group (G-5) was observed in the exclosure site of WG, which shows normal growth pattern (active regeneration after the first class (, by Acacia decurrens)).
Figure 4. Population structure of woody species in adjacent open grazing land of Gay webishet site
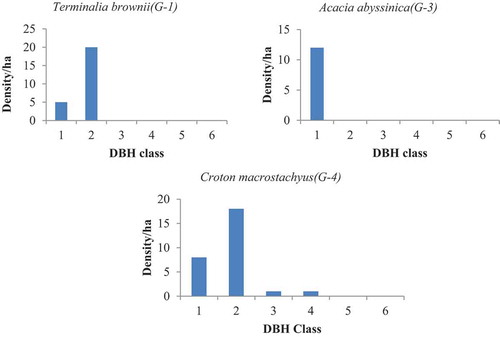
Figure 5. Population structure of woody species in exclosure land of Gay webishet site
Discussion
Woody species diversity, dominance, and composition
The dominance of woody species in open grazing land of WG was three times lower than exclosure. In the GW site, the dominance of woody species in the exclosure is also three times greater than open land. Improvement in soil property and vegetation cover as a result of the reduction in the level of disturbance might leads to such variation. The dominance and abundance of different family in a certain habitat might be related with agroecology, soil type, topography, land use, other edaphic, and biophysical factors they adapted before (Bekele Citation2007). For example, Melianthaceae was widely existed in open grazing land of WG site, which is forest edges, cleared land, open and sloppy woodland, and wet weyna dega Agroecology zones (2000–2300 m.a.s.l).
This study result was in line with studies that were concluded as natural resource management strategies like area exclosure showed significantly higher improvement in woody vegetation composition and diversity (Mengistu et al. Citation2005; Mengesha. Citation2011; Mekuria & Aynekulu, Citation2013). The richness of woody species in WG exclosure land was 1.69 times greater than the adjacent open grazing land. In GW site, it was also 2.18 times larger than its adjacent open grazing land. Whereas the mean abundance value of woody species in WG exclosure land was 2.12 times greater than its adjacent open grazing land. In GW site, it was also 3.97 times greater than its adjacent open grazing land ().
Table 4. Mean ± SE of woody species abundance, richness and evenness per plot
A study did earlier in Socotra Island also came with a similar result to this study and concluded that composition of woody species inside exclosure was better than adjacent open grazing land. This was related with the marked impact of grazing and leads to the elimination of trees and shrubs (Habrova & Pavlis, Citation2017). Additionally, Boucherit, Benabdeli, and Benaradj (Citation2017) reported that floristic richness in the enclosure was 59.26% times higher than adjacent free grazing land which is comparable with this study result.
The composition of woody species in the exclosure of GW site was largely covered by shrub than tree species. The reverse was shown in its adjacent open grazing land (). This study result was similar to study result of Abebe et al. (Citation2006). But in case of WG, it contradicts with Abebe’s finding (shrub and trees in the exclosure had similar shares). Tree species better share than shrubs in the adjacent open grazing lands. Thus, different might occurred from a difference in the level of management. In WG, site tree species and shrubs were cover more or less similar percent inside exclosure. However, in open grazing land tree species share a larger portion (51.24%) of land than shrub (37.32).
Shannon diversity index of woody species in adjacent open grazing land of WG site is1.76 times less than from its exclosure land, whereas in case of GW it is 2.63 times less in diversity value than the adjacent exclosure land. This finding was in line with study result which was concluded as Shannon diversity of woody species in the less disturbed area (exclosure) was higher than highly disturbed area (adjacent open grazing land) (Mengistu et al. Citation2005; Abebe et al. Citation2006; Mengesha Citation2011; Mekuria and Aynekulu Citation2013;Sunil, Somashekar, and Nagaraja Citation2011; Hailu Citation2017; Teketay et al. Citation2018). However, the studies done by Birhane et al. (Citation2007) and Mwalayois (Citation2000) were concluded that diversity of woody species in the exclosure were lower than adjacent open grazing land. It might relate with faults in case of appropriate site selection for exclosure, as well as domination of occasional and common species over the rare species in that sites. Species evenness hadn’t shown significant differences in between adjacent open grazing and exclosure of WG the reverse was true in case of GW land uses.
Table 5. List of woody species recorded with their density, frequency, abundance, dominance at Gay webishet site
The species distribution in exclosure land of WG (95%) was better than its adjacent open grazing land (86%). In both case, woody species were more evenly and comparably distributed (). Unlike WG site, woody species in adjacent grazing land (45%) of GW site were unevenly distributed than from exclosure land (80%). Teketay et al. (Citation2018) were also reported similar results with this finding. The significant difference in the evenness of woody species between GW lands uses might be related with variation in the ability of species to cope with harsh environmental conditions besides livestock, human, and other factors (Ayanaw Citation2016).
Table 6. List of woody species recorded with their density, frequency, abundance, dominance at Wega guanaesa site
Density
The density of species in the exclosure and adjacent open grazing lands of the two sites was found to be different. Stem/ha of woody species in exclosure land of WG site was greater than in the adjacent open grazing land. It consists with study result that was concluded that density of woody species inside the exclosure had significantly difference from open grazing land (Mengesha Citation2011; Teketay et al. Citation2018). Like this, in GW the density of woody species inside the exclosure (506.7 ± 203) showed significantly (eight times) higher than adjacent open grazing land (61.8 ± 43.3, p = 0.046). It was comparable with the report done by Teketay et al. (Citation2018). This might be related to better soil condition and microclimate which tells further regeneration.
From the total density of woody species recorded in adjacent open grazing land of WG site, the share of seedling, sapling and tree species were 91.3%, 6.9%, and 1.7% respectively. In its exclosure land, use seedling, sapling, and tree were shared 50%, 27.3%, and 22.26%. Whereas in GW site exclosure land use 44.13%, 29.97%, and 25.8%, as well as in the adjacent open grazing land 4.04%, 8.09%, and 87.86% were shared by seedling, sapling and tree species at GW site. This study result was comparable with Mengistu et al. (Citation2005) result.
Woody species similarity and population structure
SØrensen similarity index was widely used index since it gives more weight for species found in two habitats (sites) other than in only one of the habitats. Because of that, it was taken as best the expresser of the pattern of species turnover among successive communities (Kent &Coker, Citation1992). The estimated SØrensen similarity index between the land uses of the WG site was 0.47%; which means there was 0.53(53%) difference in woody species composition between two land use types. Again, the difference in species composition is due to the reappearance of species that were lost from the adjacent open grazing land over time.
The similarity index between the exclosure and open grazing land in the case of GW site was 0.62 (62%), which was a little higher than in the case of WG. The results of the current study were consistent with those of Mengesha (Citation2011) and Mengistu et al. (Citation2005). The extent of species similarity and difference in between the land uses might be related to the level of disturbance in the composition of species between the sites.
In a given site population, structure was determined by using species abundance and diameter class (Mengesha Citation2011). Accordingly, the overall population structure of WG and GW adjacent open grazing land irrespective of species showed irregular pattern (Bell shaped). This indicated that there was heterogeneity (active and passive in a different class) in the regeneration status of species. In other words, there were complete absences of individuals in some class and fairly representative of the individual in other class. The presence of disturbance by human-induced fire, selective cutting (for fuelwood, construction, and farming utensils), heavily browsing (through domestic and wild animals), and other anthropogenic factors might lead to such variation. Ayanaw (Citation2016) was also reported similar result with this finding. Oppositely, species belonged to exclosure land of both site were showed active regeneration. This was due to the protection of land by a strong fence which assists regeneration thereby rising rate of seed germination from trees recruited in the soil seed bank, sprouting of shoots from stump, and seed dispersal from the formerly survived tree. Similar results were also reported by Mengistu et al. (Citation2005), Mengesha (Citation2011), and Teketay et al. (Citation2018).
Conclusion
From the current study, it was concluded that exclosure sites had higher species diversity, species composition, and density of woody species than the adjacent open grazing lands. It was also concluded that unlike adjacent open grazing land, population structures of the exclosure exhibited more or less inverted J-shape, which is indicative of the fact that young individuals are being recruited into the community. Finally, it was concluded that exclosure is a viable strategy for the restoration of degraded landscapes and should be pursued vigorously. Further study is recommended on identifying gradient factors like elevation, slope, aspect, and other ecological factors in woody species composition, biomass, carbon, and density across different exclosure; impact of enrichment planting in existed exclosure lands on rate of vegetation restoration and soil organic matter accommodation in severely affected lands across different agroecology; comparative studies on distribution manner of soil seed bank, as well as species diversity in soil microorganism inside and outside exclosure lands.
Acknowledgments
The authors thank Jabitehnan District office of Agriculture for their assistance directly or indirectly during fieldwork. The Authors are also very grateful for the reviewers and Prof. Yonglong Lu, Editor in Chief, for their constructive comment in the early version of this article.
Disclosure statement
No potential conflict of interest was reported by the authors.
Related Research Data
References
- Ayanaw., A., 2016. "Woody Species Diversity, Structure and Regeneration Status of Yemrehane Kirstos Church Forest of Lasta Woreda, North WolloZone, Amhara region, Ethiopia." International Journal of Forestry Research 2018.
- Begon, M., C. R. H. Townsend, L. John, R. T. Colin, and L. H. John, 2006. Ecology: from individuals to ecosystems (No. Sirsi) i9781405111171).
- Bekele., A. 1993. Useful Trees and Shrubs for Ethiopia: Identification, Propagation and Management for Agricultural and Pastoral Communities. Nairobi, Kenya: Regional Soil Conservation Unit, Swedish International Development Authority.
- Bekele., A. 2007. Useful Trees and Shrubs of Ethiopia: Identification, Propagation, and Management for 17 Agroclimatic Zones. Eastern Africa Region: RELMA in ICRAF Project, World Agroforestry Centre.
- Birhane, E., D. Teketay, and P. Barklund. 2006. “Actual and Potential Contribution of Exclosures to Enhance Biodiversity of Woody Species in the Drylands of Eastern Tigray.” Journal of the Drylands 1 (2): 134–147.
- Birhane, E., D. Teketay, and P. Barklund. 2007. “Enclosures to Enhance Woody Species Diversity in the Drylands of Eastern Tigray, Ethiopia.” East African Journal of Sciences 1 (2): 136–147. doi:10.4314/eajsci.v1i2.40352.
- Boucherit, H., K. Benabdeli, and A. Benaradj. 2017. “Biological Recovery the Steppe of Hammada Scoparia after Enclosure in the Region of Naama (Algeria).” Ekológia (Bratislava) 36 (1): 52–59. doi:10.1515/eko-2017-0005.
- Cairns Jr, J. O. H. N. 2002. “Rationale for Restoration.” Handbook of Ecological Restoration 1: 10–23.
- Dessie, G., and J. Kleman. 2007. “Pattern and Magnitude of Deforestation in the South-central Rift Valley Region of Ethiopia." Mountain Research and Development 27 (2): 162–169.
- Dice, L. R. 1945. “Measures of the Amount of Ecologic Association between Species.” Ecology 26 (3): 297–302. doi:10.2307/1932409.
- Duarte, J. M., J. B. D. Santos, and L. C. Melo. 1999. “Comparison of Similarity Coefficients Based on RAPD Markers in the Common Bean.” Genetics and Molecular Biology 22 (3): 427–432. doi:10.1590/S1415-47571999000300024.
- Edwards, S., and I. Hedberg. 2000. Flora of Ethiopia: Pt. 1. Magnoliaceae to Flacourtiaceae (Vol. 2, No. 1). Addis Ababa, Ethiopia: National Herbarium, Biology Department, Science Faculty, Addis Ababa University.
- EPA (Ethiopian Environmental Protection Authority). 1998. National Action Program to Combat Desertification. Addis Ababa: Federal Democratic Republic of Ethiopia Environmental Protection Authority.
- FAO. 2010. The State of Food Insecurity in the World: Addressing food insecurity in protracted crises. FAO.
- Froumsia, M., L. Zapfack, P. M. Mapongmetsem, and B. A. Nkongmeneck. 2012. “Woody Species Composition, Structure and Diversity of Vegetation of Kalfou Forest Reserve, Cameroon.” Journal of Ecology and the Natural Environment 4 (13): 333–343. Available online at http://www.academicjournals.org/jene
- Gairola, S., R. S. Rawal, and N. P. Todaria. 2008. “Forest Vegetation Patterns along an Altitudinal Gradient in Sub-Alpine Zone of West Himalaya, India.” Journal of Plant Science 2 (6): 042–048. Available online at http://www.academicjournals.org/AJPS
- Greig -Smith, P. 1983. Quantitative Plant Ecology. 3rd ed. London: Butter worths.
- Habrova, H &Pavlis, J. 2017. “Dynamic Response of Woody Vegetation on Fencing Protection in Semi-Arid Areas; Case Study: Pilot Exclosure on the Firmihin Plateau, Socotra Island.” Saudi Journal of Biological Sciences 24: 338–346. doi:10.1016/j.sjbs.2015.09.030.
- Hailu., H. 2017. “Analysis of Vegetation Phytosociological Characteristics and Soil Physico-Chemical Conditions in Harishin Rangelands of Eastern Ethiopia.” Journal of Land 6 (4): 10–11.
- Abebe, M. H., G. Oba, A. Angassa, and R. B. Weladji. 2006. “The Role of Area Enclosures and Fallow Age in the Restoration of Plant Diversity in Northern Ethiopia.” African Journal of Ecology 44 (4): 507–514. doi:10.1111/j.1365-2028.2006.00664.x.
- Hassen, A., B. Kassa, B. Berihun, M. Tolla, M. Tafere, Y. Denkew, and F. Tegegn, G/silasie,Y. 2014. Participatory Rural Apprasial Report: Jabi Tehnan Woreda, Amhara Region. CASCAPE working paper 2.2.3. pp1–65.
- Kent, M., and P. Coker. 1992. Vegetation Description Andanalysis. BocaRaton, CRC: A Practical Approach.CRC Press.
- Kessler, M., and K. Bach. 1999. “Using Indicator Families for Vegetation Classification in Species-Rich Neotropical Forests.” Phytocoenologia 29 (4): 485–502.
- Lai, J., X. Mi, H. Ren, and K. Ma. 2009. “Species‐Habitat Associations Change in a Subtropical Forest of China.” Journal of Vegetation Science 20 (3): 415–423. doi:10.1111/jvs.2009.20.issue-3.
- Lemenih., M., 2004. “Effects of Land Use Changes on Soil Quality and Native Flora Degradation and Restoration in the Highlands of Ethiopia (Vol. 306).Implications for Sustainable Land Management.” PhD Dissertation Presented to Swedish University of Agricultural Sciences, Uppsala, Sweden.
- Lemenih, M., and H. Kassa. 2014. “Re-Greening Ethiopia: History, Challenges and Lessons.” Forests 5 (8): 1896–1909. doi:10.3390/f5081896.
- Magurran, A. E. 2004. Measuring Biological Diversity. UK: Blackwells.Oxford.
- Margaret, A. J. 2013. Woody plant communities along an elevational gradient in Moorea, French Polynesia. Berkeley, California: Integrative Biology, University of California.
- Mekuria, W., and E. Aynekulu. 2013. “Exclosure Land Management for Restoration of the Soils in Degraded Communal Grazing Lands in Northern Ethiopia.” Land Degradation & Development 24 (6): 528–538. doi:10.1002/ldr.1146.
- Mekuria, W., and E. Veldkamp. 2012. “Restoration of Native Vegetation following Exclosure Establishment on Communal Grazing Lands in Tigray, Ethiopia.” Applied Vegetation Science 15 (1): 71–83. doi:10.1111/avsc.2011.15.issue-1.
- Mengesha., A. M. 2011. The Role of Area Closures for Soil and WoodyVegetation Rehabilitation in Kewot District,North Shewa. Addise Abeba: MSc Thesis.Addis Ababa University School of graduate studies College of natural science.
- Mengistu., T., D. Teketay., H. Haken, and Y. Yemishaw. 2005. “The Role of Enclosures in the Recovery of Woody Vegetation in Degraded Dryland Hillsides of Central and Northern Ethiopia.” Journal of Arid Environments 60 (2): 259–281. doi:10.1016/j.jaridenv.2004.03.014.
- Mulugeta., G. 2014. “Vegetation Dynamics of Area Enclosure Practices: A Case of Gonder Zuria District, Amhara Region, Ethiopia.” Journal of Natural Sciences Research. 4 (7): 75–82.
- Mulugeta, G., and M. Achenef. 2015. “Socio-Economic Challenges of Area Exclosure Practices: A Case of Gonder Zuria Woreda, Amhara Region.” Ethiopia Journal of Natural Sciences Research 5: 13.
- Mwalyosi, R. B. 2000. “Vegetation Changes Following Land Reclamation in The Kondoa Eroded Area, Central Tanzania.” African Journal of Ecology 38 (3): 265–268.
- Nyssen, J., J. Poesen, J. Moeyersons, J. Deckers, M. Haile, and A. Lang. 2004. “Human Impact on the Environment in the Ethiopian and Eritrean Highlands—A State of the Art.” Earth-Science Reviews 64 (3–4): 273–320. doi:10.1016/S0012-8252(03)00078-3.
- Slik, J. W., G. Paoli, K. McGuire, I. Amaral, J. Barroso, M. Bastian, L. Blanc, et al. 2013. “Large Trees Drive Forest Aboveground Biomass Variation in Moist Lowland Forests across the Tropics.” Global Ecology and Biogeography 22 (12): 1261–1271. doi:10.1111/geb.12092.
- Sørensen, T. 1948. “A Method of Establishing Groups of Equal Amplitude in Plant Sociology Based on Similarity of Species and Its Application to Analyses of the Vegetation on Danish Commons.” Biologiske Skrifter 5: 1–34. Species Diversity and Regulating Ecosystem Services in Ethiopia, 58, 10–17.
- Sunil, C., R. K. Somashekar, and B. C. Nagaraja. 2011. “Impact of Anthropogenic Disturbances on Riparian Forest Ecology and Ecosystem Services in Southern India.” International Journal of Biodiversity Science, Ecosystem Services & Management 7 (4): 273–282. doi:10.1080/21513732.2011.631939.
- Tefera, M., T. Demel, H. Hultén, and Y. Yemshaw. 2005. “The Role of Communities in Closed Area Management in Ethiopia.” Mountain Research and Development 25 (1): 44–50. For mingestu 2005b. doi:10.1659/0276-4741(2005)025[0044:TROCIC]2.0.CO;2
- Teketay, D., K. Kashe, J. Madome, M. Kabelo, J. Neelo, M. Mmusi, and W. Masamba. 2018. “Enhancement of Diversity, Stand Structure and Regeneration of Woody Species through Area Exclosure: The Case of a Mopane Woodland in Northern Botswana.” Ecological Processes 7 (1): 5. doi:10.1186/s13717-018-0116-x.
- Tigabu, M., L. Mulugeta, M. Negash, and D. Teketay. 2014. “Rehabilitation of Degraded Forest and Woodland Ecosystems in Ethiopia for Sustenance of Livelihoods and Ecosystem Services.” IUFRO World Series 32: 299–313.
- UNEP (United Nations Environmental Program) p, I., 2010.World Database on Protected Areas (WDPA) Annual release
- Wassie., A. 2002. Opportunities, Constraints and Prospects of the Ethiopian Orthodox Tewahido Churches in Conserving Forest Resources: The Case of Churches in South Gonder. Northern Ethiopia: agris.fao.org.
- Wassie, A., F. J. Sterck, D. Teketay, and F. Bongers. 2009. “Effects of Livestock Exclusion on Tree Regeneration in Church Forests of Ethiopia.” Forest Ecology and Management 257 (3): 765–772. doi:10.1016/j.foreco.2008.07.032.
- Witt, G. B., M. V. Noël, M. I. Bird, R. B. Beeton, and N. W. Menzies. 2011. “Carbon Sequestration and Biodiversity Restoration Potential of Semi-Arid Mulga Lands of Australia Interpreted from Long-Term Grazing Exclosures.” Agriculture, Ecosystems & Environment 141 (1–2): pp.108–118. doi:10.1016/j.agee.2011.02.020.
- Xiao-Tao, L., J.-X. Yin, and J.-W. Tang. 2011. “Diversity and Composition of Understory Vegetation in the Tropical Seasonal Rain Forest of Xishuangbanna, SW China.” Revista De Biología Tropical 59(1): 455–463. (Int. J. Trop. Biol. ISSN-0034-7744).
- Yimer, F., G. Alemu, and A. Abdelkadir. 2015. “Soil Property Variations in Relation to Exclosure and Open Grazing Land Use Types in the Central Rift Valley Area of Ethiopia.” Environmental Systems Research 4 (1): 17. doi:10.1186/s40068-015-0041-2.