
 ?Mathematical formulae have been encoded as MathML and are displayed in this HTML version using MathJax in order to improve their display. Uncheck the box to turn MathJax off. This feature requires Javascript. Click on a formula to zoom.
ABSTRACT
The rotational symmetry connection between the Species-Area Relationship (SAR) and Endemics-Area Relationship (EAR) was discovered in the frame of Species-Area Theory. In this paper, this paired connection was applied into the impact of variation of number of species and area and dynamic change of species-abundance distribution on the curve shape of SAR and EAR, which can be integrated into the assessment of Natural Protected Areas and Ecological Restoration Projects. The results indicate that the underestimate or overestimate of total number of species can lead to the underestimate or overestimate of extinction rate, while the reduction or expansion of area can lead to the increase or decrease in extinction rate. In addition, the species-abundance distribution change of community causes the shape tuning of SAR and EAR, which leads to inconsistent change of extinction rate. Thus, this SAT frame can be used as a qualitative tool in conservation and restoration management.
Introduction
To conserve endangered species and recover impaired ecosystems, numerous Natural Protected Areas (NPAs) and Ecological Restoration Projects (ERPs) have been established around the world, and the number will continue to increase according to the Aichi Biodiversity Target proposed by the Convention on Biological Diversity (CBD) (http://www.cbd.int/sp/targets). During the design and assessment of NPAs and ERPs, ecological knowledge plays an important role. Qualitative analysis on species and area relationships is particularly necessary due to its straightforwardness and economic feasibility before implementing large-scale background survey or project construction.
As one core principle of conservation and restoration biology, the frame of Species-Area Theory (SAT, comprehensive and systematic analysis of the area and the species in this area) should be deeply integrated into such fields, especially the connections among Species-Area Relationship (SAR, the relationship that the species set changes with the area), Endemics-Area Relationships (EAR, the species set exists in one area but not in another), and Overlap-Area Relationship (OAR, the same species set between the two (or more) SARs) (Pan Citation2013, Citation2015, Citation2016). The SAT focuses on the relationship between species and area, and can be applied to the establishment of NPAs and ERPs, which are employed to conserve/recover specific species or ecosystem in selected habitats. SAR has been used to set baseline targets for conservation (Desmet and Cowling Citation2004), and both SAR and EAR to estimate the extinction rate of species (Kinzig and Harte Citation2000; Pereira, Borda-de-Água, and Martins Citation2012; Keil, Storch, and Jetz Citation2015; Pan Citation2016). Although He and Hubbell concluded that extinction rates were always overestimated by SARs from habitat loss (He and Hubbell Citation2011). Apart from these applications, SAT also has other implications for NPAs and ERPs, especially considering the rotational symmetry of paired SAR and EAR, meaning central point reflection symmetry of these two curves (Pan Citation2013). If the total area is underestimated, the extinction rate will be overestimated (Pan Citation2013). In other words, if larger NPAs and ERPs are divided into multiple small areas, the extinction rate will become higher without considering species dispersal. In field sampling, there exist both Preston Effect (rare species that exist in the community but are absent in the sampling area, and can not be found in the limited sampling area) and Pan Effect (the species with few individuals or hard to be differentiated from other species, and can not be found or are thought as other species in the sampling area due to species identification intensity) (Pan and Zhu Citation2015). According to SAT frame, underestimate or overestimate of real species will be reflected in the sampling area (Pan and Zhu Citation2015).
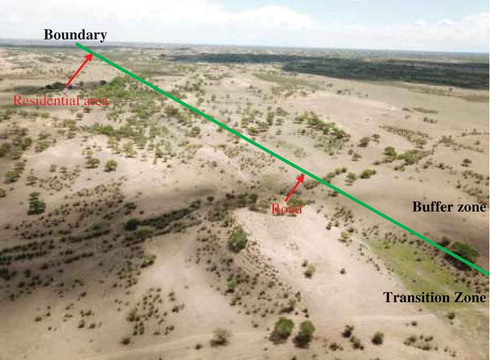
A core problem in conservation and restoration management is how to delimit the boundary of NPAs or ERPs. The impact of anthropic disturbance on the boundary needs to be fully considered here (). Thus, this paper will apply the SAT frame as a qualitative tool to design NPAs or ERPs.
Figure 1. The impact of anthropic disturbance such as residential area and road on the hypothetical boundary of buffer zone and transition zone. The background picture was captured by a DJI Mavic Pro drone
Insights into total number of species and variation of areas
Besides endangered species in NPAs, we want to protect as many species as possible to avoid the impact of anthropic activities, which are important germplasm sources although we do not know how to use them now or they are also potential endangered species. In addition, the conservation of endangered species requires specific habitats, which are usually fragile but home a lot of species. However, before we delimit a natural protected area and conduct a thorough investigation, we usually do not count the number of species in this area, which is usually underestimated caused by the Pan Effect (Pan and Zhu Citation2015). If we use the power law SAR to the extrapolation, the total number of species is prone to be overestimated (Pan et al. Citation2016). Here dilemma emerges due to the Pan effect and extrapolation. In ), the real number of species in the total area A is SA, and Su and So is the underestimated and the overestimated total number of species in this area, respectively. Then, three paired curves are constructed: real SAR and EAR, underestimated SARu and EARu, and overestimated SARo and EARo. Besides the difference in the total number of species among the three pairs, SARo and EARo are higher than SAR and EAR, respectively, and SAR and EAR are higher than SARu and EARu respectively in the diagram. The Pan effect can lead to underestimate of the total number of species and underestimate of species extinction rate, which will cause negative attitudes of the public towards the establishment of NPAs. For example, if an NPA is subject to a disturbance, such as its partial destruction caused by fire, the extinction rate of species will be underestimated due to underestimate of the total number of species. If the total number of species is overestimated, however, the extinction rate will also be overestimated, similar to the consequence caused by underestimate of the total area (Pan Citation2013). For example, if an NPA is subject to a disturbance, the extinction rate of species will be overestimated due to overestimate of the total number of species. Thus, complete biodiversity survey without negative impact on the habitat is important, not only for research or design of NPAs but also for the decisions made by the government or the public.
Figure 2. (a) Paired change of Species-Area Relationship and Endemics-Area Relationships due to the underestimated or overestimated total number of species. A is the total area, SA is the real number of species in area A, Su is the underestimated number of species in area A, and So is the overestimated number of species in area A. (b) Paired change of Species-Area Relationship and Endemics-Area Relationships due to different total areas ,
and
. A is the total area of core zone,
is the reduced total area of core zone, and
is the total area of core zone, buffer zone and transition zone. The number of species SA in area A is assumed as the same in the areas
and
. (c) Paired change of Species-Area Relationship (SAR) and Endemics-Area Relationships (EAR) due to the change of species-abundance. A is the total area, SA is the real number of species in area A. The dashed lines and arrows represent the disturbance and change of SAR, respectively. (d) Two pairs (SAR-EAR and SAR’-EAR’) of Species-Area Relationship (SAR) and Endemics-Area Relationships (EAR) due to the change of species-abundance. A is the total area, SA is the real number of species in area A. The dashed lines and arrows represent the disturbance and change of SAR, respectively
Usually, we want NPAs to be as large as possible, such as the zonation system suggested by the UNESCO-MAB World Network of Biosphere Reserves. In fact, these three zones can be mutual source-sink, although the core zone should have more restricted endemic species. Based on paired connection of SAR and EAR, the impact of external disturbance on the core zone can be mitigated by the buffer and the transition zones (Pan Citation2016). In ), three pairs of curves (real SAR and EAR, small area SARs and EARs, and large area SARl and EARl) are featured with different total areas but the same total number of species, since here we assume that the buffer and transition zones do not inhabit new species compared with the core zone. The total areas are different among three sets of SAR and EAR. Besides, SARs and EARs are closer to left than SAR and EAR, which are even closer to left than SARl and EARl in the diagram. For example, if this area is subject to a disturbance, the extinction rate of species will be reduced due to the expansion of the area. If the area is decreased, however, the extinction rate will be increased ()), and if we consider the extinction debt due to time-lag effect, the extinction rate can be higher (Tilman et al. Citation1994). An expansion of an NPA may not be welcomed by the government or the public due to the loss of economic benefits, though the expansion will be beneficial for biodiversity protection. If there are new species in the buffer and the transition zones, the extinction rate can also be reduced as the area increase, which is shown in Figure 4 as presented in a previous paper in Scientific Reports (Pan Citation2013). Thus, the size of NPA should be determined by considering both biodiversity protection and social development, and appropriate application of SAT can provide a reference for public decision-making.
Insights into variations of species-abundance distribution
The species-abundance distribution describes the number of each species in the community, which will influence the sampling probability of each species and then change the curves of SAR and EAR (Coleman Citation1981). When the habitats are conserved and stay away from the impact of anthropic activities in NPAs and ERPs, the individuals of most species will increase, and the species-abundance distribution will also be changed. As shown in ), there are three pairs of curves: the solid curves represent SAR and EAR in the original habitat, the external pair of dashed curves SAR and EAR in the conserved habitat, and the internal pair of dashed curves SAR and EAR in the impaired habitat. The increase in the individuals of most species has a positive impact on biodiversity protection. For example, if the area is subject to a disturbance, the extinction rate of species will be reduced due to the expansion of total species abundance. If the individuals of most species decrease, however, the extinction rate will increase. In fact, if the buffer and the transition zones are conserved and stay away from human interference, the abundance of species will be increased, meaning that more individuals will habitat in the buffer and the transition zones. Consequently, the EAR curve will be moved downward further and mitigation effect of the expansion of the area will be enhanced.
The change pattern of species-abundance distribution is complex. For example, after the control of an invasive species to a community, some species may become increasingly abundant from only a few individuals, while the number of other species may decrease continuously (Bradley et al. Citation2019). In this possible situation, the paired SAR and EAR may change as shown in ): SAR and EAR in the small area may go downward, while SAR and EAR in the large area may go upward. In this case, if this area is subject to a disturbance in a small area, the extinction rate of rare species may be reduced.
Inspiration for conservation and restoration management
Delimitation of boundary means the identification of area. Large area and high species abundance are important in species conservation and ecosystem restoration, which is supported by the analysis in the frame of Species-Area Theory. Thus, the first principle of conservation and restoration management is to have as large an area as possible or as many species as possible. In addition, the threshold identification of minimum area requirement of concerned species must be considered in the plan, as the core zone should be large enough to cover dispersal abilities of concerned species to hold enough populations (Deane and He Citation2018). However, the balance needs to be considered between ecological protection and societal development. Because without sustainable development of society, the impact of anthropic disturbances on the NPAs or ERPs will be heavy.
In addition, we should be careful of the disturbance. In my opinion, natural disturbances are an inherent part of ecosystem dynamics, and we should leave or keep these disturbances in conservation and restoration management. However, we need to decrease or even avoid anthropic disturbances as much as possible in the NPAs or ERPs except there is an ecological necessity. Thus, the dispersal abilities of concerned species should be considered into the plan, as these species maybe require the minimum area to avoid the anthropic impact.
Finally, there is no uniform plan for conservation and restoration management. This article just presents the usage of SAT frame as a qualitative tool, and detailed plans need to be explored based on actual situations. Thus, we should get as much information as possible, not only the number and distribution of species but also the geographical, climatic and social data. With technological development, we can use unmanned aerial vehicle and artificial intelligence to overcome Preston Effect and Pan Effect.
Author Contributions
The author listed has made substantial, direct and intellectual contribution to the work, and approved it for publication.
Acknowledgments
The author is thankful to the reviewers for their valuable inputs on the previous draft of this article. The views and opinions presented in this article are attributed to the author.
Disclosure statement
No potential conflict of interest was reported by the author.
Additional information
Funding
Related Research Data
References
- Bradley, B. A., B. B. Laginhas, R. Whitlock, J. M. Allen, A. E. Bates, G. Bernatchez, J. M. Diez, et al. 2019. “Disentangling the Abundance–Impact Relationship for Invasive Species.” Proceedings of the National Academy of Sciences 116 : 9919–9924. doi:10.1073/pnas.1818081116.
- Coleman, B. D. 1981. “On Random Placement and Species-area Relations.” Mathematical Biosciences 54: 191–215. doi:10.1016/0025-5564(81)90086-9.
- Deane, D. C., and F. L. He. 2018. “Loss of Only the Smallest Patches Will Reduce Species Diversity in Most Discrete Habitat Networks.” Global Change Biology 24: 5802–5814. doi:10.1111/gcb.14452.
- Desmet, P., and R. Cowling. 2004. “Using the Species–Area Relationship to Set Baseline Targets for Conservation.” Ecology and Society 9: 11. doi:10.5751/ES-01206-090211.
- He, F. L., and S. P. Hubbell. 2011. “Species–Area Relationships Always Overestimate Extinction Rates from Habitat Loss.” Nature 473: 368–371. doi:10.1038/nature10079.
- Keil, P., D. Storch, and W. Jetz. 2015. “On the Decline of Biodiversity Due to Area Loss.” Nature Communications 6: 8837. doi:10.1038/ncomms9837.
- Kinzig, A. P., and J. Harte. 2000. “Implication of Endemics-area Relationships for Estimates of Species Extinctions.” Ecology 81: 3305–3311.
- Pan, X. 2013. “Fundamental Equations for Species-Area Theory.” Scientific Reports 3: 1334. doi:10.1038/srep01334.
- Pan, X. 2015. “Reconstruct the Species-Area Theory Using Set Theory.” National Academy Science Letters 38: 173–177. doi:10.1007/s40009-014-0319-3.
- Pan, X. 2016. “Application of Fundamental Equations to Species−area Theory.” BMC Ecology 16: 42. doi:10.1186/s12898-016-0097-5.
- Pan, X., X. Zhang, F. Wang, and S. Zhu. 2016. “Potential Global-Local Inconsistency in Species-Area Relationships Fitting.” Frontiers in Plant Science 7: 1282. doi:10.3389/fpls.2016.01282.
- Pan, X., and S. Zhu. 2015. “Matthew Effect in Counting the Number of Species.” Biodiversity and Conservation 24: 2865–2868. doi:10.1007/s10531-015-0956-y.
- Pereira, H. M., L. Borda-de-Água, and I. S. Martins. 2012. “Geometry and Scale in Species-area Relationships.” Nature 482: E3–E4. doi:10.1038/nature10857.
- Tilman, D., R. M. May, C. L. Lehman, and M. A. Nowak. 1994. “Habitat Destruction and the Extinction Debt.” Nature 371: 65–66. doi:10.1038/371065a0.