
 ?Mathematical formulae have been encoded as MathML and are displayed in this HTML version using MathJax in order to improve their display. Uncheck the box to turn MathJax off. This feature requires Javascript. Click on a formula to zoom.
ABSTRACT
Introduction: Large stocks of “blue carbon” exist in the ecosystems of coastal wetlands. This paper presents a case study of the Chinese city of Yancheng. First, through field surveys and laboratory analysis, changes in the organic carbon (OC) content in typical plant communities throughout the study area are described in detail. Second, an OC burial rate and economic value model is constructed to analyze the composition of the carbon sink values.
Outcomes/other: The results are as follows: Of the typical plant communities, Spartina alterniflora has the highest OC content (5.80 g·kg-1), followed by Suaeda glauca (4.78 g·kg-1) and Phragmites australis (3.76 g·kg-1); the contemporary OC sedimentation rates are 2.01, 1.48, and 1.22 cm·yr-1, respectively. Spartina alterniflora communities have the highest annual average carbon sink value ($418.74/ha) in the study area, followed by Phragmites australis ($176.29/ha) and Suaeda glauca ($101.54/ha).
Discussion: As a result of both the expansion of the Spartina alterniflora area and coastal erosion, the total OC value since 1987 has displayed two-stage characteristics: it first increased and then decreased.
Conclusion: In recent years, the annual average decline in OC value has ranged from approximately $82,100 to $123,100 (reference: the Sweden carbon tax provided by the World Bank, 130$/ton)
Introduction
Coastal wetlands perform a unique set of physical, chemical, and biological functions that provide billions of dollars of ecosystem services annually (White and Kaplan Citation2017). Dense cities constitute biogeochemical hot spots along shorelines with concentrated amounts of fixed carbon and nitrogen that are subsequently discharged into adjacent coastal receiving waters (Gao et al. Citation2017). Mangroves, salt marshes, and seagrass beds represent typical coastal wetland ecosystems in which the vegetation and soil store a considerable amount of “blue carbon” (Mcleod et al. Citation2011; Grimsditch et al. Citation2013) in their vegetation and soils. However, when these wetlands are converted to other uses, this stored carbon can be released in the form of greenhouse gases (Ahmeda et al. Citation2017; Ashok et al. Citation2019; Ewers Lewis et al. Citation2019). Coastal wetlands are threatened specifically by increasing disturbance of natural habitats, coastal erosion, land reclamation, and eutrophication (Macreadie, Hughes, and Kimbro Citation2013; Theuerkauf et al. Citation2015; Rozaimi et al. Citation2016; Ruiz-Fernández et al. Citation2018). Blue carbon may be released into the atmosphere under these conditions, making these ecosystems an important component of the land-sea carbon cycle (Chmura et al. Citation2003). The restoration of coastal wetlands may now be financed through a growing carbon-offset market; therefore, quantitative evaluations of the capacity of coastal ecosystems to store blue carbon and the changes they are facing are garnering increasing attention.
The most promising market mechanisms for managing blue carbon are regulated cap-and-trade schemes (Ullman, Bilbao-Bastida, and Grimsditch Citation2013). Rogers et al. (Citation2016) proposed a series of actions that may improve protections for tidal wetlands and their ecosystem services by building interest in the recently recognized value of tidal marshes in carbon offset markets. One tool for preserving this critical ecosystem service is to provide payments to landowners and managers for storing coastal blue carbon if protocols that allow these carbon stores to be traded on carbon markets can be developed (Sifleet, Pendleton, and Murray Citation2011). However, to accurately quantify the CO2 equivalent value of blue carbon stocks in a given ecosystem, the scope of the ecosystem and the depth of the sediment carbon pool must be clearly defined; thus, a lack of relevant data is a major obstacle within this subject field (Duarte et al. Citation2011). While numerous researchers have quantitatively analyzed the carbon pools and fluxes of blue carbon systems in a variety of habitats, their results show relatively significant differences in the annual average carbon sequestration rates among mangrove forest, saltmarsh, and seagrass bed ecosystems in various regions (Sanders et al. Citation2010; Mcleod et al. Citation2011; Gao et al. Citation2016; Thorhaug et al. Citation2019) or between similar ecosystems in different countries (Gao et al. Citation2016; Macreadie et al. Citation2017).
As global change occurs and causes increasing uncertainty, accurate descriptions of blue carbon densities and depths in coastal wetlands in various regions can guide the implementation of reasonable wetland vegetation rehabilitation measures to increase carbon sinks; consequently, accurate descriptions of the characteristics of blue carbon is of great importance to adequately respond to the risk of rising sea levels in the future (Macreadie et al. Citation2017). To date, many macro-scale studies have been performed on the blue carbon in China’s coastal ecosystems (Gao et al. Citation2016; Zhou et al. Citation2016; Meng et al. Citation2019); in contrast, micro-scale studies are relatively rare. Thus, this paper presents a case study of the Chinese city of Yancheng using a combination of field data and laboratory analysis. The distribution characteristics and annual average accumulation rate of blue carbon in the coastal wetlands of Yancheng are analyzed based on an estimation of the total organic carbon (OC) content of soils in typical plant communities. The carbon sink value of a typical coastal wetland is described on this basis and the losses of blue carbon resulting from coastal erosion and its uncertainties are discussed.
Materials and methods
The case study area and sampling settings
The coastal wetlands of Yancheng are located along the eastern coastline of Jiangsu Province, China ()); this coastal area lies entirely between the abandoned Yellow River Estuary and the Paleo-Yangtze River Delta (north of the modern Yangtze River Estuary). Due to an abundant sediment supply and the wave action of ocean currents (Liu et al. Citation2008), sediments have accumulated in the southern extent of the study area, whereas erosional retreat has occurred in the northern part. Thus, in this study, sampling sites were established in the eroded setting of the northern study area to accurately reflect the sedimentation rates therein.
Previous research (Wang et al. Citation2005; Liu et al. Citation2008; Gao et al. Citation2012) has shown that the succession of vegetation in the study area displays relatively notable multistage characteristics. Before 1963, the intensity of human activity in the study area was low and the main vegetation was Suaeda glauca and mudflats. Spartina anglica was introduced to the central and southern parts of the study area in 1963 to facilitate the accumulation of sediment, while Spartina alterniflora was introduced to protect the gradually eroding coastline in the northern regions. Habitats for migratory birds (e.g., Grus japonensis) gradually decreased as the area of farmland expanded throughout the study region. The active construction of engineering structures such as artificial fishponds and waterfowl lakes, which were built to increase the carrying capacities of habitats, began in 1994; it resulted in an increased presence of Phragmites australis and a continuous decrease in Suaeda glauca in the area.
Figure 1. Location of the study area (a) and sketch map of the sampling sections (b)
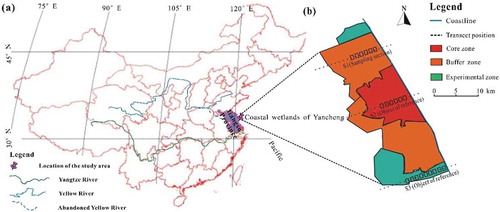
Sampling sites and reference objects were established for Yancheng ()), and sample cores were collected in August 2017 to compare this study’s findings in the southern experimental zone (S3) and core zone (S2) study areas with previous sedimentological results (Wang et al. Citation2005; Liu et al. Citation2008). Because the typical vegetation types in the study area are in the order Phragmites australis, Suaeda glauca, Spartina alterniflora, and uncovered mudflats, from land to sea, a relatively continuous vegetation succession sequence was selected; one section (S1) was randomly positioned in the northern buffer zone. Six quadrats were set according to the community transition sequence (i.e., Phragmites australis mudflat, Phragmites australis and Suaeda glauca-mixed mudflat, Suaeda glauca mudflat, Suaeda glauca and Spartina alterniflora-mixed mudflat, Spartina alterniflora mudflat, and uncovered mudflat), and two measurements were acquired for every community.
Sample preparation and laboratory analysis
Sample preparation process
First, each of the 6 sediment cores was split lengthwise into two parts; then, their color, lithology and sedimentary structure were determined using a ruler, and each sediment core was photographed. Then, in reference to previous studies (Wang et al. Citation2005; Liu et al. Citation2008), the sample compression rate of each sedimentary column is calculated based on collected field records and then its true length is restored; each sediment core (0 to 100 cm from the ground depth) was divided into 50 sections at intervals of 2 cm. Then, the resulting sections were dried in a Martin Christ ALPHA-1-4 freeze dryer and subsequently weighed to determine their mass (g). Finally, each sample was ground and sieved through a 150-mesh sieve. Absolute dating of each sediment core was performed using the lead-210 (210Pb) dating method. The total OC content (g∙kg−1) was determined using a Thermo Flash EA 1112 element analyzer. The particle size of each sample was determined using a Malvern Mastersizer 2000 laser particle analyzer.
Laboratory analysis and calculation
First, IBM SPSS 20.0 software was utilized to determine significant differences in the OC contents between different communities (t test), significance differences in the OC contents between different soil layers within the same community (one-way analysis of variance), and the correlation between the OC content and sediment particle size. Then, the average particle size and sorting coefficient of sediments were calculated using the Folk–Ward formula to discuss the loss of carbon sinks caused by coastal erosion. Finally, the calculation results for relevant parameters were plotted using Microsoft Excel 2007.
Bulk density (kg∙cm−3) and the contemporary sedimentation rate (m∙yr−1) were calculated for each sediment core based on the weight and absolute chronological data of the samples obtained in the above steps. The annual average amount of OC accumulated per ha, i.e., the OC concentration (t∙ha−1∙yr−1), was calculated based on the average values:
where Cu (g∙ha−1∙yr−1) and Cn (g∙kg−1) are the annual average OC burial rate and content, respectively; Wu (g∙cm−3) and Sr (cm∙yr−1) are the bulk density and sedimentation rate of contemporary soil, respectively; and Icc (a constant) is a unit conversion factor.
A green plant can sequestrate 12 g of carbon upon absorbing 44 g of carbon dioxide (CO2) via photosynthesis. Based on this, the carbon sink value in this study was calculated with reference to a model of the social cost of carbon (Carra et al. Citation2017) as follows:
where Cd (g∙ha−1∙yr−1) is the capacity of a specific type of vegetation to absorb CO2; Tr (a constant) is the product of the carbon tax factor ($130∙t-1 according to the latest carbon tax issued by the World Bank) and the unit conversion factor; Vbc ($∙ha−1∙yr−1) and TVbc ($∙ha−1∙yr−1) are the unit carbon sink values of various plant communities (based on the estimated economic damage caused by the release of an additional metric ton of CO2 into the atmosphere) and the total carbon sink value of all the types of plant communities, respectively; Ar (ha) is the area; and i is the type of vegetation.
Results
Estimation of the OC content and its average in typical plant communities
shows that the changes in the OC content curve for sample A (located in the Phragmites australis mudflat, average = 4.38, n = 50, p < 0.01) can be approximately divided into two stages; namely, a steady increasing stage and a sharp decreasing stage with depth ranges of 0–84 cm and > 84 cm, respectively. The steadily increasing stage can be further divided into two substages: at depths of < 54 cm, the OC content ranges from 3.52 to 4.96 g∙kg−1; at depths of 56–84 cm, this value ranges from 5.00 to 5.26 g∙kg−1. A sudden change occurs at the depth of 86 cm, where the OC content decreases to the range of 3.76–4.09 g∙kg−1. Compared to its counterpart for sample A, the OC curve for sample B (located in the Suaeda glauca mudflat, average = 4.36, n = 50, p < 0.01) is relatively straight. While there is no notable sudden change point, the changes in the OC content of sample B can still be divided into two stages: at depths of < 82 cm, the OC content ranges from 4.01 to 4.61 g∙kg−1; at depths of 86–100 cm, the OC content decreases to the range of 3.75–3.91 g∙kg−1. The OC content curve of sample C (located in the Spartina alterniflora mudflat, average = 5.24, n = 50, p < 0.01) displays relatively notable multistage characteristics. At depths of < 44 cm, the OC content ranges from 5.59 to 5.97 g∙kg−1; at depths of 46–78 cm, the OC content ranges from 5.01 to 5.26 g∙kg−1; finally, at depths of 80–100 cm, the OC content ranges from 3.76 to 4.53 g∙kg−1.
Figure 2. Vertical distribution characteristics of the organic carbon (OC) content
Contemporary sedimentation rates in typical plant communities in the study area
The following classifications are determined based on the changes in the OC content of each sample at various stages () in combination with the vegetation succession in the study area. Three sedimentation stages are discerned from sample A corresponding to Phragmites australis (depth range: < 28 cm), Suaeda glauca (28–84 cm) and mudflats (> 84 cm). Two sedimentation stages are discerned from sample B corresponding to Suaeda glauca (depth range: < 80 cm) and mudflats (> 80 cm). Three sedimentation stages are discerned from sample C corresponding to Spartina alterniflora (depth range: < 44 cm), Suaeda glauca (44–82 cm) and mudflats (> 82 cm). Based on this, the average OC content in each typical plant community throughout the study area is determined as follows: Phragmites australis: 3.76 g∙kg−1; Suaeda glauca: 4.78 g∙kg−1; and Spartina alterniflora: 5.80 g∙kg−1.
Sampling site A is in a Phragmites australis community situated above the average high tide level. The sediment core extracted from this location (i.e., sample A) displays three-stage characteristics: the part of sample A 28 cm below the surface exhibits a gray color and consists of clay; that from 28–84 cm below the surface also exhibits a gray color but consists mainly of silty sand; and that from sample A at 84–100 cm below the surface is a tawny color and consists of sand. Sampling site B is in a Suaeda glauca community situated between the average high tide and average mid-tide levels. The sediment core extracted from sampling location B (i.e., sample B) displays two-stage characteristics: the part of sample B from 80 cm below the surface is a gray color and consists mainly of silty sand, while the part 80–100 cm below the surface is a tawny color and consists of sand. Sampling site C is in a Spartina alterniflora community situated between the average mid-tide and average low tide levels. The sediment core extracted from sampling location C (i.e., sample C) displays three-stage characteristics: the part of sample C from 44 cm below the surface is black and consists of clay; the part from 44–82 cm below the surface is gray and consists mainly of silty sand; and the part of from 82–100 cm below the surface is a tawny color and consists of sand.
Figure 3. Sedimentary characteristics of typical plant communities in the study area
Based on the sedimentation stages discerned from the three sediment cores, their absolute dates were determined using the 210Pb dating method and used to calculate the sedimentation rates. To improve the accuracy of the results, they were compared with those obtained by previous researchers (). In their analysis with the 137Cs dating method, Wang et al. (Citation2005) found that deposition rates in mudflats and Spartina anglica flats of 2.00 cm∙yr−1 and 3.00 cm∙yr−1, respectively; in contrast, Liu et al. (Citation2008) used event dating to reveal the deposition rates for mudflats, Spartina alterniflora flats, and Suaeda glauca flats to be 2.34 cm∙yr−1, > 3.09 cm∙yr−1 (max = 4.40), and 2.09 cm∙yr−1, respectively. This study, which is based on 210Pb dating analysis, showed that the sedimentation rates of Suaeda glauca, Spartina alterniflora, and Phragmites australis flats were 1.48 cm∙yr−1, 2.01 cm∙yr−1, and 1.22 cm∙yr−1, respectively.
Table 1. Comparison of the sedimentation rates obtained in the study area
Carbon sink values of typical plant communities in the study area
The average OC burial rates in the study area’s plant communities were estimated based on estimates of the OC content, the sedimentation rate and the soil bulk density within typical plant communities throughout the study area; the corresponding carbon sequestration capacities and carbon sink values were determined based on the estimated OC burial rates in those plant communities ().
Figure 4. Carbon sequestration capacities and carbon sink values of typical types of vegetation
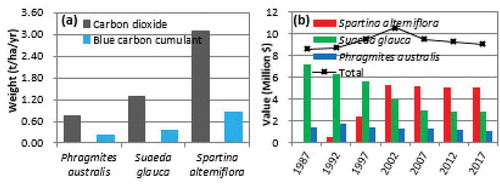
) shows a comparison among Phragmites australis, Suaeda glauca, and Spartina alterniflora based on the annual average carbon sequestration capacity and the annual average carbon burial rate. Spartina alterniflora has the capacity to absorb CO2 at an average rate of 3.08 t∙ha−1∙yr−1, and the annual average amount of OC it accumulated per ha reaches 0.84 t. Suaeda glauca has the capacity to absorb CO2 at an average rate of 1.30 t∙ha−1∙yr−1, and the annual average amount of OC it accumulated per ha reaches 0.35 t. Phragmites australis has the capacity to absorb CO2 at an average rate of only 0.75 t∙ha−1∙yr−1, and the annual average amount of OC it accumulated per ha reaches 0.20 t.
) shows the trends of the changes in the OC sink value in the past 30 years as well as the related composition of the annual carbon sink value. For the contribution to the OC sink value, before 2002, the contribution of Suaeda glauca accounted for over 50% of the total OC sink value. Conversely, the contribution of each Phragmites australis and Spartina alterniflora plant accounted for less than 20% of the total carbon sink value. Beginning in 2002, the roles of Suaeda glauca and Spartina alterniflora began to reverse; the contribution of the latter gradually decreased to less than 40% of the total carbon sink value, whereas the contribution of the latter accounted for more than 50% of the total carbon sink value and stabilized. In the overall trend, the total carbon sink value of the study area displayed two-stage characteristics separated by the value of $10.54 million in 2002. The total carbon sink value of the study area increased at an annual rate of 1.53% between 1987 and 2002 and then decreased at an annual rate of 0.96% between 2002 and 2017. During the latter stage, the total carbon sink value of the study area suffered a loss of $1.51 million.
Discussion
Factors affecting OC burial rates in coastal wetlands
Blue carbon habitats (such as saltmarshes, mangroves, and seagrass beds) have a tremendous capacity to capture and store carbon dioxide from the atmosphere. However, blue carbon burial rates vary with relative significance between different regions or different vegetation types. An OC burial rate estimation model containing three variables, namely, the OC content, soil bulk density and sedimentation rate, was constructed in this study to improve the estimation reliability. Based on this model, the annual average OC accumulated in the Phragmites australis, Suaeda glauca, and Spartina alterniflora communities were determined (0.020, 0.035, and 0.084 kg∙m−2∙yr−1, respectively); overall, these estimates were lower than those of previous studies (Xu et al. Citation2014). In general, the estimates in this study, and specifically the results for Spartina alterniflora communities, were substantially lower than those of previous investigations mainly due to the three input variables of the model.
First, the measurements of the OC content within the Phragmites australis, Suaeda glauca, and Spartina alterniflora communities in the study area were 3.76, 4.78, and 5.80 g∙kg−1, respectively, which are relatively close to the previous results for the study area (3.05, 3.46, and 6.18 g∙kg−1, respectively) (Gao et al. Citation2012). While the measurement of the OC content in the Spartina alterniflora communities obtained in this study was relatively low, the measurements of the OC content in the Phragmites australis and Suaeda glauca communities were higher than previously determined. Therefore, the OC content’s contribution to the relatively low results was insignificant.
Second, the measurements of the bulk density of the soil in the Phragmites australis, Suaeda glauca and Spartina alterniflora communities in the study area were 0.444, 0.502, and 0.724 g∙cm−3, respectively, which are lower than the results of Mao et al. (Citation2010) for this region (1.47, 1.40, and 1.28 g∙cm−3, respectively). Because the samples were sealed immediately after collection and brought back to the laboratory for pretreatment, errors caused by experimental operations were likely negligible. Thus, i the relatively low measurements of the bulk density of soil mainly were likely a result of the differences among the region, landform and topography characteristics between sampling sites; e.g., differences in the soil moisture content and soil structure caused by elevation.
Finally, the measurements of the sedimentation rate in the Phragmites australis, Suaeda glauca and Spartina alterniflora communities in the study area were 1.22, 1.48, and 2.01 cm∙yr−1, respectively. While these results were similarly lower than the findings of previous studies for this area (Tab. 2), the main time nodes of the vegetation succession time series that were established based on these measurements for the study area are mostly in agreement with the stages of changes in vegetation cover. Therefore, apart from the differences caused by the use of different dating methods, the relatively low measurements of the sedimentation rate were likely caused mainly by the different sampling sites. Wang et al. (Citation2005) and Liu et al. (Citation2008) collected their samples in the southern experimental zone and core zone, respectively, in Yancheng Nature Reserve. Compared to the central and southern Yancheng Nature Reserve, in which the extent of silt is expanding, the sampling sites established in this study were located along the northern buffer zone, which is gradually retreating as a result of erosion. Thus, the relatively low sedimentation rates in this area are reasonable.
Loss of carbon sink in coastal wetlands caused by coastal erosion
Many reports have indicated that sea level rise can stimulate sedimentary accretion; for example, in regions where tropical storms are a frequent occurrence, storm surge deposits are an important mechanism for maintaining both overall accretion and OC burial rates (Smoak et al. Citation2013; Carnero-Bravo et al. Citation2018). However, the conversion of these by coastal erosion also impacts carbon absorptivity and large pools of previously sequestered carbon (Pendleton et al. Citation2012).
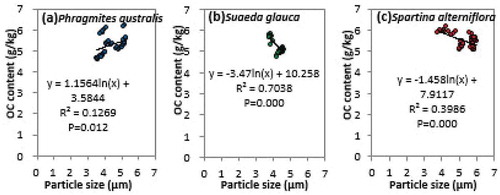
Firstly, carbon absorptivity is highly sensitive to the particle size. Previous investigations have revealed a negative correlation between the sediment particle size and carbon absorptivity within coastal zones (Keil et al. Citation1994; Mayer Citation1994). Vegetation growth can alter flow rates and suspended matter concentrations in the mudflats in coastal wetlands, thereby affecting the sedimentation process and particle size distribution of the mudflats’ surface soil by altering the hydrodynamic conditions. Therefore, coastal erosion may have resulted in a relatively low OC content in the sediments in the study area, which may have affected the carbon sequestration capacity of the vegetation per unit area ().
As demonstrated in , there is a nonsignificant positive correlation (R2 = 0.1269, p < 0.05) between the sediment particle size and OC content for Phragmites australis communities situated above the average high tide level. Conversely, there is a significant negative correlation between the sediment particle size and OC content for the Suaeda glauca (R2 = 0.7038, p < 0.01) and Spartina alterniflora (R2 = 0.3986, p < 0.01) communities situated, respectively, at and below the average mid-tide level. Therefore, in the northern study area that suffers from coastal erosion, the sediments in Spartina alterniflora and Suaeda glauca communities that are relatively close to the coastline are composed mainly of sand. As a result, the sedimentation rates in these Spartina alterniflora communities are lower than those in the central and southern study areas characterized by the occurrence of slow siltation, and the OC on the surface of these communities is more easily transported by seawater to the ocean. Consequently, the OC content in these Spartina alterniflora communities is also relatively low.
Figure 5. Correlations between the sediment particle size and organic carbon (OC) content
Secondly, geomorphology was the most important predictor of OC stocks (Macreadie et al. Citation2017); if coastal wetlands cannot transgress upland at a rate equivalent to that at which the shoreline retreats, the marsh will become narrow, thus reducing the area available for carbon storage (Macreadie, Hughes, and Kimbro Citation2013) and resulting in the loss of OC into seawater due to coastal erosion.
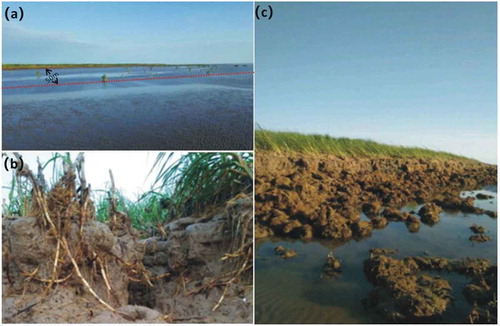
shows the retreat of the coastline caused by coastal erosion ()), the uprooting of Spartina alterniflora ()) and serious damage inflicted upon a local mudflat in the northern Yancheng Nature Reserve. Compared to Suaeda glauca and Spartina anglica, Spartina alterniflora plants are taller and denser and have more developed root systems ()); thus, they can protect muddy coasts more effectively. Therefore, Spartina alterniflora was introduced to the study area beginning in the 1990s and a relatively satisfactory protective effect was initially achieved. However, with a decreasing number of sediment sources and an ever-increasing risk of rising sea levels, coastlines can no longer be satisfactorily protected by relying on Spartina alterniflora alone ()). Based on this study’s field survey and measurements conducted in November 2015 as well as interviews with the management team for the Yancheng Nature Reserve, the eroded coastline in the northern study area was estimated to have retreated at a rate of approximately 20 to 30 m∙yr−1. Thus, the carbon sink value of the eroded 98-km-long coastline in the northern buffer zone and northern experimental zone of study area has suffered a loss of approximately $82,100 to $123,100 each year.
Figure 6. Coastline retreat (a) and shrinking of wetlands (b, c) caused by coastal erosion
Notably, the total value of carbon sinks – as with any goods and services – depends on how and when the carbon price is set. Currently, carbon tax prices are not uniform (Ullman, Bilbao-Bastida, and Grimsditch Citation2013; Shi et al. Citation2019; WB, Citation2019). According to the data provided by the World Bank, carbon taxes in developing countries are generally low. Considering the current situation of economic development and coastal erosion in the study area, this paper adopts the Sweden carbon tax ($130 per ton), which is the highest in the world. Nevertheless, the carbon sink value loss obtained in this paper may still be a relatively conservative estimate.
Uncertainties and complexity of the carbon source/sink mechanism in coastal wetlands
Coastal wetlands are subjected to multiple impacts due to site conditions and land cover types in addition to various external factors. Thus, the carbon sequestration capacity and source/sink qualities of coastal wetlands are complex and uncertain (Alongi Citation2011; Pendleton et al. Citation2012). The protection of blue carbon resources can mitigate climate change; however, ongoing climate change affects the environments of coastal wetlands in different regions, and especially with the superimposed effects of human factors such as land use change. For example, seawater eutrophication and environmental pollution caused by aquaculture can accelerate the decomposition of soil organic carbon in an ecosystem (Gao et al. Citation2016; Rozaimi et al. Citation2016), and water conservation projects and agricultural expansion in watersheds may alter the carbon sequestration capacities of coastal wetlands (Hopkinson and Cai Citation2012). All these actions may lead to the mutual conversion of carbon sources and sinks in coastal wetlands.
Being limited by the field of study, we discuss the influences of relevant factors on the carbon sequestration capacity of coastal wetland vegetation and its value from both microcosmic and macroscopic perspectives. The carbon stocks in coastal wetlands vary with relative significance among different regions. In addition, due to different soil compositions and sedimentation rates, relatively substantial differences in the distribution of OC are observed within the same region. Notably, an ecosystem is composed of organisms and their surrounding environment. The respiration of the ecosystem and the gas exchange process between organisms and the external environment are complex (Pendleton et al. Citation2012). Spatial differentiation in the tidal intrusion frequency, wetland flooding duration, plant density and cover, and soil physical and chemical properties (Bianchi et al. Citation2013) can result in uncertainty in a wetland’s carbon cycle process. Therefore, the quantitative evaluation results of the carbon sequestration capacities for the different vegetation types presented in this study may deviate from the actual, real-world situation.
Conclusions
Blue carbon in coastal wetlands is indicative of changes in land use type and land cover as well as global environmental and climate changes. Rehabilitating and increasing carbon sinks in coastal wetlands likely constitute some the most important means of coping with rising sea levels. This study reveals the distribution pattern of OC in a coastal wetland based on field soil survey data and calculates the annual average carbon sink values of various wetland types using the carbon tax method; then, this paper discusses the changes in the carbon sink value and the potential impacts of coastal erosion on the carbon sink values in coastal wetlands.
Coastal wetland vegetation has an important positive effect on mitigating climate change through carbon sequestration. In the Chinese city of Yancheng, the OC contents in Phragmites australis, Suaeda glauca and Spartina alterniflora communities are 3.76, 4.78, and 5.80 g∙kg−1, respectively; the annual average amounts of OC accumulated in these three types of plant communities are 0.020, 0.035, and 0.084 kg∙m−2∙yr−1, respectively; and the annual average carbon sink values of these three types of plant communities are $418.74, $176.29, and $101.54 per ha, respectively. The total carbon sink value since 1987 has displayed two-stage characteristics: it first increased and then decreased. In recent years, the total carbon sink value of Yancheng has suffered an annual average loss of approximately $82,100 to $123,100. Furthermore, the carbon source/sink mechanism in muddy coastal wetlands is complex and uncertain.
The coastal wetlands of Yancheng are situated to the north of the Yangtze River Estuary and to the south of the Yellow River Estuary. Due to an abundant sediment supply and the action of ocean currents, sediments have accumulated in the southern study area, whereas erosional retreat has occurred in the northern study area. Coastal erosion reduces the carbon stocks and burial rates in sediments, and the shrinking of wetland areas results in the gradual loss of the carbon sink value of coastal zones. These results underscore the importance of conserving existing coastal wetlands and mitigating coastal erosion. Although the science supporting these initial estimates will need to be refined in coming years, policies encouraging the sustainable management of coastal wetlands will significantly reduce the loss of blue carbon in addition to sustaining the widely recognized ecosystem services of coastal habitats.
Disclosure statement
No potential conflict of interest was reported by the author.
Additional information
Funding
Related Research Data
References
- Ahmeda, N., W. Cheung, S. Thompsona, and M. Glaserb. 2017. “Solutions to Blue Carbon Emissions: Shrimp Cultivation, Mangrove Deforestation and Climate Change in Coastal Bangladesh.” Marine Policy 82: 68–75. doi:10.1016/j.marpol.2017.05.007.
- Alongi, D. M. 2011. “Carbon Payments for Mangrove Conservation: Ecosystem Constraints and Uncertainties of Sequestration Potential.” Environmental Science & Policy 14 (4): 462–470. doi:10.1016/j.envsci.2011.02.004.
- Ashok, A., M. Cusack, V. Saderne, P. K. Krishnakumar, L. Rabaoui, M. A. Qurban, C. M. Duarte, and S. Agustí. 2019. “Accelerated Burial of Petroleum Hydrocarbons in Arabian Gulf Blue Carbon Repositories.” Science of the Total Environment 669: 205–212. doi:10.1016/j.scitotenv.2019.01.437.
- Bianchi, T. S., M. A. Allison, J. Zhao, X. Li, R. S. Comeaux, R. A. Feagin, and R. W. Kulawardhana. 2013. “Historical Reconstruction of Mangrove Expansion in the Gulf of Mexico: Linking Climate Change with Carbon Sequestration in Coastal Wetlands.” Estuarine Coastal & Shelf Science 119: 7–16. doi:10.1016/j.ecss.2012.12.007.
- Carnero-Bravo, V., J. Sanchez-Cabeza, A. C. Ruiz-Fernández, M. Merino-Ibarra, J. A. Corcho-Alvarado, H. Sahli, J. Hélie, et al. 2018. “Sea Level Rise Sedimentary Record and Organic Carbon Fluxes in a Low-lying Tropical Coastal Ecosystem.” Catena 162: 421–430. doi:10.1016/j.catena.2017.09.016.
- Carra, E. W., Y. Shirazia, G. Parsonsa, P. Hoaglandb, and C. K. Sommerfieldc 2017. “Modeling the Economic Value of Carbon Sequestration by Wetlands in the Delaware Estuary: Historic Estimates and Future Projections.” https://doi.org/10.1016/j.jenvman.2017.10.018
- Chen, C. J. 1994. “Effect of Increasing Deposition and Defending Seashore by Planting Sparrtina Anglica on Beach in Jiangsu Province.” Marine Science Bulletin 13(2): 55–61. In Chinese.
- Chmura, G. L., S. C. Anisfeld, D. R. Cahoon, and J. C. Lynch. 2003. “Global Carbon Sequestration in Tidal, Saline Wetland Soils.” Global Biogeochemical Cycles 17 (4): 22. doi:10.1029/2002GB001917.
- Duarte, C. M., H. Kennedy, N. Marbà, and I. Hendriks. 2011. “Assessing the Capacity of Seagrass Meadows for Carbon Burial: Current Limitations and Future Strategies.” Ocean & Coastal Management 83: 32–38. doi:10.1016/j.ocecoaman.2011.09.001.
- Ewers Lewis, G. J., J. A. Baldock, B. Hawke, P. S. Gadd, A. Zawadzki, H. Heijnis, G. E. Jacobsen, K. Rogers, and P. I. Macreadie. 2019. “Impacts of Land Reclamation on Tidal Marsh ‘blue Carbon’ Stocks.” Science of the Total Environment 672: 427–437. doi:10.1016/j.scitotenv.2019.03.345.
- Gao, J. H., F. M. Bai, Y. Yang, S. Gao, Z. Y. Liu, and J. Li. 2012. “Influence of Spartina Colonization on the Supply and Accumulation of Organic Carbon in Tidal Salt Marshes of Northern Jiangsu Province, China.” Journal of Coastal Research 28 (2): 486–498. doi:10.2112/JCOASTRES-D-11-00062.1.
- Gao, Y., T. Yang, Y. F. Wang, and G. R. Yu. 2017. “Fate of River‐transported Carbon in China: Implications for Carbon Cycling in Coastal Ecosystems.” Ecosystem Health and Sustainability 3 (3): e01265. doi:10.1002/ehs2.1265.
- Gao, Y., G. R. Yu, T. T. Yang, Y. L. Jia, N. P. He, and J. Zhuang. 2016. “New Insight into Global Blue Carbon Estimation under Human Activity in Land-sea Interaction Area: A Case Study of China.” Earth-Science Reviews 159: 36–46. doi:10.1016/j.earscirev.2016.05.003.
- Grimsditch, G., J. Alder, T. Nakamura, R. Kenchington, and J. Tamelander. 2013. “The Blue Carbon Special Edition - Introduction and Overview.” Ocean & Coastal Management 83 (10): 1–4.
- Hopkinson, C. S., and W. J. Cai. 2012. “Carbon Sequestration in Wetland Dominated Coastal Systems a Global Sink of Rapidly Diminishing Magnitude.” Current Opinion in Environmental Sustainability 4 (2): 186–194.
- Keil, R. G., D. B. Montluçon, F. G. Prahl, and J. I. Hedges. 1994. “Sorptive Preservation of Labile Organic Matter in Marine Sediments.” Nature 37 (6490): 549–552.
- Liu, X. Y., J. H. Gao, F. L. Bai, Z. Y. Liu, and S. M. Pan. 2008. “Grain Size Information in Different Evolution Periods of Xinyanggang Tidal Flat in Jiangsu Province.” Marine Geology & Quaternary Geology 28(4): 27–35. In Chinese.
- Macreadie, P. I., A. R. Hughes, and D. L. Kimbro. 2013. “Loss of ‘blue Carbon’ from Coastal Salt Marshes following Habitat Disturbance.” Plos One 8 (7): 1–8.
- Macreadie, P. I., Q. R. Ollivier, J. J. Kelleway, O. Serrano, P. E. Carnell, C. J. Ewers Lewis, T. B. Atwood, et al. 2017. “Carbon Sequestration by Australian Tidal Marshes.” Scientific Reports 7: 44071.
- Mao, Z. G., X. H. Gu, J. E. Liu, L. J. Ren, and G. X. Wang. 2010. “Evolvement of Soilquality in Saltmarshes and Reclaimed Farmlands in Yancheng Coastal Wetland.” Chinese Journal of Applied Ecology 21(8): 1986–1992. In Chinese.
- Mayer, L. M. 1994. “Surface Area Control of Organic Carbon Accumulation in Continental Shelf Sediments.” Geochimica Et Cosmochimica Acta 58 (4): 1271–1284.
- Mcleod, E., G. L. Chmura, S. Bouillon, R. Salm, M. Björk, C. M. Duarte, C. E. Lovelock, W. H. Schlesinger, and B. R. Silliman. 2011. “A Blueprint for Blue Carbon: Toward an Improved Understanding of the Role of Vegetated Coastal Habitats in Sequestering CO2.” Frontiers in Ecology and the Environment 9 (10): 552–560.
- Meng, W. Q., R. A. Feagin, B. B. Hu, M. X. He, and H. Y. Li. 2019. “The Spatial Distribution of Blue Carbon in the Coastal Wetlands of China.” Estuarine, Coastal and Shelf Science 222: 13–20.
- Pendleton, L., D. C. Donato, B. C. Murray, S. Crooks, W. A. Jenkins, S. Sifleet, C. Craft, et al. 2012. “Estimating Global “blue Carbon” Emissions from Conversion and Degradation of Vegetated Coastal Ecosystems.” Plos One 7 (9): e43542–e43542.
- Rogers, K., P. I. Boon, S. Branigan, N. C. Duke, C. D. Field, J. A. Fitzsimons, H. Kirkman, J. R. Mackenzie, and N. Saintilan. 2016. “The State of Legislation and Policy Protecting Australia\”s Mangrove and Salt Marsh and Their Ecosystem Services.” Marine Policy 72: 139–155.
- Rozaimi, M., P. S. Lavery, O. Serrano, and D. Kyrwood. 2016. “Long-term Carbon Storage and Its Recent Loss in an Estuarine Posidonia Australis Meadow (albany, Western Australia).” Estuarine, Coastal and Shelf Science 171: 58–65.
- Ruiz-Fernández, A. C., V. Carnero-Bravo, J. A. Sanchez-Cabeza, L. H. Pérez-Bernal, O. A. Amaya-Monterrosa, and S. Bojórquez-Sánchez. 2018. “Carbon Burial and Storage in Tropical Salt Marshes under the Influence of Sea Level Rise.” Science of the Total Environment 630: 1628–1640.
- Sanders, C. J., J. M. Smoak, A. S. Naidu, L. M. Sanders, and S. R. Patchineelam. 2010. “Organic Carbon Burial in a Mangrove Forest, Margin and Intertidal Mud Flat.” Estuarine, Coastal and Shelf Science 90: 168–172.
- Shi, Q. W., H. Ren, W. G. Cai, and J. X. Gao. 2019. “How to Set the Proper Level of Carbon Tax in the Context of Chinese Construction Sector: A CGE Analysis.” Journal of Cleaner Production 240: 117955. Accessed 22 August 2019.
- Sifleet, S., L. Pendleton, and B. C. Murray. 2011. State of the Science on Coastal Blue Carbon: A Summary for Policy Makers. Durham, NC: Nicholas Institute for Environmental Policy Solutions, Duke University.
- Smoak, J. M., J. L. Breithaupt, T. J. Smith, and C. J. Sanders. 2013. “Sediment Accretion and Organic Carbon Burial Relative to Sea-level Rise and Storm Events in Two Mangrove Forests in Everglades National Park.” CATENA 104: 58–66.
- Theuerkauf, E. J., J. D. Stephens, J. T. Ridge, F. J. Fodrie, and A. B. Rodriguez. 2015. “Carbon Export from Fringing Saltmarsh Shoreline Erosion Overwhelms Carbon Storage across a Critical Width Threshold.” Estuarine, Coastal and Shelf Science 164: 367–378.
- Thorhaug, A. L., H. M. Poulos, J. López-Portillo, J. Barr, A. L. Lara-Domínguez, T. C. Ku, and G. P. Berlyn. 2019. “Gulf of Mexico Estuarine Blue Carbon Stock, Extent and Flux: Mangroves, Marshes, and Seagrasses: A North American Hotspot.” Science of the Total Environment 653: 1253–1261.
- Ullman, R., V. Bilbao-Bastida, and G. Grimsditch. 2013. “Including Blue Carbon in Climate Market Mechanisms.” Ocean & Coastal Management 83: 15–18.
- Wang, A. J., S. Gao, J. J. Jia, and S. M. Pan. 2005. “Contemporary Sedimentation Rate on Salt Marshes at Wanggang, Jiangsu, China.” Acta Geographical Science 60(1): 61–70. In Chinese.
- White, E., and D. Kaplan. 2017. “Restore or Retreat? Saltwater Intrusion and Water Management in Coastal Wetlands.” Ecosystem Health and Sustainability 3 (1): e01258. doi:10.1002/ehs2.1258.
- WB (World Bank Group). 2019. State and Trends of Carbon Pricing 2019. Washington, DC: World Bank. License: CC BY 3.0 IGO https://openknowledge.worldbank.org/handle/10986/31755
- Xu, Z., P. Zuo, J. J. Wang, and J. J. Du. 2014. “Effects of Land Use Changes on the Organic Carbon Storage of the Soil in Yancheng Coastal Wetlands.” Marine Science Bulletin 33(4): 444–450. In Chinese.
- Zhou, C. H., Q. Y. Mao, X. Xu, C. M. Fang, Y. M. Luo, and B. Li. 2016. “Preliminary Analysis of C Sequestration Potential of Blue Carbon Ecosystems on Chinese Coastal Zone.” Scientia Sinica (Vitae) 46: 475–486. In Chinese.