
 ?Mathematical formulae have been encoded as MathML and are displayed in this HTML version using MathJax in order to improve their display. Uncheck the box to turn MathJax off. This feature requires Javascript. Click on a formula to zoom.
ABSTRACT
Introduction: Wetland soil fauna support material cycling and restoration processes in wetland ecosystems. In our study, we observed variations in wetland soil fauna on the shores of Lake Taihu, China. We examined the relationships between fauna and major environmental factors, and looked at the short-and long-term changes in reed wetlands under restoration and in the natural reed lakeshore.
Outcomes: We identified 93 groups of soil fauna in different wetlands and found significant differences in the lakeshore wetlands’ soil fauna assemblages, depending on the length of the restoration period. By analyzing the soil fauna community evenness, dominance, number of taxa, and diversity, we found minimal seasonal variation in the soil fauna community diversity and abundance. The abundance of soil fauna in the sites under restoration decreased with depth below the soil surface. The reed restoration was obvious in the succession of the soil fauna groups in the long-term site. Although the restoration had an overall positive long-term effect on the soil fauna communities, there were no obvious short-term changes in the number of individuals.
Conclusion: The study explored various potential measures to restore soil fauna in the Lake Taihu wetland and developed a theoretical basis for restoring the lakeshore wetland ecosystem.
Introduction
Wetlands play an indispensable role in preventing floods, balancing hydrological and climatic cycles, protecting biological diversity, controlling pollution, minimizing the impacts of drought, and conserving water resources. As one of the most biologically productive ecosystems on the planet, they are a haven for rare waterfowl and have been referred to as “the cradle of life” and “the kidney of the Earth” (Cui and Asselin Citation2006; Broeck et al. Citation2015). However, as elsewhere, China’s wetlands have been experiencing unprecedented degradation and have been decreasing in extent since the beginning of the twentieth century. Because of a general lack of understanding about the overall value of wetland ecosystems, these areas are threatened by the ongoing industrialization and urbanization that have resulted from the country’s booming economy and very dense urban populations (Yin Citation2003). Lakeshore restoration, a type of wetland restoration, is used to maintain the stability and ecological characteristics of lakeshore zones (National Research Council Citation2002; Haskell et al. Citation2018). When implemented appropriately, restoration projects can effectively slow down the wetland degradation process and improve the structure and functions of degraded wetland ecosystems. Wetland restoration should be monitored and managed to ensure that recovery project measures are adequately and appropriately implemented. Monitoring is very important when restoring and managing wetland, and objectively evaluating wetland restoration (Cui et al. Citation2011; Pan et al. Citation2013; Hazelton et al. Citation2019).
Recently, changes in soil fauna communities and diversity have been the focus of many studies as both of these are useful for studying degraded ecosystems. Researchers have previously used the number and population densities of soil fauna as indicators of soil health (Longcore Citation2003; Caruso, Taormina, and Migliorini Citation2012; Khemaissia et al. Citation2018; Ma, Yin, and Wang Citation2019). The effects of wetland restoration on soil fauna are mainly reflected in the succession of soil fauna groups and the respective abundances of those groups (Liu et al. Citation2014; Cui et al. Citation2016). When a wetland is degraded, the complexity of the soil fauna species composition and the numbers of individual fauna decrease, which then impacts on the ability of wetland soils to carry out ecosystem services. However, in the early stages of wetland recovery, there are few obvious changes in the composition of wetland soil fauna communities (Mitsch and Wang Citation2000; Cui et al. Citation2011; Antón-Pardo and Armengol Citation2016). Further, the functions of many of the different soil fauna within wetland ecosystems (e.g., decomposition of soil organic matter, nutrient cycling, improvements to the soil structure, and effects on soil health and plant succession) are interconnected (Burger et al. Citation2003; Ma, Yin, and Wang Citation2019), and so soil fauna can serve as ecological indicators in areas of wetland that are under restoration. Soil fauna are important for understanding ecosystem status, and the effects of, and patterns associated with, wetland restoration. Monitoring of soil fauna can support the development of tools for wetland monitoring, evaluation, and management (Volkmar Citation2001; Anke and Rosenzweig Citation2003; Andrésa and Mateos Citation2006; Yin et al. Citation2008; Jiao et al. Citation2019). In recent years, studies of soil fauna have gradually shifted to functional research, while studies of degraded wetland restoration have started to examine how the wetland soil fauna change over the restoration period in greater detail (Hunt and Wall Citation2002; Zedler Citation2011). Indeed, soil fauna are used in studies of wetland restoration as biological indicators of successful restoration (Hartmut Citation1998; Neher Citation2001; Bissett et al. Citation2016).
In this study, we conducted a large-scale field investigation between April 2010 and February 2011 and then analyzed the soil fauna to gain improved insights into the species composition, abundance, and distribution of soil fauna in wetland ecosystems around Lake Taihu. We chose three study sites in reed-dominated wetlands along the banks of Lake Taihu, including a long-term reed restoration lakeshore, a short-term reed restoration lakeshore, and a natural reed lakeshore. The three sites had similar soil conditions and histories. The objectives of this study were to evaluate the composition of, and differences between, the soil fauna communities in wetlands at different stages of restoration; to determine the abundance and diversity of soil fauna at different stages of reed wetland restoration, and to gain insights into how the soil fauna changed at different stages in the restoration process.
Materials and methods
Study area
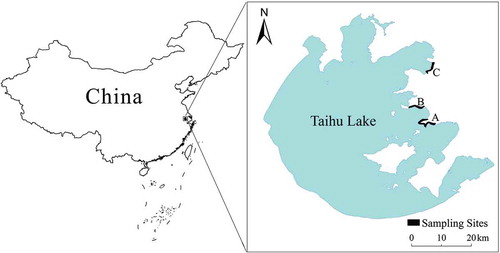
Lake Taihu is located in the south of the Yangtze River Delta, China. It is the third-largest freshwater lake in China, and has an area of more than 2400 km2. The mean annual temperature in this area is approximately 17°C and the mean annual rainfall is approximately 1096.7 mm (Jin, Liu, and Yi Citation1995; Hu et al. Citation2011). The study area was mainly along the east coast of Lake Taihu, where the average altitude was approximately 4 m. The vegetation species in the wetland areas under restoration and the natural sites were dominated by Phragmites australis and Alternanthera philoxeroides. Reeds were the target vegetation of the wetland restoration, so the recovery of the lakeshore was assessed by the extent of the natural restoration of the reeds. In this study, the lakeshore area that had been recovering for more than five years was referred to as long-term reed restoration lakeshore site (LR) (site A), while the area that had been recovering for only two years was referred as short-term reed restoration lakeshore site (SR) (site B). An area of natural wetland with reeds on the lakeshore (NR) was also chosen (site C). The sampling sites are shown in .
Figure 1. Study sites of Lake Taihu
Soil fauna sampling
We selected the sampling sites after examining high-definition remote sensing images and topographic maps (Hestir et al. Citation2015), and carrying out initial field surveys. Samples were collected from plant communities that represented the different habitats at three sites, along lengths of 3 km, in the lakeshore wetland area on the eastern side of Lake Taihu. We randomly selected 5 samples at each site on 4 sampling occasions, namely April, August, and November of 2010, and in February 2011. The soil samples were divided into 3 layers, from 0–5 cm, 5–10 cm, and 10–15 cm (Orozco, Lee, and Stock Citation2014). The volume and diameter of the cylindrical soil samples were 115 ml and 5.4 cm, respectively. We also took samples with a volume of 20 × 20 × 5 cm, corresponding to the 3 soil layers. Thus, we collected 5 large samples, each of which was divided into 3 layers, in 3 different sites, on 4 sampling events, making a total of 180 samples.
Soil fauna identification
The large samples were collected manually, preserved in a 75% alcohol solution, and then transported to the laboratory for initial identification (Handbook of Soil Animal Research Methods Citation1998; Yin Citation2000). We identified and counted the isolated soil fauna under an Olympus SZX16 stereo microscope (Olympus, Tokyo, Japan). We used Tullgren and Baermann funnels to separate the soil fauna by size (Lakly and Crossley Citation2000; Rodgers et al. Citation2018) over periods of 24 h and 48 h, respectively. Most of the small arthropods can be collected with the Tullgren funnel (primarily medium-sized soil fauna), and the aquatic or wet soil fauna can be separated with the Baermann funnel. The soil fauna were separated following the procedures outlined in the Soil Animal Retrieval Guide of China (Yin Citation1998) under a Leica DM4000B light microscope (Leica, Wetzlar, Germany) and Olympus SZX16 stereo microscope (Olympus, Tokyo, Japan) and then were classified and counted.
Soil sampling
Soil samples that corresponded to the soil fauna sampling sites were collected using the ring knife method, placed in a collection bag, and taken to the laboratory for analysis, in line with conventional methods (Yin Citation2000). Samples were analyzed for seven indicators, namely soil pH, soil organic matter (SOM), total phosphorus (TP), total nitrogen (TN), moisture content (MC), soil temperature, and electrical conductivity (Cond) (Warren and Zou Citation2002; Murray et al. Citation2006; Liu, Zhao, and Zhao Citation2012). We measured the MC and temperature in the field using a Procheck soil moisture sensor (Decagon, USA).
Statistical analyses
We used the Simpson Diversity, Shannon–Wiener Diversity, and Pielou Evenness (Ma Citation1994) indices to evaluate the different vegetation cover types and characteristics of the changes in the species composition of the soil fauna communities. The Simpson Diversity Index, Shannon–Wiener Diversity Index, and Pielou Evenness Diversity Index were calculated with EquationEquations (1(1)
(1) )–(Equation3
(3)
(3) ), respectively.
where N represents the total number of all types of individual species, Ni represents the number of individuals of a species i, Pi represents the ith species in the proportion of the total number of species, and S represents the number of species. To determine the abundance, we used the Morisita–Horn Index (EquationEquationEquation (4)(4)
(4) )
(4)
(4) :
where S is the number of all the groups; aN is the total number of individuals of all groups for type A, bN is the total number of individuals of all groups for type B; ani is the number of groups in the ith number of individuals for type A, and bni is the number of groups in the ith number of individuals for type B.
The average density of soil fauna was determined by the number of individual soil fauna per square meter (number/m2). Before analysis, the soil fauna data were logarithmically transformed. For normally distributed soil fauna data we analyzed the individual numbers of different types of soil fauna by single-factor analysis of variance (one-way ANOVA). We used Duncan’s multiple range test to determine whether any differences were significant. We used the Kruskal–Wallis (H) nonparametric test to analyze soil fauna data that were not normally distributed.
Canonical correspondence analysis (CCA) was used to sort the data and analyze the relationships between the soil fauna and the soil physical and chemical properties (Guisan, Weiss, and Weiss Citation1999; Zhang Citation2004; Liu, Gao, and Wu Citation2017). The soil fauna from the three study sites and ten soil environmental properties monitored in four sampling events were sequenced using the CCA. The correlations between the distributions of ten soil characteristics (soil pH, SOM, TN, TP, AP, ammonium (NH4-N), potassium (K+), soil MC, soil temperature and Cond) and the corresponding distributions of the soil fauna communities were also determined with CCA (Bruelheide et al. Citation2002; Zhang and Chu Citation2013). Groups that have less than 1% of the total number of individuals were excluded from the analysis. The soil fauna community data were transformed logarithmically to decrease the weight of the dominant soil fauna communities.
Results
Different densities of soil fauna community species composition during reed recovery
During the sampling events (April, August, and November 2010, and February 2011), 93 groups of soil fauna were identified. At the long-term reed restoration lakeshore, short-term reed restoration lakeshore, and natural reed lakeshore 71, 51, and 63 soil fauna groups were identified, respectively (). The dominant groups at the long-term reed restoration lakeshore were Enchytraeidae, Diplopoda, and Nematoda were dominant groups, accounting for 22.44%, 21.01%, and 19.35% of the total number of individuals, respectively. Nematoda, accounting for 23.02%, dominated at the short-term reed restoration lakeshore, followed by Acari with 7.22% of the total number of individuals. Nematoda dominated, and accounted for 33.83% of the total number of individuals, at the natural reed lakeshore.
Table 1. Species richness and abundance of soil fauna at different stages of wetland restoration
The percentage of each group corresponds to the proportion of individuals in the group out of the total number of individuals in all groups.
Soil fauna density over time at different stages of reed restoration
The soil fauna density was higher (but not significantly) in April 2010 than in the three other months (P> 0.05) (), which indicates that the soil fauna in the reed wetland areas were not particularly sensitive to seasonal changes. There were no significant differences between the long-term reed restoration lakeshore, short-term reed restoration lakeshore, and natural reed lakeshore in the same month (P> 0.05). Overall, the soil fauna density was lowest at the short-term reed restoration lakeshore and highest at the long-term reed restoration lakeshore.
Figure 2. Densities of soil fauna in the three different wetland areas. The bars represent the mean values and the error bars represent the standard error
Community diversity of soil fauna in reed restoration wetlands
Analysis of the soil fauna diversity reflects both the complexity of the soil fauna species distribution and the stability of habitats, and the similarities and differences between different habitats (Bradford et al. Citation2002; Goncalyes and Pereira Citation2012). The results from dominance variance analysis showed that there was no significant difference (P > 0.05) () in the diversity of the samples in November 2010 and February 2011. Furthermore, the results from analysis of variance among the different community types showed that there was no significant difference between the three habitat types during the four survey periods (P > 0.05). Evenness is a measure of the relative abundance of different species in a community (Rudolf et al. Citation2016). The uniformity is at a maximum when all the species in a community have an equal number of individuals (Brady et al. Citation2002) and is at a minimum when all the individuals belong to a single species.
Analysis of the uniformity within the same month showed that the soil fauna composition differed significantly (H = 15.052, P < 0.05) in soil fauna composition between the long-term reed restoration lakeshore and the natural reed lakeshore in August 2010. However, there were no other significant differences between habitat types during other periods (P > 0.05); and analysis of variance of soil fauna diversity showed that there was no significant difference (P > 0.05) between the various wetland areas. There were no significant differences in the other factors studied, including the dominance, group number, and diversity indices. There were also no significant differences over the four study periods, indicating that the soil fauna diversity varied little by season, though the diversity varied between the different areas. In addition, the diversity of the soil fauna communities at the three study sites was not significantly different.
Figure 3. Diversity of the soil fauna communities in the three different wetland areas. The bars represent the mean values and the error bars represent the standard error
Vertical distribution of soil fauna at different stages of wetland restoration
The vertical distribution of the soil fauna in the soil profile is shown in . There were some differences in the individual density and group number along the soil profile between the four sampling periods. For example, the individual density in the surface soil at the natural site (0–5 cm) was significantly different from that at depths of 5–10 and 10–15 cm (F = 17.120, P < 0.001) in April, but the difference between 5–10 and 10–15 cm was not significantly different (P > 0.05). In August 2010, the individual density of the soil fauna in the surface soil layer was significantly different from that in the deeper (second or third) layers (F = 6.269, P < 0.05) at the short-term site, but the soil fauna individual densities at the three depths at the long-term reed restoration lakeshore and the natural reed lakeshore were not significantly different (P > 0.05). In November 2010, the individual density of soil fauna was significantly higher in the surface soil (first layer) than in the third or deepest layer at the long-term restoration lakeshore (F = 3.079, P < 0.05); similarly, soil fauna density was significantly higher in the surface soil (first layer) than in the second layer at the short-term reed restoration lakeshore (F = 3.347, P < 0.05). However, there were no significant differences between the three layers at the natural reed lakeshore (P > 0.05). In February 2011, there were no differences between the three soil layers at the different lakeshore (P > 0.05).
At the long-term reed restoration lakeshore, the number of soil fauna groups was significantly higher in the surface layer than in the second and third layers (F = 3.181, P = 0.05) in April 2010. Also, at this lakeshore the number of groups was significantly higher in the surface layer than in the third layer (F = 5.926, P< 0.01) in August, while the number of groups in the surface layer was significantly higher than in the second and third layers (F = 8.312, P < 0.01) in November. There were no significant differences in the number of groups among soil layers at the long-term reed restoration lakeshore in February 2010.
At the short-term reed restoration lakeshore, the number of groups in the surface layer was significantly different from the numbers in second and third layers (F = 6.962, P < 0.01) in August 2010, but there were no significant differences between the layers in the other months. At the natural reed lakeshore, the number of groups in the surface layer was significantly different from the numbers in the second or third layers (F = 4.303, P < 0.05) in April 2010, while in August 2010 the number of groups was significantly higher in the surface layer than in the third layer (F = 3.794, P < 0.05). Still, at the natural lakeshore the numbers of groups in the surface and third layers were significantly different (F = 3.316, P < 0.05) in November 2010, the numbers of groups in the different soil layers were not significantly different in February 2011.
Figure 4. Diversity of the soil fauna communities at different stages of restoration. The bars in figures represent the mean values and the error bars represent the standard error
Relationships between the fauna at the different reed restoration lakeshore and soil environmental factors
Analysis of the soil and environmental factor axes for April 2010 showed that the first axis reflected mainly K+ and Cond; and the second ordination axis reflected the temperature (), while, in August 2010, the first ordination axis reflected the soil MC and Cond, and the second ordination axis reflected TP and Cond. The first ordination axis reflected soil MC and the second axis reflected AP in November 2010, while the first ordination axis reflected TP, K+, and Cond, and the second axis reflected the AP in February 2010.
Table 2. Correlation of environmental variables with the ordination axes
reflects the overall nature of the relationship between the soil properties at the different sites and the composition of the soil fauna communities for the four sampling events. In April 2010, there was a long arrow connecting the first ordination axis and soil K+ and Cond, indicating a significant correlation between the first ordination axis and soil properties K+ and Cond. The arrow between the second ordination axis and temperature was also long, again indicating a significant correlation between the second axis and temperature. The relationship between the environment variables and the ordination axes is shown in . As shown in , Bourletiella (Collembola), Symphyla and Armadillidae (Isopod) were mainly influenced by K+, while Staphylinidae (Coleoptera) larvae were mainly affected by temperature. Soil environmental factors had a minimal influence on Muscidae (Diptera), Chironomid, Psychodidae, and Scydmaenidae (Coleoptera) larvae.
Table 3. Canonical correlation analysis results
In August 2010, there was a long arrow connecting the first ordination axis and soil MC and Cond, indicating a significant correlation between the first ordination axis and MC and Cond. The arrow between the second ordination axis and TP and Cond was also long, indicating a significant correlation between the second ordination axis and TP and Cond. Here, we see that MC had a considerable effect on Muscidae larvae (Diptera), while soil conductivity had a considerable effect on Phlaeothripidae (Thysanoptera). Lygaeidae (Hemiptera) was strongly influenced TP, while soil environmental factors had a minimal effect on Chilopoda Geophilomorpha and Hemiptera Lygaeidae.
In November 2010, there was a long arrow between the first ordination axis and soil MC, indicating a significant correlation between the first ordination axis and soil MC. The arrow between the second ordination axis and AP was also long, indicating a significant correlation between the second ordination axis and AP. Here, we see that AP had a considerable effect on Psocoptera, and MC had a considerable effect on Symphyla. Soil environmental factors had little effect on Araneae, Gnaphosidae, and Coleoptera Pselaphidae.
In February 2011, there was a long arrow between the first ordination axis and soil TP, K+, and Cond, indicating a significant correlation between the first axis and soil TP, K+, and Cond. The arrow between the second ordination axis and AP was also long, indicating a significant correlation between the second axis and AP. Here, we see that TP had a strong effect on Chilopoda Geophilomorpha, while soil environmental factors had little effect on Isopoda, Collembola Neanuridae, and Coleoptera Staphylinidae.
Figure 5. Canonical correspondence analysis ordination diagrams of soil fauna groups and environmental variables
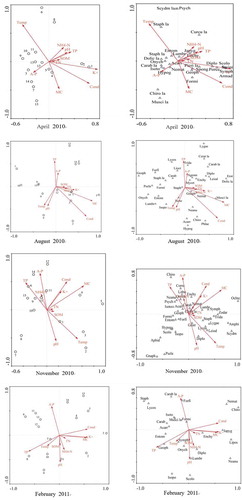
Abbreviations: Erotylidae: Eroty; Acari: Acarr; Agromyjidae: Agrom; Amphipoda: Amphi; Aphididae: Aphid; Armadilidae: Armad; Carabidae: Carab; Carabidae larva: Carab lar; Ceratopogonidae larva: Cerat lar; Chironomidae: Chiro; Chironomidae larva: Chiro lar; Corrodentia: Corro; Curculionidae larva: Curcu lar; Diplopoda: Diplo; Dolichopodidae larva: Dolic lar; Enchytraeidae: Enchy; Entomobryidae: Entom; Forficulidae: Forfi; Formicidae: Formi; Gastropoda: Gastr; Geophilomorpha: Geoph; Gnaphosidae: Gnaph; Hypogastruridae: Hypog; Isopoda: Isopo; Isotomidae: Isoto; Japygidae: Japyg; Leiodidae: Leiod; Liocranidae: Liocr; Liposcelididae: Lipos; Lithobiomorpha: Litho; Lumbricida: Lumbr; Lycosidae: Lycos; Lygaeidae: Lygae; Muscidae larva: Musci lar; Mycetophilidae: Mycet; Neanuridae: Neanu; Nematoda: Nemat; Ochteridae: Ochte; Onychiuridae: Onych; Phlaeothripidae: Phlae; Pieridae larva: Pieri lar; Porcellionidae: Porce; Pselaphidae: Psela; Psychodidae: Psych; Scolopendromorpha: Scolo; Scydmaenidae: Scydm; Scydmaenidae larva: Scydm lar; Sminthuridae: Smint; Spongiphoridae: Spong; Staphylinidae: Staph; Staphylinidae larva: Staph lar; Symphyla: Symph; Tridactylidae: Trida; Zodaroidea: Zodar
Discussion
The results show that there was a high heterogeneity of species in the soil fauna communities in the wetland areas that were subject to reed restoration over different time periods. While there were few individuals in the rare and extremely rare taxa groups, some of them were physically large, and included earthworms, Diptera larvae, Coleoptera larvae, Cephalopods, and Chilopods (). These soil fauna are the main shredders of plant debris (Han et al. Citation2007; Fujii et al. Citation2016) and play an important role in material cycling (Ge et al. Citation2005; Ramírez-Fernández et al. Citation2019).
The results of our analyses of soil fauna community evenness, dominance, number of groups, and diversity indices showed that there were no significant seasonal differences in the soil fauna communities. Also, the soil fauna density was not sensitive to seasonal variations. While the uniformity (evenness) in the long-term reed restoration lakeshore and natural reed lakeshore differed significantly in August 2010, the soil fauna community diversity in the three habitats was not significantly different over the other sampling periods, which indicates that the soil fauna community diversity varied little by season (). However, the similarity did not differ significantly between the sampling events, indicating that there was little seasonal variation in the relative number of soil fauna communities, as reported by other authors (Wu et al. Citation2008; Wu and Wang Citation2019).
Generally, the number and types of soil fauna tend to decrease as the soil depth increased but the patterns in the numbers of individual fauna and groups and their relative abundances tend to differ between months (Liu et al. Citation2016). The number and types of soil fauna tended to aggregate at the surface and the vast majority of species and individuals were concentrated between 0 and 5 cm, perhaps because plant roots are mainly concentrated in the surface soils in a wetland and the ventilation is good in this layer. Other studies suggested that wetland plant roots were mainly distributed in the 0–10 cm soil layer (Russell Citation1977; Amiaud and Touzard Citation2004), so the living environment in this layer may be suitable for soil fauna. Indeed, deeper soils have limited permeability and are vulnerable to the effects of cyclical flooding (Baldwin, Egnotovich, and Clarke Citation2001; Capon and Brock Citation2006; Liu et al. Citation2015). In this study, while the soil fauna community diversity and density generally showed a gradual decrease with soil depth, the opposite occurred in some individual plots. Overall, however, there was clear variation in the vertical distribution of soil fauna, with obvious surface aggregation.
In this study, the density of the soil fauna community peaked in April 2010 at the long-term reed restoration lakeshore and natural reed lakeshore, and in November 2011 at the short-term reed restoration lakeshore. With the exception of the samples collected in February 2011, the soil fauna density was generally highest at the long-term reed restoration lakeshore, followed by the natural reed lakeshore, and was lowest at the short-term reed restoration lakeshore (). The soil fauna density was higher at the long-term reed restoration lakeshore than at the short-term reed restoration lakeshore and natural reed lakeshore, regardless of the number of species or the number of individuals, perhaps reflecting the high vegetation coverage, relatively complex soil structure, and surface sediment layer at the long-term site. Vegetation litter is an important source of SOM that contributes to water conservation and helps stabilize the soil temperature stabilization. The soil fauna in this habitat type benefit from rich sources of food and a stable living environment (Yin et al. Citation2010; Korbel, Stephenson, and Hose Citation2019).
The ecosystem of the short-term reed restoration has a relatively simple structure, and the soil fauna living environment fluctuates greatly (Abdallah et al. Citation2018). Reproduction of soil fauna may be restricted at this site by the low quality and quantity of vegetation litter, and the periodic flooding (Ho et al. Citation2019). These conditions may also affect the amount and distribution of soil fauna, leading to low density and biological diversity of soil fauna (Fitoussi, Pen-Mouratov, and Steinberger Citation2016).
The number of species in natural reed wetlands, an important wetland ecosystem, is relatively low but generally very stable, because of the cyclical flooding (Davis, Austin, and Buhl Citation2006; Taihu River Basin Authority Citation2010). We found that the number of fauna in the natural reed lakeshore was less than that in the short-term reed restoration lakeshore in February 2011, perhaps because the reed wetlands were burnt during winter. The high temperature during the burning period may have caused the death of some soil fauna, and a corresponding decrease in the local density of soil fauna (Bengtsson Citation2002; Wardle et al. Citation2004; Franco et al. Citation2016).
Conclusion
We discovered a total of 93 groups of soil fauna in the reed-dominated wetlands along the shores of Lake Taihu. Specifically, we found 71, 51, and 63 groups at the long-term reed restoration lakeshore, short-term reed restoration lakeshore, and natural reed lakeshore, respectively. Enchytraeidae, Diplopoda, and Nematoda dominated the soil fauna at the long-term reed restoration lakeshore while Nematoda dominated at the short-term reed restoration lakeshore and natural reed lakeshore. In individual months, the soil fauna community densities in the long-term reed restoration lakeshore, short-term reed restoration lakeshore and natural reed lakeshore were not significantly different. The soil fauna density was lowest at the short-term reed restoration lakeshore, and highest at the long-term reed restoration lakeshore. The evenness was significantly different between the sites in August 2010, when it was higher at the long-term reed restoration lakeshore (H = 15.052, P < 0.05). There was no significant difference between the evenness at the different sites at the other sampling times. The other factor indicators (dominance, group number, and diversity indices) were not significantly different over the different sampling times, and there was little seasonal variation in the diversity of the soil fauna communities. The impact of the different indicators varied between the different restoration stages. The soil fauna tended to be aggregated in the surface soil and decreased with depth. The wetland restoration mainly affected the succession of the soil fauna groups over the long term, but had little effect over the short term. The density of soil fauna communities was generally highest in the long-term reed restoration site, followed by the natural area, and was lowest in the short-term reed restoration site.
The changes in wetland soil fauna over a period of restoration can reflect how ecological functions are restored and can give useful insights into how soil fauna respond to wetland restoration. Soil fauna are therefore a useful indicator of wetland degradation and recovery. An indispensable component of wetland ecosystems, soil fauna have a role as consumers and disintegrators. When the numbers of beneficial soil fauna increase during wetland restoration, the reconstruction of ecological system function will improve and the process of wetland restoration will be more rapid. The relationships between wetland ecosystems, wetland restoration, and soil fauna need to be further studied, for example, through examining the ecological functions of key groups of soil fauna in wetland ecosystems, the functional mechanisms of soil fauna biodiversity, and the internal ecological processes of soil fauna and their ecological functions. Monitoring of wetland fauna over time can give insights into the processes and effects of biological habitat restoration, which can contribute to the development of robust management and recovery measures, and sound decision-making. Monitoring data can be stored in a database and can be used to support scientific and objective evaluations of wetland habitat restoration and reconstruction.
Acknowledgments
The authors thank Amjad Ali and Abel Ramoelo for valuable comments on the draft manuscript and John Wasige from the University of Twente, The Netherlands, for writing assistance.
Disclosure statement
No potential conflict of interest was reported by the authors.
Additional information
Funding
References
- Abdallah, M. A. B., R. Mata-González, D. W. Martin, J. S. Noller, and C. Wan. 2018. “Consequences of Surface and Subsurface Water Use on Wetland Graminoids of Different Geographic Origin.” Wetlands 38: 121–15. doi:10.1007/s13157-017-0961-x.
- Amiaud, B., and B. Touzard. 2004. “The Relationships between Soil Seed Bank, Aboveground Vegetation and Disturbances in Old Embanked Marshlands of Western France.” Flora 199 (1): 25–35. doi:10.1078/0367-2530-00129.
- Andrésa, P., and E. Mateos. 2006. “Soil Mesofaunal Response to Post-mining Restoration Treatments.” Applied Soil Ecology 33 (1): 67–78. doi:10.1016/j.apsoil.2005.08.007.
- Anke, H., and S. Rosenzweig. 2003. “Multivariate Statistics as a Tool for Model-based Prediction of Floodplain Vegetation and Fauna.” Ecological Modelling 169 (1): 73–87. doi:10.1016/S0304-3800(03)00263-1.
- Antón-Pardo, M., and X. Armengol. 2016. “Influence of Biotic Variables on Invertebrate Size Structure and Diversity in Coastal Wetlands of Southeastern Spain.” Estuarine, Coastal and Shelf Science 180: 41–50. doi:10.1016/j.ecss.2016.06.020.
- Baldwin, A. H., M. S. Egnotovich, and E. Clarke. 2001. “Hydrologic Change and Vegetation of Tidal Freshwater Marshes: Field, Greenhouse, and Seed Bank Experiments.” Wetlands 21 (4): 519–531. doi:10.1672/0277-5212(2001)021[0519:HCAVOT]2.0.CO;2.
- Bengtsson, J. 2002. “Disturbance and Resilience in Soil Animal Communities.” European Journal of Soil Biology 38 (2): 119–125. doi:10.1016/S1164-5563(02)01133-0.
- Bissett, A., A. Fitzgerald, T. Meintjes, P. M. Mele, F. Reith, P. G. Dennis, M. F. Breed, et al. 2016. “Introducing BASE: The Biomes of Australian Soil Environments Soil Microbial Diversity Database.” Gigascience 5 (1): 1–11. doi:10.1186/s13742-016-0126-5.
- Bradford, M. A., G. M. Tordoff, T. Eggers, T. H. Jones, and J. E. Newington. 2002. “Microbiota, Fauna, and Mesh Size Interactions in Litter Decomposition.” Oikos 99 (2): 317–323. doi:10.1034/j.1600-0706.2002.990212.x.
- Brady, V. J., B. J. Cardinale, J. P. Gathman, and T. M. Burton. 2002. “Does Facilitation of Faunal Recruitment Benefit Ecosystem Restoration? An Experimental Study of Invertebrate Assemblages in Wetland Mesocosms.” Restoration Ecology 10 (4): 617–626. doi:10.1046/j.1526-100X.2002.01042.x.
- Broeck, M. V. D., A. Waterkeyn, L. Rhazi, P. Grillas, and L. Brendonck. 2015. “Assessing the Ecological Integrity of Endorheic Wetlands, with Focus on Mediterranean Temporary Ponds.” Ecological Indicators 54: 1–11. doi:10.1016/j.ecolind.2015.02.016.
- Bruelheide, H., P. Udelhoven, L. Hemerik, and L. Brussaard. 2002. “Diversity of Soil Macro-invertebrates in Grasslands under Restoration Succession.” European Journal of Soil Biology 38 (2): 145–150. doi:10.1016/S1164-5563(02)01136-6.
- Burger, J. C., R. A. Redak, E. B. Allen, J. T. Rotenberry, and M. F. Allen. 2003. “Restoring Arthropod Communities in Coastal Sage Scrub.” Conservation Biology 17 (2): 460–467. doi:10.1046/j.1523-1739.2003.01325.x.
- Capon, S. J., and M. A. Brock. 2006. “Flooding, Soil Seed Bank Dynamics and Vegetation Resilience of a Hydrological Variable Desert Floodplain.” Freshwater Biology 51 (2): 206–223. doi:10.1111/fwb.2006.51.issue-2.
- Caruso, T., M. Taormina, and M. Migliorini. 2012. “Relative Role of Deterministic and Stochastic Determinants of Soil Animal Community: A Spatially Explicit Analysis of Oribatid Mites.” The Journal of Animal Ecology 81 (1): 214–221. doi:10.1111/j.1365-2656.2011.01886.x.
- Compile Group of Handbook of Soil Animal Research Methods. 1998. Handbook of Soil Animal Research Methods. Beijing: China Forestry Publishing House.
- Cui, L. J., and S. Asselin. 2006. The Wetland Restoration Handbook Guiding Principles and Case Studies. Beijing: China Architecture and Building Press.
- Cui, L. J., W. Li, X. S. Zhao, M. Y. Zhang, Y. F. Wang, Y. Zhang, and S. N. Li. 2011. “Research on Slope Wetland Restoration Technology.” World Forestry Research 24 (3): 16–21.
- Cui, L. J., W. Li, X. S. Zhao, M. Y. Zhang, Y. R. Lei, Y. Zhang, C. J. Gao, X. M. Kang, B. D. Sun, and Y. Q. Zhang. 2016. “Relationship between Standing Vegetation and Soil Seed Bank in Different Vegetation Cover Types in Lakeshore, Lake Tai, China.” Ecological Engineering 96: 45–54. doi:10.1016/j.ecoleng.2016.03.040.
- Davis, C. A., J. E. Austin, and D. A. Buhl. 2006. “Factors Influencing Soil Invertebrate Communities in Riparian Grasslands of the Central Platte River Floodplain.” Wetlands 26 (2): 438–454. doi:10.1672/0277-5212(2006)26[438:FISICI]2.0.CO;2.
- Fitoussi, N., S. Pen-Mouratov, and Y. Steinberger. 2016. “Soil Free-living Nematodes as Bio-indicators for Assaying the Invasive Effect of the Alien Plant Heterotheca Subaxillaris in a Coastal Dune Ecosystem.” Applied Soil Ecology 102: 1–9. doi:10.1016/j.apsoil.2016.02.005.
- Franco, A. L. C., M. L. C. Bartz, M. R. Cherubin, D. Baretta, C. E. P. Cerri, B. J. Feigl, D. H. Wall, C. A. Davies, and C. C. Cerri. 2016. “Loss of Soil (Macro) Fauna Due to the Expansion of Brazilian Sugarcane Acreage.” The Science of the Total Environment 563: 160–168. doi:10.1016/j.scitotenv.2016.04.116.
- Fujii, S., N. Makita, A. S. Mori, and H. Takeda. 2016. “Plant Species Control and Soil Faunal Involvement in the Processes of Above- and Below-ground Litter Decomposition.” Oikos 125 (6): 883–892. doi:10.1111/oik.2016.v125.i6.
- Ge, B. M., J. M. Kong, H. Y. Cheng, X. Zheng, and Y. X. Bao. 2005. “Community Structure of Soil Macrofauna in Different Using Types of Soils in Autumn.” Zoological Research 26 (3): 272–278.
- Goncalyes, M. F., and J. A. Pereira. 2012. “Abundance and Diversity of Soil Arthropods in the Olive Grove Ecosystem.” Journal of Insect Science 12: 20.
- Guisan, A., S. B. Weiss, and A. D. Weiss. 1999. “GLM versus CCA Spatial Modeling of Plant Species Distribution.” Plant Ecology 143: 107–122. doi:10.1023/A:1009841519580.
- Han, L. L., Y. Wang, G. L. Wang, M. W. Zhang, and B. Li. 2007. “Soil Animal Diversity of Wetland and Farmland in Dongting Lake Region.” Biodiversity Science 15 (2): 199–206. doi:10.1360/biodiv.060244.
- Hartmut, K. 1998. “Secondary Succession of Soil Mesofauna: A Thirteen Year Study.” Applied Soil Ecology 9: 81–86. doi:10.1016/S0929-1393(98)00058-4.
- Haskell, D. E., A. L. Bales, C. R. Webster, M. W. Meyer, and D. J. Flaspohler. 2018. “Effectiveness of Bare-root and Gravel-culture Shrubs Used in Wildlife Habitat Restoration on Lakeshores in Northern Wisconsin.” Ecosystem Restoration 36 (4): 134–144. doi:10.3368/er.36.2.134.
- Hazelton, E. L. G., R. Downard, K. M. Kettenring, M. K. McCormick, and D. F. Whigham. 2019. “Correction To: Spatial and Temporal Variation in Brackish Wetland Seedbanks: Implications for Wetland Restoration following Phragmites Control.” Estuaries and Coasts 42 (3): 907. doi:10.1007/s12237-018-00500-2.
- Hestir, E. L., V. E. Brando, M. Bresciani, C. Giardino, E. Matta, P. Villa, and A. G. Dekker. 2015. “Measuring Freshwater Aquatic Ecosystems: The Need for a Hyperspectral Global Mapping Satellite Mission.” Remote Sensing of Environment 167: 181–195. doi:10.1016/j.rse.2015.05.023.
- Ho, W. C., C. L. Hui, H. C. Yen, T. S. Chu, Y. C. Wei, and Y. K. Chang. 2019. “Effects of Environmental Factors on Benthic Species in a Coastal Wetland by Redundancy Analysis.” Ocean Coast Management 169: 37–49. doi:10.1016/j.ocecoaman.2018.12.003.
- Hu, W. P., E. J. Sven, F. B. Zhang, Y. Chen, Z. L. Hu, and L. Yang. 2011. “A Model on the Carbon Cycling in Lake Taihu, China.” Ecological Modelling 222: 2973–2991. doi:10.1016/j.ecolmodel.2011.04.018.
- Hunt, H. W., and D. H. Wall. 2002. “Modelling the Effects of Loss of Soil Biodiversity on Ecosystem Function.” Global Change Biology 8: 33–50. doi:10.1046/j.1365-2486.2002.00425.x.
- Jiao, S., Y. Xu, J. Zhang, and Y. Lu. 2019. “Environmental Filtering Drives Distinct Continental Atlases of Soil Archaea between Dryland and Wetland Agricultural Ecosystems.” Microbiome 7 (1): 15. doi:10.1186/s40168-019-0630-9.
- Jin, X. C., S. K. Liu, and Z. S. Yi. 1995. China Lake Environment. Vol. II. Beijing: Ocean Press.
- Khemaissia, H., R. Jelassi, C. Souty-Grosset, and K. Nasri-Ammar. 2018. “Amphipoda and Isopoda Diversity around Tunisian Wetlands (North Africa) in Relation to Environmental Conditions.” African Journal of Ecology 56: 455–467. doi:10.1111/aje.12466.
- Korbel, K. L., S. Stephenson, and G. C. Hose. 2019. “Sediment Size Influences Habitat Selection and Use by Groundwater Macrofauna and Meiofauna.” Aquatic Sciences 81: 39. doi:10.1007/s00027-019-0636-1.
- Lakly, M. B., and D. A. Crossley. 2000. “Tullgren Extraction of Soil Mites (Acarina): Effect of Refrigeration Time on Extraction Efficiency.” Experimental and Applied Acarology 24 (2): 135–140. doi:10.1023/A:1006416731804.
- Liu, C., X. Wang, W. Wang, X. U. Shicai, C. Yuan, and Q. I. Long. 2014. “Relationship between Soil Fauna in Wetland and Wetland Restoration.” Journal of Ecology and Environmental Sciences 23 (4): 705–709.
- Liu, J., M. X. Gao, and D. H. Wu. 2017. “Characteristics of Ground-dwelling Soil Macro-arthropod Communities in a Biodiversity Monitoring Plot of Black Soil Cropland,northeastern China.” Chinese Journal of Applied Ecology 28: 3965–3975.
- Liu, J., N. K. Yi, S. Wang, L. J. Lu, and X. F. Huang. 2016. “Impact of Plant Species on Spatial Distribution of Metabolic Potential and Functional Diversity of Microbial Communities in a Constructed Wetland Treating Aquaculture Wastewater.” Ecological Engineering 94: 564–573. doi:10.1016/j.ecoleng.2016.06.106.
- Liu, R. T., H. L. Zhao, and X. Y. Zhao. 2012. “Effects of Different Afforestation Types on Soil Faunal Diversity in Horqin Sand Land.” Chinese Journal of Applied Ecology 23: 1104–1110.
- Liu, W. L., M. Guan, S. Y. Liu, J. Wang, J. Chang, Y. Ge, and C. B. Zhang. 2015. “Fungal Denitrification Potential in Vertical Flow Microcosm Wetlands as Impacted by Depth Stratification and Plant Species.” Ecological Engineering 77: 163–171. doi:10.1016/j.ecoleng.2015.01.017.
- Longcore, T. 2003. “Terrestrial Arthropods as Indicators of Ecological Restoration Success in Coastal Sage Scrub (California, USA).” Restoration Ecology 11 (4): 397–409. doi:10.1046/j.1526-100X.2003.rec0221.x.
- Ma, C., X. Yin, and H. Wang. 2019. “Soil Fauna Effect on Dryas Octopetala Litter Decomposition in an Alpine Tundra of the Changbai Mountains, China.” Alpine Botany 129 (1): 53–62. doi:10.1007/s00035-018-0215-4.
- Ma, K. P. 1994. “Measurement Methods of Biodiversity (I).” Biodiversity Science 2: 162–168. doi:10.17520/biods.1994027.
- Mitsch, W. J., and N. M. Wang. 2000. “Large-scale Coastal Wetland Restoration on the Laurentian Great Lakes: Determining the Potential for Water Quality Improvement.” Ecological Engineering 15 (3): 267–282. doi:10.1016/S0925-8574(00)00081-1.
- Murray, P. J., R. Cook, A. F. Currie, L. A. Dawson, A. C. Gange, S. J. Grayston, and A. M. Treonis. 2006. “Interactions between Fertilizer Addition, Plants and the Soil Environment: Implications for Soil Faunal Structure and Diversity.” Applied Soil Ecology 33 (2): 199–207. doi:10.1016/j.apsoil.2005.11.004.
- National Research Council. 2002. Riparian Areas. Washington, DC: National Academy Press.
- Neher, D. 2001. “Role of Nematodes in Soil Health and Their Use as Indicators.” Journal of Nematology 33 (4): 161–168.
- Orozco, R. A., M. M. Lee, and S. P. Stock. 2014. “Soil Sampling and Isolation of Entomopathogenic Nematodes (Steinernematidae, Heterorhabditidae).” Journal of Visualized Experiments 89: e52083–e52083.
- Pan, B. Z., Z. Y. Wang, Z. W. Li, G. A. Yu, M. Z. Xu, N. Zhao, and G. Brierley. 2013. “An Exploratory Analysis of Benthic Macroinvertebrates as Indicators of the Ecological Status of the Upper Yellow and Yangtze Rivers.” Journal of Geographical Sciences 23: 871–882. doi:10.1007/s11442-013-1050-6.
- Ramírez-Fernández, L., N. Trefault, M. Carú, and J. Orlando. 2019. “Seabird and Pinniped Shape Soil Bacterial Communities of Their Settlements in Cape Shirreff, Antarctica.” PloS One 14 (1): e0209887. doi:10.1371/journal.pone.0209887.
- Rodgers, D., J. Mcphee, P. Aird, and R. Corkrey. 2018. “Soil Arthropod Responses to Controlled Traffic in Vegetable Production.” Soil and Tillage Research 180: 154–163. doi:10.1016/j.still.2018.03.002.
- Rudolf, P. R., S. Serguei, P. Guadalupe, M. F. Carol, B. Louis-Félix, B. Jordi, and M. T. Jason. 2016. “Persist or Produce: A Community Trade-Off Tuned by Species Evenness.” The American Naturalist 188 (4): 411–422. doi:10.1086/688046.
- Russell, R. S. 1977. “Plant Root Systems: Their Function and Interaction with the Soil.” Journal of Applied Ecology 125: 4.
- Taihu River Basin Authority. 2010. Accessed February 25 2016. http://www.tba.gov.cn/
- Volkmar, W. 2001. “Biodiversity of Soil Animals and Its Function.” European Journal of Soil Biology 37 (4): 221–227. doi:10.1016/S1164-5563(01)01088-3.
- Wardle, D. A., R. D. Bardgett, J. N. Klironomos, H. Setälä, D. P. W. H. Van, and D. H. Wall. 2004. “Ecological Linkages between Aboveground and Belowground Biota.” Science 304 (5677): 1629–1633. doi:10.1126/science.1094875.
- Warren, M. W., and X. M. Zou. 2002. “Soil Macrofauna and Litter Nutrients in Three Tropical Tree Plantations on a Disturbed Site in Puerto Rico.” Forest Ecology and Management 170 (1–3): 161–171. doi:10.1016/S0378-1127(01)00770-8.
- Wu, H. T., X. G. Lu, M. Jiang, and B. G. Zhu. 2008. “The Characteristics of Soil Fauna Community Structure and Its Seasonal Variations of Typical Wetlands in the Sanjiang Plain, China.” Wetland Science 6: 459–465.
- Wu, P., and C. Wang. 2019. “Differences in Spatiotemporal Dynamics between Soil Macrofauna and Mesofauna Communities in Forest Ecosystems: The Significance for Soil Fauna Diversity Monitoring.” Geoderma 337: 266–272. doi:10.1016/j.geoderma.2018.09.031.
- Yin, H. 2003. “The Thoughts of Wetland Conservation in China.” Wetland Science 1: 68–72.
- Yin, W. Y. 1998. China Soil Animal. Beijing: Science Press.
- Yin, W. Y. 2000. Soil Animal of China. Beijing: Science Press.
- Yin, X. Q., B. Song, W. H. Dong, and W. D. Xin. 2010. “A Review on the Eco-geography of Soil Fauna in China.” Acta Geographica Sinica 65 (1): 91–102.
- Yin, X. Q., W. Gu, W. H. Dong, L. L. Qiu, Y. B. Liu, and L. Tao. 2008. “The Community Change and Diversity of Soil Fauna after Artificial Vegetation Restoration in Highway Slope.” Acta Ecologica Sinica 28 (9): 4295–4305.
- Zedler, J. B. 2011. “Restoring a Dynamic Ecosystem to Sustain Biodiversity.” Ecological Restoration 29 (1–2): 152–160. doi:10.3368/er.29.1-2.152.
- Zhang, H., and L. M. Chu. 2013. “Early Development of Soil Microbial Communities on Rehabilitated Quarries.” Restoration Ecology 21 (4): 490–497. doi:10.1111/rec.2013.21.issue-4.
- Zhang, J. T. 2004. Ecological Methods of Vegetation Quantity. Beijing: China Science and Technology Press.