
 ?Mathematical formulae have been encoded as MathML and are displayed in this HTML version using MathJax in order to improve their display. Uncheck the box to turn MathJax off. This feature requires Javascript. Click on a formula to zoom.
ABSTRACT
Investment and construction of power infrastructure are directly related to the achievement of sustainable development goals. China's trade and investment with BRI (Belt and Road Initiative) countries have maintained growth trend. The development and construction of these investment projects certainly have impacts on the economic development mode and sustainable development goals of the countries. On collecting the basic information of the renewable energy investment projects, this paper compares and calculates the current power technology structure and grid emission factors of the host countries, and analyses the carbon emission level of electricity generation from the perspective of the whole life cycle. Making it as the benchmark, this paper also analyzes the current China's invested wind and solar energy projects and the carbon emission reduction benefits to the host country. The results show that at present, China has about 36 renewable energy investment projects in BRI countries, with an installed capacity of 15.75GW (China as the project owner or investor), and achieve at least 48.69M tCO2 emission reduction. This shows that China's effective investment and implementation of the green projects will provide a strong impetus for the energy transformation and the improvement of their energy security in BRI countries.
Introduction
nvestment and construction of energy infrastructure provide an important foundation and support to a country’s economic development, especially to the construction of power infrastructure, which is directly related to the achievement of sustainable development goals. As the global tackling of climate change becomes increasingly urgent, infrastructure investment and construction exert an increased impact on the achievement of the goals of the Paris Agreement. According to BP’s World Energy Outlook 2019 (BP Citation2019), almost all of the increase in electricity demand is from developing economies, and renewable energy is expected to account for about 30% of the global power generation by 2040. To achieve a global temperature rise below 2°C, the renewable energy power sector requires 12 trillion US dollars of investment by 2040; this amount is equivalent to an annual investment level of 500 billion US dollars, as indicated in the World Energy Outlook presented by International energy agency(IEA) (IEA Citation2019). An estimated investment of 45 to 56 billion US dollars, including public and private investment, is required annually to achieve the global energy penetration target by 2030 (REN21 Citation2019). Therefore, investment in and development of global renewable energy play important roles in achieving sustainable development goals and addressing climate change.
Most of the countries under the Belt and Road Initiative (BRI) are developing economies with a population of about 3 billion, which accounts for 44% of the global population. These countries have a low social development level and exhibit extensive variation. The average per capita GDP of the countries along the line is 12,000 US dollars. The level of infrastructure in these countries is low, and the per capita electricity consumption is approximately 4,000 kWh. Given economic development and the increase in the per capita income level, the corresponding industrialization process must be accelerated. Several investment agencies predict that Southeast Asia, Central Asia and Western Asia will become new drivers of world economic growth in the future. From 2015 to 2030, about 50% of the global GDP may come from BRI countries (International Institute for Applied Systems Analysis (IIASA) Citation2016). An increase in per capita GDP may lead to a significant rise in energy consumption and carbon emissions (Liu and Hao Citation2018). BRI countries are the world’s important energy production bases, but their per capita fossil energy consumption levels are still lower than the global average, indicating massive growth potential. The electricity demand of BRI countries will increase significantly in the future to meet the basic electricity demand from expected growth (IEA Citation2017). Meanwhile, the renewable energy resource endowment of BRI countries is relatively abundant and provides a good foundation for the development of renewable energy. For example, Vietnam, Kazakhstan, and Mongolia have abundant wind energy resources, and India and Pakistan possess extensive solar energy reserves.
The connectivity of facilities is a priority in implementing BRI. The trade and investments of BRI countries are important in promoting the trade and economic growth of host countries. From 2013 to 2018, the total value of imports and exports between China and BRI countries reached 6.4 trillion US dollars, with direct investment exceeding 80 billion US dollars and creating 244,000 jobs locally. Moreover, China’s trade and investment in BRI countries have maintained an overall growth trend. Given that several of these countries are ecologically fragile, the environmental impact of investment projects, especially large-scale fossil fuel investment projects, is expected to pose serious challenges to energy transition and climate change. As the world’s largest producer and consumer of renewable energy, China’s renewable energy investment and capacity cooperation with BRI countries increase continuously and play a positive role in promoting the sustainable development of the host country. Therefore, this work analyses the emission reduction effects of renewable energy projects on the host country and shows the potential for promoting the host country’s economic development and achieving sustainable development goals. On this basis, this study proposes suggestions on the sustainable promotion of renewable energy investment and the corresponding incentive policies in BRI countries.
Literature review
Current research on Chinese investment in BRI countries emphasizes two aspects: analysis of the opportunities and challenges in Chinese investment in BRI countries and evaluation of the impact of investment projects from the perspective of the society, economy, energy and environment. Amongst them, environmental impact is a topic of concern.
Most of the analyses of the opportunities and challenges of China’s investment in BRI countries are qualitative and primarily conducted from the perspective of the host country’s political and economic governance to elaborate on the impact of bilateral political relations (Liyan and Zhen Citation2018), the host country’s political system (Luo, Fang, and Chen Citation2017; Chunmei, Citation2017; Dingchao Citation2018; Jinbo Citation2019) and the financial system innovation (Yan and Qian Citation2018; Jingyang Citation2018) of investment projects. Fang et al. (Hui and Yujie Citation2019) comprehensively considered political, military, economic and socio-cultural risks and other factors. They established an investment risk assessment index system for 43 BRI countries and confirmed that the host country’s political, military and socio-cultural risks are the main influencing factors. Song et al. (Yongchao and Huayuan Citation2019) concluded that the level of governance and economy and the signing of bilateral trade agreements have a positive impact on direct investment. Huang et al. (Huang Citation2019) established an investment risk assessment index system from qualitative and quantitative perspectives to assist Chinese enterprises in choosing an investment country; the system qualitatively measures the environmental impact of investment.
With the gradual increase in investment in BRI countries and the acceleration of the global response to climate change, the energy and environmental impacts of BRI investment have gradually attracted widespread attention. Several studies have focused on the environmental impact of China’s investment on host BRI countries. BRI has considerably promoted Chinese firms’ outward foreign direct investment, with an average increase of about 45% (Shu, Qian, and Liu Citation2019). However, as previous trade studies have discovered, BRI trade leads to resource and pollutant flows, which in turn cause global problems, such as carbon leakage (Tian et al. Citation2018). Furthermore, it also affects virtual water (Zhang et al. Citation2018), global health (Hu, Liu, and Hu Citation2017) and mineral resources (Liu et al. Citation2018). Studies conducted from the perspective of energy consumption and carbon emissions have shown that BRI countries are generally low-income economies and lack renewable energy facilities. The construction of infrastructure, especially roads, bridges, mining, power plants and dams, requires a large amount of energy, of which fossil fuel may account for a large proportion (Liu et al. Citation2018). The operation and maintenance of such infrastructure are expected to produce continuous carbon emissions over the next few decades (Zhang et al. Citation2017). Yuan et al. (Jiahai et al. Citation2019) qualitatively analyzed the environmental impact of investing in coal-fired power plants in 23 BRI countries. Their results showed that the better the economic foundation is, the less the emission impact is. Ma et al. (Guifeng Citation2019) used the analytic hierarchy process and the entropy method to evaluate the energy investment environment of major BRI countries from the perspective of industrial, supply and value chains. Amongst the countries, Russia is the first choice for multinational energy investment enterprises.
Existing research has also focused on the environmental challenges brought about by China’s BRI investment. Studies (Xu et al. Citation2019) have shown that such investment has led to an increase in China’s net exports, particularly in polluting and resource-intensive industrial sectors, such as the smelting of ferrous and non-ferrous metals. From the perspective of carbon leakage, Cai et al. (Xiang et al. Citation2018) examined the pollution transfer relationship between 66 BRI countries and China with the theory of “pollution heaven.” The results indicated that China has become a “pollution heaven” for 22 developed BRI countries. At the same time, 19 developing BRI countries have become “pollution heavens” for China because of the nationalization of industries. Shi et al. (Chen et al. Citation2019) evaluated the potential of solar photovoltaic power generation in BRI countries. They found that the generated amount is 448.9 per year, which is 41.3 times the power demand of BRI countries in 2016.
An overall view of previous studies reveals the following conditions. (1) Existing research partly identified the necessary conditions for successful investment projects in BRI countries and the influence of these conditions. Such research provides a good reference for China to invest in BRI countries and identify major risks. (2) Existing research on the impact of BRI investment focused on the environmental impact resulting from the substantial infrastructure investment and high share of fossil fuel power plant investment. However, with the substantial increase in China’s renewable energy investment in BRI countries, increased attention should be devoted to the emission reduction benefits brought by renewable energy investment. Such emphasis can be in line with the national policy objectives of energy conservation and emission reduction of the host countries and help in the achievement of sustainable development goals. (3) Given the complexity of data and the lack of research methods, existing studies rarely analyzed the emission reduction benefits brought by the renewable energy projects invested by BRI from a quantitative perspective.
Therefore, in accordance with a benchmarking methodology framework of clean development mechanism (CDM) projects, this study quantitatively analyses the emission reduction benefits brought by the renewable energy projects that China has invested in compared with those of traditional projects in BRI countries. Furthermore, on the basis of the potential of renewable energy resources in BRI countries, this work analyses the investment space of renewable energy in the future and puts forward corresponding policy recommendations.
Methods and data
Methods and research boundaries
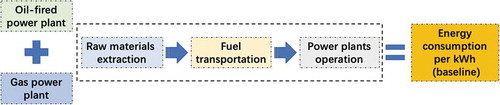
This work focuses on power projects and analyses the gap between the renewable energy power projects that China has invested in (mainly wind and solar projects) and conventional power projects in BRI countries. The rationale of this method is similar to the principle of additionality comparison of CDM projects in the Kyoto Protocol. The research boundary primarily includes fuel resource exploitation, transportation and power plant operation and excludes downstream power transmission and distribution links. The specific logic of the methodology is shown in .
Figure 1. Research boundary
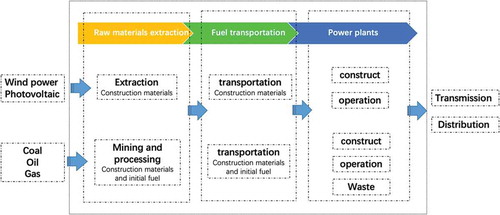
This article defines the benefits of emission reductions as the difference in the value of energy consumption and carbon emissions between newly invested renewable energy projects and existing conventional projects in the host country as they provide the same services and products (defined herein as the output of electricity). When the result is negative, then emission reduction benefits are present. The specific calculation formula is as follows:
where is the difference between the carbon emission intensity per unit electricity of renewable energy projects and that of traditional power projects in the host country, and the unit is
.
is the carbon emission intensity per unit electricity caused by the investment in renewable energy projects, and
is the counterpart caused by existing conventional power technology projects.
where (Re and Tr represents renewable energy projects and traditional power projects, respectively).
is the energy consumption of
project (in
).
is the power generation of
project (in
).
is the emission factor per unit energy consumption of
project (in
). The above formula indicates that the main influencing factor of emission reduction is the fuel structure of energy consumption. In accordance with the IPCC calculation principle, the emission factors in EquationEq.(2)
(2)
(2) are calculated with the structure of energy consumption as Eq.(3).
/
,(3)
where is the weighted emission factor per unit of energy consumption (in
),
is the emission factor for
fuel and
is the consumption of
fuel (in
).
Data sources
The basic energy infrastructures of the BRI countries vary significantly, especially in terms of power infrastructure. This variation, together with other factors, such as inconsistent data caliber and complexity and availability of data, prompt this study to select typical countries as the data basis. Moreover, energy structure is used as the selection principle. The energy consumption and carbon emission intensity per unit electricity of typical countries are calculated as reference values from the life cycle perspective. For the upstream mining and transportation factors in other countries, this study mainly adopts the average value of BRI countries. The emission factor created by electricity generation fuel mix of the BRI countries are measured separately through IEA’s country energy balance tables to further reduce the uncertainty of the calculation results. This work uses IEA data as the basis; hence, electricity converted accounting are all based on the power calorific value equivalent method.
The original data on China’s BRI renewable energy investment are from the renewable energy project data and asset financing data in the Bloomberg New Energy Database. The time point of the data is December 2018.
Results
Current situation of China’s renewable energy investment in BRI countries
China’s energy investment and capacity cooperation in BRI countries have been increasing since BRI was put forward. As the world’s largest producer and consumer of renewable energy, China has participated in renewable energy projects at different levels and stages. During this period, China’s role has gradually changed from equipment supplier and engineering contractor to owner and investor; the latter roles have a more far-reaching impact on the development of renewable energy in BRI countries than the former roles. This chapter organizes and analyses the situation of renewable energy projects, including solar energy, wind power, geothermal and small hydropower projects, carried out by China in BRI countries in terms of investment structure, project type, temporal and spatial trend change and geographical distribution.
Chinese enterprises and banks can participate in renewable energy projects in the following ways: as the owner, financing party, engineering contractor and equipment exporter. Amongst these ways, equipment export and engineering contracting are still the most common models for Chinese renewable energy companies. Of all the renewable energy projects in which China participates, 66% use Chinese equipment and 42% are undertaken by Chinese engineering contractors. Meanwhile, the projects invested in by China as the owner account for 37%, and the projects financed by China account for only 2%. However, the manner through which China participates in projects also changes over time and is gradually transitioning from a single export of equipment and engineering construction to being an investor. Given the overlapping of these categories, to ensure the accuracy of the research, this study classifies the types of projects in which Chinese parties participate according to the following mutually exclusive categories: (1) Category I: projects led by China as the owner; (2) Category II: projects led by China as the financing party; (3) Category III: projects in which China participates as a contractor; and (4) Category IV: projects in which China participates only as an equipment supplier. The four categories are mutually exclusive, and the overlapping problems are solved. The resulting classification can also reflect the driving force of China’s participation in projects.
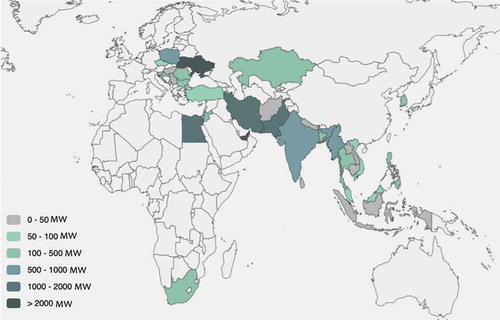
As of December 2018, China has participated in renewable energy projects in 45 BRI countries, with a total installed capacity of approximately 33.95 GW. The installed capacity of projects invested in by China (Categories I and II) is approximately 15.75 GW and accounts for 46% of the total participation distributed in 36 countries along the road (). Amongst all BRI countries, those most favored by China’s renewable energy investment are the United Arab Emirates, Ukraine, Pakistan, Egypt and Myanmar. Of the investment with a total installed capacity of 15.75 GW, 27% of the projects are in operation, and others are still at different development stages. Approximately 3.74 GW of renewable energy projects are under construction and account for 23.8% of the total investment capacity. Moreover, 47.7% of the projects are at the planning stage, with about 7.52 GW of installed capacity.
Figure 2. Country distribution of renewable energy investment projects
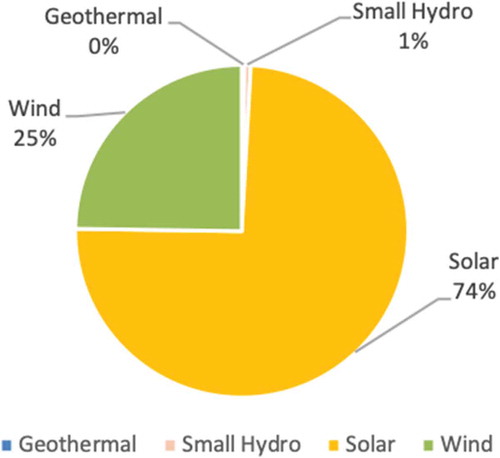
Amongst the investment projects with 15.75 GW installed capacity, the installed capacity of photovoltaic investment projects is 11.71 GW and accounts for 74% of the total investment. The installed capacity of wind energy investment projects is approximately 3.9 GW and represents 25%, followed by geothermal projects (1%) and small hydropower projects (0.3%) (). China’s renewable energy investment in the UAE mainly entails photovoltaic projects with an investment capacity of up to 3.28 GW. Investment in Ukraine and Egypt also focuses on photovoltaic projects. Given the promotion of the China–Pakistan Economic Corridor, the wind power and photovoltaic investment in Pakistan is high. In Myanmar, Poland and South Africa, wind power is the main investment. In Indonesia, geothermal project is the main investment.
Figure 3. Proportion of renewable energy investment categories
Power emission status and development potential of renewable energy in major BRI countries
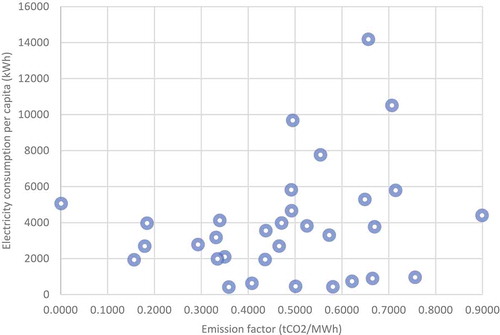
On the basis of IEA’s 2019 fuel structure and power generation in the country’s energy balance sheets, this study analyses the current electricity production and emission status of the major BRI countries, as shown in . The per capita power consumption of the BRI countries is generally low, but due to the differences in the power fuel structure, the emission factors per unit electricity vary widely, and the average level is basically maintained at 0.5. Czech Republic, Hungary, Ukraine, Romania, Maldives and Slovenia have very high installed nuclear power capacities, which account for close to or above 50%. These countries have low emission factors for electricity and are in the lower left area of the chart. A few countries are still dominated by hydropower; examples include Kazakhstan and Nepal, whose hydropower basically exceeds 90% and whose emission factors are very low. India, South Africa and Poland are typical coal-dominated countries whose electricity consumption emission factors per unit electricity are nearly twice that of the average. The fuel structure of other countries is dominated by oil and gas, and their consumption is nearly one-third lower than that of coal-dominated countries.
Figure 4. Power consumption per capita and emission factors per unit electricity
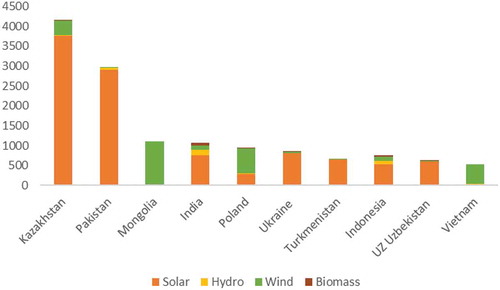
The main BRI countries with rich renewable resources according to the assessment from the International Energy Agency (Energy trend Citation2018)and Global Environmental Institute (Global environment institute Citation2019) are shown in . The total installed capacity in the future within BRI countries is expected to be 15,000 GW, Kazakhstan is the most resources country, of which the installed potential of solar energy accounts for more than 67% and the potential for wind power accounts for 18%. The development of renewable energy in BRI countries is at different stages. In the field of wind power, India has developed wind resources that account for about 30% of reserves. The rest of the countries are still in the early stages of development, and the application of wind resources is scarce. In terms of solar energy, although Pakistan, Kazakhstan and other countries have abundant solar energy, their development volume is less than 0.5%; hence, the potential for future development is very high.
Figure 5. Renewable resource-rich BRI countries (GW)
Meanwhile, the development and utilization costs of renewable energy have decreased due to the continuous development of renewable energy technology. According to a report from the International Renewable Energy Agency, the weighted average power generation cost of global photovoltaic solar energy and onshore wind power decreased by 13% in 2018. From 2010 to 2018, the weighted average power generation cost of onshore wind power that is newly produced globally declined to 0.056 USD per kWh, which is only slightly higher than the cheapest new fossil fuel ($0.049 per kWh). By 2020, the cost of solar and wind energy is predicted to decline further, and the cost of onshore wind energy and solar photovoltaic power generation will be cheaper than the cheapest fossil fuel power generation. Moreover, the marginal operating cost of renewable energy power plants will be much lower than it is now. Therefore, the opportunities for BRI countries to achieve sustainable development and climate change targets at low investment costs have been greatly increased. This development also provides a strong guarantee for the determination and policy-making of BRI countries to develop renewable energy.
Case country: Pakistan
In this study, Pakistan is selected as a typical oil- and gas-based case country. Pakistan’s electricity consumption grew rapidly from 2000 to 2016, with an average annual growth of approximately 3.48%. Residential and commercial sectors are the main consumers of electricity (accounting for approximately 62% of the total). In 2017, the total installed capacity of power in Pakistan was 25 GW, of which 35.2% was oil-fired power, 29% was gas-fired power, 29% was hydropower, 5.8% was nuclear power and a small proportion was generated from other renewable energy. From the perspective of power generation, the total power generation in 2017 was 131.28 TWh, including 32.8% of oil, 29.23% of gas, 32.12% of hydropower, 4.27% of nuclear power, 0.19% of solar energy and 0.73% of wind power. Renewable energy development is lagging in Pakistan. Wind power has developed since 2013 and solar energy since 2015. Therefore, Pakistan’s current electricity is dominated by fuel and gas.
The data collection and calculation process of Pakistan’s baseline is shown in .
Figure 6. Baseline calculation for the Pakistan case
For the energy consumption in fossil fuel exploitation, this study refers to existing literature (Akber, Thaheem, and Arshad Citation2017) that cites data on fuel consumption and non- biological resources. The specific data results are shown in .
Table 1. Fuel consumption per unit electricity by technology and non-biological resources and ADP
Abiotic depletion potential (ADP) is calculated based on the global reserves of major non-biological resources in 1999 and the current mining speed. The ADP unit is antimony mass equivalent (kg Sb-eq). The non-biological resource footprint mainly considers the scarcity of metals and minerals.
The energy consumption of fossil fuel transportation considers the geographic location of power plants (Wikipedia Citation2019) and the import and export of fuel (Khan Citation2018). The transportation energy consumption of fossil fuel is estimated by appraising the pipeline, port transportation, local truck transportation mode, transportation distance and transportation volume of fuel oil. The fuel consumption of power plant operation is mainly ascertained based on data from literature surveys.
Using the same method, this study also analyses the baseline of Pakistan gas power plants, as shown in . The energy consumption per unit electricity of fuel transportation is basically negligible, but the energy consumption of raw material mining is higher than the fuel consumption of power plants.
Table 2. Energy consumption levels of gas and oil power plants in the Pakistan case
According to the data of 20 plants, the average installed capacity of Pakistan’s oil fired power plant is approximately 396 MW, and the average number of generating hours is 3479. Meanwhile, the average installed capacity of a gas-fired power plant is 524 MW and the average number of generating hours is 5385. According to the weighted average of these power plants, Pakistan’s baseline energy consumption per unit electricity level is 0.5765 toe/MWh, and the comprehensive carbon emission factor is 1.4776 tCO2/MWh. The energy intensity calculated in this study is a coefficient from the perspective of the whole life cycle and includes not only the fuel consumption data in the operation process of the power plant, but also the data in the upstream raw material mining and transportation process.
The total installed capacity of renewable energy projects invested in and constructed by China in Pakistan is approximately 1.74 GW thus far. According to the baseline results calculated above, the corresponding emission reduction can be 2.5 million tons, accounting for 1.32% of the total national emission. When emissions from the power sector are considered, the corresponding reduction effect is 4.67%. According to the results of the whole life cycle, 5.26 million tons can be reduced.
Case country: Poland
In this study, Poland is selected as a case country with coal as the main energy source. In 2017, the total installed capacity of Poland was 45,939 MW, of which coal accounted for 69.6%, natural gas for 5.1%, hydropower for 5.1% and wind power and other renewable energy for 14.4%. From the perspective of power generation, the total power generation in 2017 was 143.07 TWh, including 79.77% of coal, 7.55% of wind power, 4.70% of gas, 1.57% of hydropower and 0.07% of solar energy. As of 2018, the total installed capacity of renewable energy in Poland was 8233 MW, including 5775 MW of wind power, accounting for about 70% of the total installed capacity of renewable energy, and only 487 MW of solar power. Poland has 53 power plants, including 51 coal-fired power plants that serve as the main power supply. Coal-fired power plants consume hard and brown coal. Poland imports 20% of its coal for power generation, and 78% of its imported coal in 2018 came from Russia. Poland has a shortage of oil and gas resources, and its energy self-sufficiency rate is low.
The data collection and calculation process for the Polish baseline is the same as that for Pakistan. Given that the main power supply in Poland is coal-fired power plants, which primarily consume hard coal and lignite, the weighted average of coal-fired, gas and oil power plants is selected to determine the power baseline. The baseline of Poland’s coal-fired and oil power plants is shown in . The raw material extraction data come from similar source (Energy trend Citation2018), Fuel consumption data come from IEA country electricity generation data sheet (International Energy Agency Citation2019). The related data of fuel transportation come from Mann et al (Mann and Spath Citation1997) and Spath and Kerr Citation1999. The energy consumption of fuel transportation is basically negligible, and the energy consumption during the raw material mining process is higher than the fuel consumption of power plants.
Table 3. Energy consumption levels of coal-fired and oil power plants in the Polish case
On the basis of the weighted average of the electricity generation, the baseline energy consumption per unit electricity level in Poland is 0.7883 toe/MWh, and the comprehensive carbon emission factor is 2.524 tCO2/MWh.
The total installed capacity of renewable energy projects invested in and constructed by China in Poland is approximately 812 MW thus far. The baseline results calculated above reveal that the corresponding emission reduction can be 1.42 million tons, accounting for 0.46% of the total national emission. According to the results of the whole life cycle, 5.11 million tons can be reduced.
Reduction effect of current renewable energy investment in BRI countries
Statistical analysis indicates that 36 countries have renewable energy investment projects (Categories I and II). They are classified in according to their power generation structure and divided into coal-dominated, oil and gas-dominated, and hydropower-dominated countries.
Table 4. Classification of countries with China’s renewable energy investment projects
On the basis of the fuel consumption structure of power generation, this study separately measures the energy consumption and carbon emission factors per unit of electricity during the operation phase. Then, the energy consumption levels and emission factors per unit of electricity by country are obtained as reference values. According to the calculation caliber of this work, from the perspective of the entire life cycle, China’s renewable energy investment projects in the BRI countries currently reduce emissions by at least 48.69 Mt, which accounts for 0.6% of the carbon emissions of the 36 BRI countries. If only the operation of the power plant is considered, then the direct emission reduction is 14.02 Mt
, which accounts for 0.17% of the carbon emissions of the 36 BRI countries. Therefore, China’s renewable energy projects in the BRI countries can provide certain emission reduction benefits, help in sustainable development and improve the abilities of these countries to cope with climate change.
In addition, due to the large differences in energy structure amongst BRI countries, the impacts of renewable energy projects on different countries also vary. Amongst the BRI countries with renewable energy investment from China, the installed capacity of the investment projects of the United Arab Emirates, Ukraine and Pakistan exceeds 1800 MW. Therefore, the emission reduction of these renewable energy projects is 3%–5%, of which Pakistan has the highest value (close to 5%). Kazakhstan, which is rich in renewable resources, currently has few investment projects, and its emission reduction effect is not obvious. Thus, Kazakhstan has considerable potential for future renewable energy investment.
Results and discussion
According to the general law of economic development, the future energy demand of BRI countries has much room for growth. The energy structures of BRI countries are dominated by oil and gas, and the construction of their energy systems also leads to increased energy infrastructure construction. Therefore, their energy consumption is expected to continue to grow rapidly in a short period, thus posing a huge challenge to these countries that face the pressure of global climate change. However, based on the complexity of the data and the difficulty of collecting project information, most of research are qualitative or macro-level reviews, and few quantitative analyses support specific impacts. Based on the maximum available project data and minimizing uncertainty, this article conducts relevant quantitative analysis to provide scientific support for the impact of renewable energy investment in the BRI countries.
The energy infrastructure construction of BRI countries can meet the economic development needs of these countries and promote their economic growth. Therefore, the construction of energy technology infrastructure entails a combination of severe environmental and climate change challenges. Pakistan’s case shows that more than 70% of fuel for oil power plants needs to be imported. Vigorously developing renewable energy power generation projects in Pakistan will help improve the security of the country’s energy supply. Such endeavor can be combined with tackling climate change and achieving sustainable development.
China’s investment and construction of renewable energy projects in BRI countries can help these countries achieve energy transformation and promote the construction of a global low-carbon energy system. According to a report issued by Deloitte, renewable energy installations in BRI countries have great potential for growth and are expected to add about 1940 GW by 2030 and another 2600 GW between 2030 and 2040. The value is expected to reach approximately 4500 GW by 2040, which is twice the global renewable energy installation in 2018. Accordingly, the power generation of new installed renewable energy projects in BRI countries in 2030 is estimated to reach 3500 trillion kWh. Assuming China participate the renewable energy projects by 100GW in 2030, it is estimated that the whole investment will be about 500 billion yuan (with an average investment of 5000 yuan/kW), and the emission reduction effect will be 240 million tCO2. This shows that China’s effective investment and implementation of the green projects will provide a strong impetus for the energy transformation and the improvement of their energy security in BRI countries.
China’s investment in renewable energy construction in BRI countries can optimize the energy structure of these countries, strengthen their energy security, promote the construction of a global low-carbon energy system and exert a far-reaching impact on promoting human survival. Investment and construction of renewable energy projects in BRI countries also require effective cooperation between the investing and host countries to ensure the technological advancement and environmental sustainability of the investment projects. The host countries need to raise their awareness of environmental protection and scientifically plan the projects to provide a solid guarantee for their own social and economic prosperity.
The quantitative analysis performed in this study is based on the principle of project baseline in the existing CDM methodology. With the exception of typical countries, the upstream mining and transportation factors in other countries use the average value of BRI countries due to poor data availability, which can be improved further. In addition, transport distance, mode and volume are estimated in the calculation of the transport energy consumption data of typical countries. Thus, the simulation results entail some uncertainty.
Disclosure Statement
No potential conflict of interest was reported by the authors.
Additional information
Funding
References
- Akber M Z, Thaheem M J, Arshad H., and H. Arshad. 2017. “Life Cycle Sustainability Assessment of Electricity Generation in Pakistan: Policy Regime for a Sustainable Energy Mix.” Energy Policy 111: 111–10. doi:10.1016/j.enpol.2017.09.022.
- BP. 2019. BP World Energy Outlook 2019. London: BP.
- Chen, S., L. Xi, M. Yufei, D. Yu, C. P. Nielsen, E. Noah, W. Yuanchen, K. G. Logan, B. McElroy Michael, and H. Jiming. 2019. “The Potential of Photovoltaics to Power the Belt and Road Initiative.” Joule 3 (8).
- Chunmei, L. 2017. Impact of Host Country System Quality on China’s Foreign Direct Investment. Henan University.
- Dingchao, T. 2018. The impact of national risk on China’s foreign direct investment.
- Energy trend. 2018. https://www.energytrend.cn/news/20180507-29463.html
- Global environment institute. 2019. GEI Perspective: Analysis of the Potential of Renewable Energy Development and Energy Transition in the “Belt and Road” Countries. http://www.geichina.org/news/publications/
- Guifeng, M. 2019. Identification of Major Energy Cooperation Countries in the Belt and Road and Investment Environment Evaluation. Qingdao University of Science and Technology.
- Hu, R., R. Liu, and N. Hu. 2017. “China’s Belt and Road Initiative from a Global Health Perspective.” Lancet Glob. Health 5 (8): 752. doi:10.1016/S2214-109X(17)30250-4.
- Huang, Y. 2019. “Environmental Risks and Opportunities for Countries along the Belt and Road: Location Choice of China’s Investment.” Journal of Cleaner Production 211: 14e26. doi:10.1016/j.jclepro.2018.11.093.
- Hui, F., and S. Yujie. 2019. “Host Country Risk and China’s Foreign Direct Investment——Based on the Investigation of 43 Countries along the Belt and Road.” Journal of Shanghai University of Finance and Economics 21 (5): 33–52.
- IEA. 2017. World Access Outlook 2017. International Energy Agency.
- IEA. 2019. World Energy Outlook 2019. International Energy Agency.
- International Institute for Applied Systems Analysis (IIASA). 2016. SSP Scenario Database. http://www.iiasa.ac.at/web/home/research/researchPrograms/Energy/SSP_Scenario_Database.html
- Jiahai, Y., X. Li, C. Xu, C. Zhao, and Y. Liu. 2019. “Investment Risk Assessment of Coal-fired Power Plants in Countries along the Belt and Road Initiative Based on ANP-Entropy-TODIM Method.” Energy 176: 623-640.
- Jinbo, W. 2019. “Bilateral Political Relations, Quality of Host Country Institutions and Location Choice of China’s Outward Foreign Direct Investment: A Quantitative Analysis of Chinese OFDI from 2005-2017.” Journal of Contemporary Asia-Pacific Studies 2019 (3): 4–28.
- Jingyang, L. 2018. Trade Liberalization and China Foreign Direct Investment Model. East China Normal University.
- Khan, I. M. 2018. “Comparative Well-to-Tank Energy Use and Greenhouse Gas Assessment of Natural Gas as a Transportation Fuel in Pakistan.” Energy for Sustainable Development 43: 38–59. doi:10.1016/j.esd.2017.12.004.
- Liu, C., Q. Liu, J. Li, Y. Li, and A. Wang. 2018. “China’s Belt and Road Initiative in Support of the Resourcing Future Generations Program.” Natural Resources 27: 257–274. doi:10.1007/s11053-017-9342-7.
- Liu, Y., and Y. Hao. 2018. “The Dynamic Links between CO2 Emissions, Energy Consumption and Economic Development in the Countries along “The Belt and Road”.” The Science of the Total Environment 645: 674–683. doi:10.1016/j.scitotenv.2018.07.062.
- Liyan, D., and L. Zhen. 2018. “Bilateral Political Relationship, Institutional Quality and China’s OFDI.” Economic Theory and Business Management V37 (11): 94–105.
- Luo, Y., W. Fang, and X. Chen. 2017. “Institutional Quality and How International Financial Institutions Affect the Performance of PPP Projects-A Study Based on “Belt and Road.” Journal of Financial Research (4): 61–77
- Mann, M. K., and P. L. Spath. 1997. Life Cycle Assessment of a Biomass Gasification Combined-Cycle Power System. TP-430-23076. Golden, CO: National Renewable Energy Laboratory.
- REN21. 2019. Renewables 2018 Global Status Report.
- Shu, Y., X. Qian, and T. Liu. 2019. “Belt and Road Initiative and Chinese Firms’ Outward Foreign Direct Investment1.” Emerging Markets Review (41): 1–22.
- Spath, P L, and D. R. Kerr. 1999. “Life Cycle Assessment of Coal-fired Power Production; TOPICAL.” Office of Scientific & Technical Information Technical Reports.
- Tian, X., Y. Geng, J. Sarkis, and S. Zhong. 2018. “Trends and Features of Embodied Flows Associated with International Trade Based on Bibliometric Analysis.” Resources, Conservation & Recycling 131: 148–157. doi:10.1016/j.resconrec.2018.01.002.
- Xiang, C., X. Che, B. Zhu, J. Zhao, and R. Xie. 2018. “Will Developing Countries Become Pollution Havens for Developed Countries? An Empirical Investigation in the Belt and Road.” Journal of Cleaner Production (198): 624–632.
- Xu, T., Y. Hu, H. Yin, Y. Geng, and R. Bleischwitz. 2019. “Trade Impacts of China’s Belt and Road Initiative: From Resource and Environmental Perspectives.” Resources, Conservation & Recycling (150): 104–430.
- Yan, W., and S. Qian. 2018. “Changes in the Basic Causes of China’s FDI in the Era of Post Financial Crisis.” China Circulation Economy 32 (286 (07)): 95–104.
- Yongchao, S., and L. Huayuan. 2019. “Research on the Influencing Factors of China’s Direct Investment in the Countries along the Belt and Road.” Journal of Zhengzhou University of Light Industry (Social Science Edition) 20 (4): 72–78.
- Zhang, N., Z. Liu, X. Zheng, and J. Xue. 2017. “Carbon Footprint of China’s Belt and Road.” Science 357: 1107. doi:10.1126/science.aao6621.
- Zhang, Y., J. Zhang, Q. Tian, Z. Liu, and H. Zhang. 2018. “Virtual Water Trade of Agricultural Products: A New Perspective to Explore the Belt and Road.” The Science of the Total Environment 622–623: 988–996. doi:10.1016/j.scitotenv.2017.11.351.
- International Energy Agency. 2019. https://www.iea.org/statistics/?country=POLAND&year=2016&category=Electricity&indicator=ElecGenByFuel&mode=table&dataTable=ELECTRICITYANDHEAT>
- Wikipedia. 2019. https://en.wikipedia.org/wiki/List_of_power_stations_in_Pakistan