
 ?Mathematical formulae have been encoded as MathML and are displayed in this HTML version using MathJax in order to improve their display. Uncheck the box to turn MathJax off. This feature requires Javascript. Click on a formula to zoom.
ABSTRACT
Instruction
The countries along the Belt and Road Initiative remain high exposure and vulnerability to climate extremes. Southeast Asia, a significant part of the Belt and Road Initiative, suffers a lot from flood disasters. This study assessed the flood disaster risk from 1990–2015 in all 11 Southeast Asian countries. A model integrating the coefficient of variation approach and the Technique for Order Preference by Similarity to Ideal Solution method was introduced to analyze the flood disaster data. Considering that populations living in areas where elevation is below 5 m and land area where elevation is below 5 m have reached 11.86% and 3.54% (2015), respectively, the two indicators were opted for to propose new metrics for flood disaster risk assessment.Outcomes: Our findings show that the flood disaster risk in Southeast Asia appeared very high during most of the study period. Indonesia had an extremely high flood disaster risk, followed by Vietnam, whereas Laos, Malaysia, Brunei, and Timor Leste had lower flood risks. The model introduced in this paper is quite simple and easy to understand, providing accessible flood risk information for decision makers.Conclusion: The results we obtained have practical implications for land use and investment activities in Southeast Asia.
Introduction
The Belt and Road Initiative (BRI) was originally unveiled as the Silk Road Economic Belt and the 21st-Century Maritime Silk Road by Chinese General Secretary Xi Jinping in 2013. It has involved 144 countries (including China) up to 2019 (compiled from https://www.yidaiyilu.gov.cn/index.htm). The initiative aims to tighten China’s cooperation with other countries, especially the developing countries along the route. The Southeast Asian subregion is a significant component of and plays an important role in the BRI. It is comprised of 11 countries: Brunei, Cambodia, Laos, Indonesia, Malaysia, Myanmar, the Philippines, Singapore, Thailand, Timor Leste, and Vietnam (). The bilateral investment between China and the BRI countries (2012–2017) comes to more than 96 billion USD, of which the bilateral investment between China’s and Southeast Asia’s economies is intended to achieve 87.85% of the total investment (). It can be seen that Southeast Asia has a large share of the BRI investment activities. Additionally, Mckinsey & Company reported that investors and multinationals are increasingly turning their gaze southward to the Association of Southeast Asian Nations, founded in 1967, which is comprised of 10 dynamic economies: Brunei, Cambodia, Indonesia, Laos, Malaysia, Myanmar, the Philippines, Singapore, Thailand, and Vietnam (Vinayak, Fraser, and Oliver Citation2014).
Figure 1. The map of Southeast Asia.
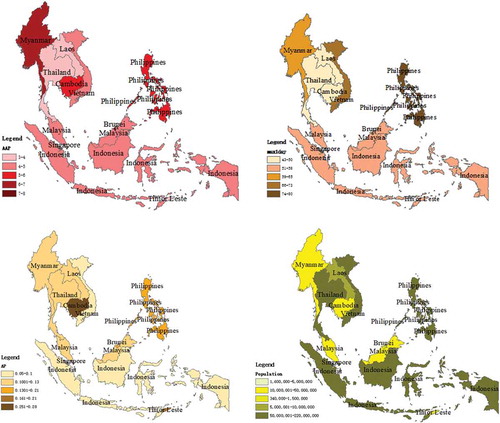
Figure 2. The bilateral investment between China and BRI countries vs Southeast Asia.
As one of the world’s fastest-growing markets and one of the least well known (Vinayak, Fraser, and Oliver Citation2014), the outlook for Southeast Asia’s economies is promising if investment can be smoothly carried out. However, Southeast Asia is highly prone to disasters (Lei et al. Citation2018). Although a few developed countries (such as Italy) are starting to sign a memorandum of understanding with China on the BRI, the majority of BRI countries are still less developed. Moreover, regarding climate change, Germanwatch has revealed less developed countries to be generally more affected than industrialized countries (David, Marie-Lena, and Maik Citation2018). Therefore, it is obvious that Southeast Asia is vulnerable to a wide range of disasters, given its high exposure to natural hazards coupled with its high socio-economic vulnerability (van der Keur et al. Citation2016). It will take a great toll on human beings and infrastructure and cause widespread destruction when the disasters occur. The disasters in Southeast Asia will greatly frustrate potential investors, and the participants who have invested will suffer huge losses.
Southeast Asia has already significantly suffered from disasters, especially floods (a type of disaster influenced by climate change). There are various and complex causes of floods in Southeast Asia, including typhoons, heavy rains, and tropical storms (Torti Jacqueline Citation2012). Data from the Emergency Events Database (EM-DAT) were applied to analyze the climate-related disasters.Footnote1 In this paper, climate-related disasters are defined as the sum of climatological disasters (drought, glacial lake outburst, wildfire), hydrological disasters (flood, landslide, wave action), and meteorological disasters (extreme temperature, fog, storm). The EM-DAT reports climate-related disasters to be the most severe type of hazard in Southeast Asia between 1990 and October 2019 (). Changing climate is expected to increase climate risk. As a kind of climate-related disaster, flood disaster accounts for 51.9% of total damage. The total damage caused by flood is 65 billion USD during 1900 and October 2019. Flooding is thus a severe issue that is currently affecting the Southeast Asian region.
Table 1. The disasters in Southeast Asia between 1900 and October 2019.
As to the severity of flood disasters, studies on flood risk assessment can be summarized into two aspects. On one hand, historical data about flood disaster are applied to analyze and explore the influence on society and nature. To establish a framework of indicators is a traditional and classical way to perform risk assessment, and the dimensions of hazards, exposure, and vulnerability are usually chosen to develop the framework of indicators (Koks et al. Citation2015; Liu et al. Citation2019a; Tian et al. Citation2019). In terms of the three dimensions (hazards, exposure, and vulnerability), Hoque et al. (Citation2019) attempted to change the three dimensions to fit in the specific empirical study, and 14 spatial criteria under dimensions of vulnerability and exposure, hazard, and mitigation capacity were used to quantify the degree of risk. Except for ranking flood risk, direct economic damage was also estimated by a damage model based on the Damagescanner model to calculate flood risk in terms of expected annual damage (Yus et al. Citation2015). A certain specific database was also chosen to assess flood risk. Luu, von Meding, and Mojtahedi (Citation2019) used the national disaster database in Vietnam to assess the flood risk on regional and provincial scales. On the other hand, climate scenarios are developed to obtain information in the future to examine the flooding impact. Quy Nhon city (Vietnam) was chosen to investigate the changing of urban flooding performances for the future 2050 and 2100, and the climate scenarios were established by following IPCC representative concentration pathways (RCP) (Vo Duc, Bhuiyan Muhammed, and Vo Ngoc Citation2020). The two ways of flooding risk assessment are both effective to provide information for disaster prevention and mitigation.
Multi-criteria decision-making (MCDM) is quite commonly used to perform an assessment in a quantitative way. It has been widely applied in various fields aiming to select the best observation or group the observations in descending or ascending order (Ren et al. Citation2013; Mulliner, Malys, and Maliene Citation2016; Mohsen, Maryam, and Mehdi Citation2016; Zolfani et al. Citation2018). MCDM is good at handling the quantitative and qualitative indicators simultaneously. In recent years, the MCDM method has become preferred in disaster assessment and management (Hoque et al. Citation2019; Luu, von Meding, and Mojtahedi Citation2019). It is comprised of fuzzy theory (He et al. Citation2011; Tian et al. Citation2019), neural network algorithms (Chen et al. Citation2019), information diffusion technique (Li et al. Citation2012; Hao, Yang, and Gao Citation2014; Liu et al. Citation2019b; Yu et al. Citation2020), Analytic Hierarchy Process (Liu et al. Citation2019a), multivariate statistical analysis (Xu et al. Citation2018), and other tools. Among these algorithms, Technique for Order Preference by Similarity to Ideal Solution (TOPSIS) is preferred in disaster assessment due to its simplicity and intelligibility. Moghadas et al. (Citation2019) performed the TOPSIS tool to assess urban flood resilience in Tehran, Iran. Wang and Liu (Citation2012) improved the TOPSIS method using the Kullback–Leibler distance to evaluate the vulnerability to urban flood disasters in Harbin City, China. The TOPSIS method was also combined with other theories to analyze and explore the flooding impact (Liu et al. Citation2018; Yang et al. Citation2018; Alireza et al. Citation2019; Mooselu et al. Citation2019; Goodarzi, Banihabib, and Roozbahani Citation2019; Khosravi et al. Citation2019).
No matter what specific MCDM method is chosen to assess, how to prioritize the criteria could be an extraordinarily significant point and the first step (Zou, Sun, and Ren Citation2005). It plays a fundamental role in the risk management decision-making process. From a structural viewpoint, the way of determining weights can be divided into subjective and objective methods (Tzeng, Chen, and Wang Citation1998). The subjective methods depend on group decision-making for measuring criteria values to get numerical relative weights. The brainstorming method, Delphi method, and Analytic Hierarchy Process (Saaty Thomas Citation1977) are famous subjective weight-assessing methods. In order to avoid subjective influence from decision maker’s personal bias, the objective way to select the weights through mathematical calculation by the objective method is preferred. The entropy method and coefficient of variation (CV) method are widely applied in prioritizing the criteria (Fandohan et al. Citation2015; Chen Citation2019; Xu and Dang Citation2019; Vavrek and Chovancova Citation2019; Zhang et al. Citation2019), and are preferred for their simplicity and objectivity. Men and Liang (Citation2005) applied CV method to determine the criteria of water quality avoid subjective bias, and found that reliable assessment results could be obtained with straightforward arithmetical operation. In addition, both subjective and objective weights were integrated to rank and evaluate criteria values (Wang and Lee Citation2009; Keshavarz Ghorabaee et al. Citation2018). It is a technique to combine the experience from decision maker and the information from the data.
To the best of our knowledge, major studies about flood disasters focus on the national or even provincial scale, and little attention has been given to the whole of Southeast Asia’s economies (spanning 11 countries). In this paper, the geographic locations of economies in Southeast Asia were taken into consideration, and the flood disaster risk indicators were formed based on the theory of disaster assessment. The model integrating the CV approach and the TOPSIS method was utilized to perform a quantitative assessment of the flood disaster risk for the 11 economies in Southeast Asia between 1990 and 2015. The distribution of flood disaster risks was visualized using GIS tool. The scope of the study area was vast, including the 11 countries in Southeast Asia. We tried to provide abundant information for decision makers on flood disaster prevention and mitigation, such as contingency plan, based on our assessment results of historical flood data. Moreover, it also could guide the investment activities in Southeast Asia, taking into consideration that this region is well positioned to attract multinational firms.
Methodology and data sources
Flood disaster risk indicators
Disaster assessment has been fully developed in academic circles. The framework of the disaster assessment model is widely accepted, and can be shown as (Zhang and Li Citation2007):
where R is risk; hazard is described as the trigger factor; exposure means the exposure of hazard-affected bodies, such as economic growth and population; and vulnerability is the degree to which the exposure is prone to hazard formations. Flood disaster, as a type of natural hazard and also a climate-related disaster, could also be presented as EquationEquation (1)(1)
(1) . In fact, some studies attempted to adjust the three dimensions to perform risk assessment as we stated in Introduction part (Hoque et al. Citation2019). In this paper, the framework was adopted (EquationEquation (1)
(1)
(1) ), and the indicators were selected based on the three dimensions. The framework includes the hazard dimension, the exposure dimension, and the vulnerability dimension.
The hazard dimension: the hazard in disaster risk represents the hazard trigger factor. It is expressed as three precipitation-related indicators because precipitation is the direct factor causing floods. The three precipitation-related indicators are average annual precipitation (AAP), maximum 1-day precipitation amount (max1day), and abnormal proportion (AP). The AAP can describe the meteorological element in the study area. The max1day reflects the strongest precipitation intensity in a day for a whole year. The degree of fluctuation from the AAP is depicted by the AP indicator.
The exposure dimension: exposure is used to describe the population and economic development when the flood occurs. It is shown as population, land area, and GDP in this paper.
The vulnerability dimension: not all the infrastructure, people, or land is vulnerable to flooding. Certain categories of people or land appear more vulnerable, such as children and farmland. In this way, we chose seven indicators to depict the vulnerability of the study area. Corresponding to the population indicator in the exposure dimension, populations aged 0–14 (ages 0–14), populations aged 65 and above (ages 65+), populations living in areas where the elevation is below 5 m(PLB5), and rural populations (RP) were selected to represent the vulnerable population. As for the land area indicator, land areas where the elevation is below 5 m (LAB5) and farmland (farmland) were chosen to depict the flood-prone land areas. It is notable that LAB5 was seldom selected in the previous studies when it came to assessing flood disasters in Southeast Asian countries. However, we have to pay attention to this indicator, due to a significant amount of people indeed living in areas where elevation is below 5 m. For the last indicator in the exposure dimension, the added GDP value of agriculture (AVA) was opted for. All in all, the vulnerable dimension includes ages 0–14, ages 65+, PLB5, RP, LAB5, farmland, and AVA. Here we need to explain the two indicators: PLB5, and LAB5. As is known to all, areas and people in lower elevation are much more vulnerable to flood hazards. Due to data availability, we chose the two indicators as measurement.
We had to make it clear that many other factors can be chosen as flood susceptibility factors. The reasons why we selected these factors in this paper can be attributed to data availability and the specific conditions in study area.
Coefficient of variation method
To obtain the weights of the indicators, it is necessary and significant to conduct a risk assessment, which obviously affects the assessment method application (Yalcin and Unlu Citation2018). In this paper, the CV method was chosen to obtain the weights of the indicators due to its simplicity and objectivity. The main steps of the CV method are summarized as follows:
where is the weight of the jth indicator;
is the CV value of the jth indicator;
with
and
are the standard deviation and average value of the jth indicator, respectively; and n is the number of the indicators.
The TOPSIS method
The TOPSIS method was first presented by Hwang and Yoon (Citation1981). These are the steps of the TOPSIS method (Hwang and Yoon Citation1981; Chen Citation2019):
Step 1: Establish the decision matrix , where
is the value of the jth observation in the ith indicator;
;
.
Step 2: Considering the different dimensions and magnitudes for the indicators, standardize the decision matrix X and transform it to the standardized matrix . The vector normalization used for calculating
can be depicted as:
Step 3: Calculate a weighted standardized decision matrix by multiplying the weights as follows:
where is the weight of the jth indicator based on the CV method (calculated by EquationEquation (1)
(1)
(1) ).
Step 4: Determine the positive ideal solution and negative ideal solution
. The
and
are ascertained based on the weighted standardized values and shown as:
where J is a set of benefit indicators and is a group of cost indicators.
Step 5: The Euclidean distance () between the observations and the positive ideal solution, and the distance (
) between the observations and the negative ideal solution, is calculated using EquationEquations (7)
(7)
(7) and (Equation8
(8)
(8) ).
Step 6: Calculate the relative closeness of each observation using the following equation:
The value of relative closeness, , describes the superiority of each observation. The observation with a larger value indicates better relative closeness, whereas a smaller value means poorer relative closeness.
Step 7: The observations can be sorted by descending or ascending order using .
Data sources
The indicators of AAP and max1day were obtained from the National Oceanic and Atmospheric Administration (NOAA) in the United States. The AP indicator was calculated based on the AAP, showing the anomalous degree of precipitation. The data of the exposure and vulnerability dimensions were taken from the World Bank. We strived to source and collect as much data as possible. However, due to the absence of data, our study spans the period from 1990–2015 for Brunei, Laos, Indonesia, Malaysia, the Philippines, Singapore, Thailand, and Vietnam; 1993–2015 for Cambodia; and 2000–2015 for Myanmar and Timor Leste.
GDP deflators were used to cope with the GDP values for the 11 countries in the study period, and 2010 was chosen as the base year. All the GDP values mentioned in this paper were handled using deflators with 2010 as the base year. The interpolation method was used to cope with PLB5 and LAB5. Each year for each country was considered one observation, generating a total of 263 observations.
Results and discussion
The CV-TOPSIS method was performed to assess the flood disaster risk from spatial and temporal characteristics. In the first part, each year for each economy was treated as one observation, and the 263 observations were investigated to obtain flood risk scores using CV-TOPSIS method. In this way, we have acquired 263 ranks for the observations. In other words, every economy for each year during the study period was classified. In the second part, average values every year processed as one observation was calculated to perform CV-TOPSIS method, and then the assessment results were obtained. In the two parts, every observation can be calculated to arrive at a numerical value (risk score). The higher the score, the more severe the flood disaster risk. The flood disaster risk was divided into five levels, and the measurement for each risk level is shown in .
Table 2. The measurement for flood risk level.
Analysis of indicators among different countries
The average values of every assessment indicator spanning the study period (Cambodia from 1993–2015; Myanmar and Timor Leste from 2000–2015; the others from 1990–2015) for Southeast Asia’s economies were calculated, and the results are visualized in risk maps using ArcGIS software in .
The first three figures: AAP, max1day, and AP belong to the indicators for the hazard dimension. Brunei ranks the highest (7.51 mm/day) in the AAP indicator, followed by Myanmar (6.8463 mm/day), whereas the AAP is the lowest in Timor Leste, with the value of 3.2819 mm/day. The max1day is the second indicator in the hazard dimension. In the study period, the highest value of the max1day indicators can be found in the Philippines (79.5208 mm/day), closely followed by Singapore (79.3377 mm/day), whereas the max1day in Laos is the lowest, at 43.0981 mm/day. Cambodia (0.2758 mm/day) grades the highest, with Vietnam (0.0697 mm/day) as the lowest, for the AP indicator.
The indicators for the exposure dimension are depicted in figures Population, Land area, and GDP. Indonesia ranks the highest in all three indicators (population, land area, and GDP). Brunei is the lowest in terms of population and land area, and Timor Leste is the lowest-GDP country.
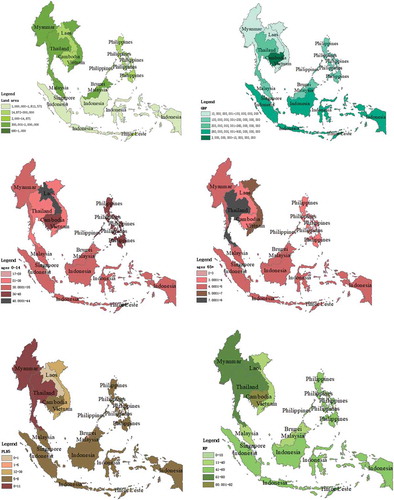
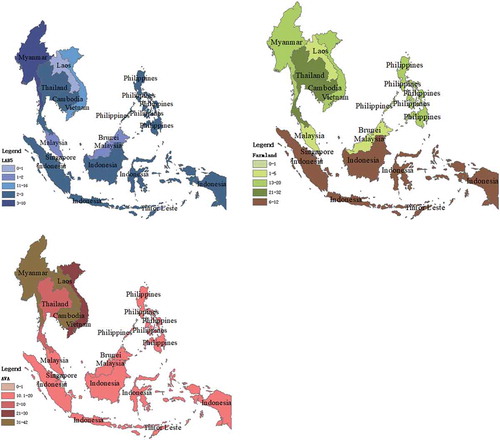
The other figures: ages 0–14, ages 65+, PLB5, RP, LAB5, Farmland, and AVA show the characteristics of the vulnerable dimension. Brunei is classified as the lowest in the indicators of ages 65+ (2.9452%) and farmland (0.5182%), and Thailand and Cambodia are the highest in these two indicators, with ages 65+ at 7.2354% in Thailand and farmland at 21.1125% in Cambodia. Laos is completely landlocked. No one lives in areas where elevation is below 5 m (PLB5 is 0), and no land is located where elevation is below 5 m (LAB5 is 0). However, the RP indicator is the highest, with the value of 75.8495% among all the economies. Myanmar has the highest AVA values (41.5006%), whereas Singapore ranks the lowest in ages 0–14 (17.568%), RP (0), and AVA (0.0986%). Youngsters account for the biggest proportion in Timor Leste, with the value of 43.1387% (ages 0–14). Vietnam is the highest in PLB5 and LAB5 indicators, which are both related to elevation below 5 m. The values of PLB5 and LAB5 are 37.0225% and 15.4058%, respectively, indicating that Vietnam is easily influenced by flood disasters, especially coastal flood disasters.
Figure 3. Spatial distribution of indicators among different countries.
Analysis of the flood disaster risks for the economies in the study area
Weights calibrated using the CV method
The weights of the risk indicators were performed using the CV method. The weights of the indicators and dimensions are shown in . In terms of the 13 indicators, the GDP weight reached the highest, with a value of 0.1568, which means GDP is a significant factor in the whole indicator system. GDP is followed by the indicators of land area and population, whose weights are 0.1167 and 0.1157, respectively. The bigger the weight ranks, the more important the indicator is. When it comes to the risk assessment, a high weight indicates a severe risk. The indicators of population, land area, and GDP are classified in the exposure dimension. As to the weight of the three dimensions, the vulnerability dimension accounts for the highest weight (0.4587), followed by the exposure dimension (0.3892). In view of the number of indicators in every dimension, the exposure dimension tends to be much more important than the vulnerability dimension. With a view to the hazard dimension, the three indicators (AAP, Max1day, and AP) only have a total weight of 0.1521.
Table 3. The weights of flood risk indicators using CV.
Analysis of the time-varying characteristics of the study area
The TOPSIS method was performed to assess the flood disaster risk in the study area during the study period based on the weights calculated using the CV approach, and the measurement of the risk level is described in . In total, the time distribution of the 11 economies can be classified into three groups.
Group 1: generally speaking, the risk levels appeared heightened in Brunei, Cambodia, Malaysia, the Philippines, Singapore, and Thailand
Brunei is a small country in Southeast Asia with the second-smallest land area and the smallest population (average value during the study period). The risk levels for most of the study years were extremely low. The reason could be put down to low exposure and vulnerability, which were prioritized important in weight determination. However, it was ranked at a medium level in 2015. From the data we obtained from the NOAA, the AAP, max1day, and AP in recent years appear abnormal. The max1day indicator in 2015 was the highest during the study period and in the study area, with the value of 346.15 mm/day. Moreover, it received a moderately high AP value in 2015, demonstrating abnormal precipitation in 2015. The abnormal precipitation can be ascribed to climate change, which frequently results in extreme weather.
Although Cambodia, the Philippines, Thailand, and Singapore appeared to have medium flood disaster risk levels and Malaysia had a low risk level, the risk scores slowly rose during the study period. Singapore is the only developed country in Southeast Asia. There is no rural population in Singapore, and it also had the lowest ages 0–14 (17.568%) and AVA (0.0986%) results. Singapore’s economic prosperity enables it to perform better in disaster prevention and reduction. Even so, Singapore obtained increasingly higher scores from 1990–2015. This could be attributed to having higher exposure than before. The reason its rank stayed stable but the risk score trended upward can be attributed to the division of risk levels (). The level we applied in this section is subjectively divided. However, we could still determine a clear rising trend from the risk scores.
Group 2: Laos, Indonesia, Myanmar, and Timor Leste trended slightly downward in flood risks during the study period. However, the risk levels to the four economies were stable
Laos is the only landlocked country in Southeast Asia and showed a slightly downward risk trend. The risk score ranged from 0.1 to 0.15 for the majority of the 26 years. We should note that the risk ranked extremely low from 2009–2013, and almost ranked low in many other years. We attribute this to the risk level we set. Actually, the risk score from 2009–2013 stayed stable, ranging from 0.0821 to 0.098, which is quite close to the low level (0.1001–0.15).
As for Indonesia, the risk scores were extraordinarily higher than those of other countries, spanning from 0.3745 to 0.6327. GDP is the factor that explains why the risk level dropped from 1998–2009 (the risk ranked high, whereas it ranked the highest in other years). GDP was handled using a deflator with 2010 as the base year, based on the data we obtained from the World Bank. It is clear that GDP in Indonesia experienced a sharp drop in 1998, as it was only a quarter of that in 1997. This can be attributed to the financial crisis. The exposed GDP that steeply dropped resulted in a downward-trending risk level. We should note that the GDP in exposure dimension was assigned the biggest weight in all the variables. The above two reasons caused the change of flood disaster risk. With economic growth, urbanization, and population expansion, the risk increased to extremely high in 2010.
The data we collected only cover 2000–2015 for Myanmar and Timor Leste. The risks for Myanmar during the 16 years were all within the medium level. The risk scores appeared to trend very slightly downward from 0.22 to 0.2, which are classified as medium risk levels. There were two years displaying different characteristics from other years (the risks in 2002 and 2011 were graded at a medium level) in Timor Leste. The reasons can be discovered from the data we obtained from the NOAA. Although other indicators showed stable distributions in 2002 and 2011, the AP indicator in the hazard dimension was highly abnormal. The AP value in 2011 was the highest (0.688), followed by that in 2002 (0.3632). The AP indicator manifests the fluctuation degree to the average precipitation, and the precipitation is the direct trigger factor of flood disasters.
Group 3: the flood disaster risk levels in Vietnam remained high (smooth and stable)
The flood risk scores from 1990–2015 in Vietnam fluctuated from 0.31 to 0.34, which is classified as a high risk level. According to the results in Section 3.1, the PLB5 and LAB5 indicators in vulnerability dimension had the biggest values in Vietnam. Meanwhile, it is presented in Section 3.2.1 that the weights of PLB5 and LAB5 are 0.1034 and 0.1079, respectively, which is quite close to the weights of the first three indicators. However, the values of the exposure dimension (population, land area, and GDP) stay medium within the 11 countries. The values of population, land area, and GDP rank third, fifth, and sixth among the economies, and the weights of the three indicators amount to 0.3892. In addition, some indicator values (such as ages 0–14, RP, and AVA) went downward, whereas a few indicator values (such as population and GDP) appeared to rise during the study period. Therefore, the flood disaster risk in Vietnam showed stable but high characteristics from 1990–2015.
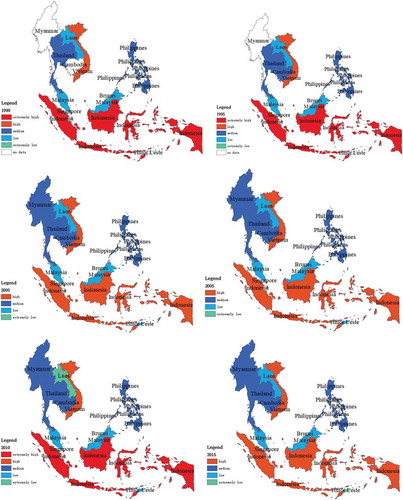
Analysis of the spatial distribution characteristics of the study area
The spatial distribution characteristics of flood disaster risks in Southeast Asia are shown in six random years (). From the characteristics displayed in most of the study years, five groups can be determined. Indonesia has an extremely high flood disaster risk, followed by Vietnam (high flood disaster risk); Cambodia, Myanmar, the Philippines, Singapore, and Thailand are divided into the medium risk level; Laos and Malaysia are classified as having low flood risks; and Brunei and Timor Leste are considered to have extremely low flood risks.
This can be interpreted in two ways. On the one hand, the three indicators (population, land area, and GDP) in the exposure dimension are highly significant in the assessment procedure. The countries with larger values for the three indicators are easily ranked higher. We should note that GDP is a special indicator. It is not only an exposure indicator for flooding; it also indicates the ability to prevent and reduce flood disasters. On the other hand, two indicators, PLB5 and LAB5, result in high flood disaster risks in Vietnam due to the high weights of the two indicators and the particular location of Vietnam.
Figure 4. The risk map of the study area during the random years.
Analysis of the total risk distribution for Southeast Asia
Based on the weights generated using the CV method, the TOPSIS method was employed to assess the total flood disaster risks for Southeast Asia from 1990–2015. Every observation was calculated using the average values in the study period. The results show extremely high flood risks in Southeast Asia at various times. There were extremely high flood risks during 15 years in Southeast Asia (out of 26 years in total), almost all from 1990–1997 and 2010–2015. This was the result of the Asian financial crisis. The average GDP value in 1998 was only 41% of that in 1997, and the average population in 1998 also trended downward. In terms of analyzing the total risk distribution, GDP accounts for the biggest weight among all the variables. GDP plays a significant role in the analysis of the total risk distribution with the big weight for GDP. The changing flood risk could be attributed to the plunged GDP in 1998 and the big weight. Southeast Asia went through the road to recovery. Until 2010, the average population reached a slightly higher level than in 1997, but the average GDP value was still lower than in 1997.
Conclusion
With high population densities, growing economies, and developing urban areas and industrial sectors, the exposure to flood disasters in Southeast Asia will definitely increase. Therefore, it is urgent and essential to undertake a temporal and spatial flood risk assessment to provide practical information and support effective flood disaster prevention and reduction. In addition, the assessment results could also guide investment activities in Southeast Asia due to the increasing attraction to investors. To the best of our knowledge, this is the first application of the CV-TOPSIS method to assess Southeast Asian economies on a national scale from both temporal and spatial perspectives.
From the viewpoint of the disaster system, the dimensions of hazard, exposure, and vulnerability were extended to structure the indicators. We chose the two indicators due to a significant proportion of the population living in areas where elevation is below 5 m and land area where elevation is below 5 m. Subsequently, our study provides an easy and practical approach combining the CV and TOPSIS methods and a GIS framework to measure the severity of past events over the course of 23 years for Cambodia, 16 years for Brunei and Timor Leste, and 26 years for the other countries in Southeast Asia. The TOPSIS method, an extensively applied algorithm in a growing number of studies, could offer risk scores for all the observations. The CV-TOPSIS method analyzed and ranked the flood disaster risks for the 11 economies, the time-varying characteristics were expressed in detail, and spatial distributions were visualized by risk maps. The study contributes a framework for flood disaster risk assessment on a national scale, turning the indicators into useful information for better flood risk prevention and reduction. It also provides accessible risk information for decision makers to identify the risks around the study area and then perform better risk management. The results we obtained could guide the investment and land-use activities in Southeast Asia as well as support the mitigation and adaptation strategies. Moreover, the CV-TOPSIS method, a simple and pragmatic algorithm, could diversify the MCDM approach in flood disaster risk assessment and management, and it can be utilized to measure the flood disaster risk in other study periods on regional, provincial, or national scales. Assessment results show the flood disaster risks in the whole of Southeast Asia being classified as extremely high from 1990–1997 and 2010–2015. The variation from 1998–2009 can be inferred as the influence of the Asian financial crisis. We also figured out the time-varying characteristics and spatial distribution for the flood disaster risks in the study area. The economies are sorted into three groups: the risk scores for Cambodia, Malaysia, the Philippines, Singapore, and Thailand rose during the study period; the risks for Laos, Indonesia, Myanmar, and Timor Leste stayed stable; and Vietnam had high risk levels throughout the study period. In view of spatial characteristics, Indonesia appeared to have the highest risk level, followed by Vietnam; the risks were ranked as medium in Cambodia, Myanmar, the Philippines, Singapore, and Thailand; low risks were found in Laos and Malaysia; and Brunei and Timor Leste had the lowest risks.
We must make it clear that there are still some limitations in this paper. Although we structured the indicators from the perspective of the disaster system (hazard, exposure, and vulnerability), selecting the specific indicators was still subjective. In addition, we established a framework based on the traditional disaster assessment in an attempt to match criteria in vulnerability dimension with ones in exposure dimension. Therefore, the correlation of the indicators in this paper was not considered in order to accomplish the match work. What’s more, we need to state the parameterization for Laos with nobody living and no land locating in areas where the elevation is below 5 m. We have taken the long coastline into account in the study area. However, we must admit Laos as a landlocked country still exposes to inland flood risk. That was not considered in our paper but we will explore it in our future study. At last, the resilience and recovery capacity of the research target also impact the flood risk. Perhaps we will try to make comparisons between the three dimensions and the four dimensions in the future.
Additional information
Funding
Notes
1 Some strict criteria in the EM-DAT were used to determine a disaster: 10 or more people were killed; 100 or more people were affected, injured, or left homeless; significant damage was incurred; and a declaration of a state of emergency and/or a call for international assistance was made (Zhou et al. Citation2014).
References
- Alireza, A., R. Khalil, C. Artemi, C. Christian, and K. Zahra. 2019. “A Comparison of Statistical Methods and Multi-criteria Decision Making to Map Flood Hazard Susceptibility in Northern Iran[J].” Science of the Total Environment 660: 443–12. doi:10.1016/j.scitotenv.2019.01.021.
- Chen, N., L. Chen, Y. Ma, and A. Chen. 2019. “Regional Disaster Risk Assessment of China Based on Self-organizing Map: Clustering, Visualization and ranking[J].” International Journal of Disaster Risk Reduction 33: 196–206. doi:10.1016/j.ijdrr.2018.10.005.
- Chen, P. 2019. “Effects of Normalization on the Entropy-based TOPSIS method[J].” Expert Systems with Applications 136: 33–41. doi:10.1016/j.eswa.2019.06.035.
- David, E., H. Marie-Lena, and W. Maik. 2018. Global Climate Risk Index 2019: Who Suffers Most from Extreme Weather Events? Weather-related Loss Events in 2017 and 1998 to 2017[R]. Berlin: Germanwatch. e.V.
- Fandohan, A. B., A. M. O. Oduor, A. I. Sode, L. Wu, A. Cuni-Sanchez, E. Assede, and G. N. Gouwakinnou. 2015. “Modeling Vulnerability of Protected Areas to Invasion by Chromolaena Odorata under Current and Future climates[J].” Ecosystem Health and Sustainability 1 (6): 1–12. doi:10.1890/EHS15-0003.1.
- Goodarzi, L., M. E. Banihabib, and A. Roozbahani. 2019. “A Decision-making Model for Flood Warning System Based on Ensemble forecasts[J].” Journal of Hydrology 573: 207–219. doi:10.1016/j.jhydrol.2019.03.040.
- Hao, L., L.-Z. Yang, and J.-M. Gao. 2014. “The Application of Information Diffusion Technique in Probabilistic Analysis to Grassland Biological Disasters risk[J].” Ecological Modelling 272: 264–270. doi:10.1016/j.ecolmodel.2013.10.014.
- He, Y., J. Zhou, P. Kou, N. Lu, and Q. Zou. 2011. “A Fuzzy Clustering Iterative Model Using Chaotic Differential Evolution Algorithm for Evaluating Flood disaster[J].” Expert Systems with Applications 38 (8): 10060–10065. doi:10.1016/j.eswa.2011.02.003.
- Hoque, M. A.-A., B. Pradhan, N. Ahmed, and S. Roy. 2019. “Tropical Cyclone Risk Assessment Using Geospatial Techniques for the Eastern Coastal Region of Bangladesh[J].” Science of the Total Environment 692: 10–22. doi:10.1016/j.scitotenv.2019.07.132.
- Hwang, C. L., and K. P. Yoon. 1981. Multiple Attribute Decision Making: Methods and applications[M]. New York: Springer-Verlag.
- Keshavarz Ghorabaee, M., M. Amiri, K. Zavadskas Edmundas, and J. Antucheviciene. 2018. “A New Hybrid Fuzzy MCDM Approach for Evaluation of Construction Equipment with Sustainability considerations[J].” Archives of Civil and Mechanical Engineering 18 (1): 32–49. doi:10.1016/j.acme.2017.04.011.
- Khosravi, K., H. Shahabi, B. T. Pham, J. Adamowski, A. Shirzadi, B. Pradhan, J. Dou, et al. 2019. “A Comparative Assessment of Flood Susceptibility Modeling Using Multi-Criteria Decision-Making Analysis and Machine Learning Methods[J].” Journal of Hydrology 573: 311–323. doi:10.1016/j.jhydrol.2019.03.073.
- Koks, E. E., B. Jongman, T. G. Husby, and W. J. W. Botzen. 2015. “Combining Hazard, Exposure and Social Vulnerability to Provide Lessons for Flood Risk management[J].” Environmental Science & Policy 47: 42–52. doi:10.1016/j.envsci.2014.10.013.
- Lei, Y., P. Cui, D. R. Amar, M. Virginia, P. Alessandro, T. Giacomo, S. Muhammad, and D. G. Tilak Priyadarshana. 2018. “An International Program on Silk Road Disaster Risk Reduction – A Belt and Road Initiative (2016-2020)[J].” Journal of Mountain Science 15 (7): 1383–1396. doi:10.1007/s11629-018-4842-4.
- Li, Q., J. Zhou, D. Liu, and X. Jiang. 2012. “Research on Flood Risk Analysis and Evaluation Method Based on Variable Fuzzy Sets and Information diffusion[J].” Safety Science 50 (5): 1275–1283. doi:10.1016/j.ssci.2012.01.007.
- Liu, C., S. Shu, Z. Qiang, and X. Huaming. 2018. “Flood Resilience Assessment in Hunan Province Based on GIS and TOPSIS-PSR[J].” Water Resources and Power 36: 70–73.
- Liu, Q., H. Yang, M. Liu, R. Sun, and J. Zhang. 2019a. “An Integrated Flood Risk Assessment Model for Cities Located in the Transitional Zone between Taihang Mountains and North China Plain: A Case Study in Shijiazhuang, Hebei, China[J].” Atmosphere 10:104. doi:10.3390/atmos10030104.
- Liu, Y., M. You, J. Zhu, F. Wang, and R. Ran. 2019b. “Integrated Risk Assessment for Agricultural Drought and Flood Disasters Based on Entropy Information Diffusion Theory in the Middle and Lower Reaches of the Yangtze River, China[J].” International Journal of Disaster Risk Reduction 38: 101194. doi:10.1016/j.ijdrr.2019.101194.
- Luu, C., J. von Meding, and M. Mojtahedi. 2019. “Analyzing Vietnam’s National Disaster Loss Database for Flood Risk Assessment Using Multiple Linear regression-TOPSIS[J].” International Journal of Disaster Risk Reduction 40: 101153. doi:10.1016/j.ijdrr.2019.101153.
- Men, B., and C. Liang. 2005. “Attribute Recognition Model-based Variation Coefficient Weight for Evaluating Water quality[J].” Journal of Harbin Institute of Technology 37 (10): 1373–1375.
- Moghadas, M., A. Asadzadeh, A. Vafeidis, A. Fekete, and T. Koetter. 2019. “A Multi-criteria Approach for Assessing Urban Flood Resilience in Tehran, Iran[J].” International Journal of Disaster Risk Reduction 35: 101069. doi:10.1016/j.ijdrr.2019.101069.
- Mohsen, V., D. Maryam, and A. Mehdi. 2016. “A Novel Hybrid MCDM Model for Performance Evaluation of Research and Technology Organizations Based on BSC approach[J].” Evaluation and Program Planning 58: 125–140. doi:10.1016/j.evalprogplan.2016.06.005.
- Mooselu, M. G., M. R. Nikoo, N. B. Rayani, and A. Izady. 2019. “Fuzzy Multi-objective Simulation-optimization of Stepped Spillways considering Flood uncertainty[J].” Water Resources Management 33 (7): 2261–2275. doi:10.1007/s11269-019-02263-2.
- Mulliner, E., N. Malys, and V. Maliene. 2016. “Comparative Analysis of MCDM Methods for the Assessment of Sustainable Housing affordability[J].” Omega 59: 146–156. doi:10.1016/j.omega.2015.05.013.
- Ren, J., A. Fedele, M. Mason, A. Manzardo, and A. Scipioni. 2013. “Fuzzy Multi-actor Multi-criteria Decision Making for Sustainability Assessment of Biomass-based Technologies for Hydrogen production[J].” International Journal of Hydrogen Energy 38: 9111–9120. doi:10.1016/j.ijhydene.2013.05.074.
- Saaty Thomas, L. 1977. “A Scaling Method for Priorities in Hierarchical structures[J].” Journal of Mathematical Psychology 15 (3): 234–281. doi:10.1016/0022-2496(77)90033-5.
- Tian, C., L. Xinyu, D. Xiang, W. Jia, and Z. Jian. 2019. “Flood Risk Assessment Based on Hydrodynamic Model and Fuzzy Comprehensive Evaluation with GIS technique[J].” International Journal of Disaster of Risk Reduction 35: 101077. doi:10.1016/j.ijdrr.2019.101077.
- Torti Jacqueline, M. I. 2012. “Floods in Southeast Asia: A Health priority[J].” Journal of Global Health 2 (2): 020304. doi:10.7189/jogh.02.020304.
- Tzeng, G.-H., T.-Y. Chen, and J.-C. Wang. 1998. “A Weight-assessing Method with Habitual domains[J].” European Journal of Operational Research 10 (2): 342–367. doi:10.1016/S0377-2217(97)00246-4.
- van der Keur, P., C. van Bers, H. J. Henriksen, H. K. Nibanupudi, S. Yadav, R. Wijaya, A. Subiyono, et al. 2016. “Identification and Analysis of Uncertainty in Disaster Risk Reduction and Climate Change Adaptation in South and Southeast Asia[J].” International Journal of Disaster Risk Reduction 16: 208–214. doi:10.1016/j.ijdrr.2016.03.002.
- Vavrek, R., and J. Chovancova. 2019. “Assessment of Economic and Environmental Energy Performance of EU Countries Using CV-TOPSIS technique[J].” Ecological Indicators 106: 105519. doi:10.1016/j.ecolind.2019.105519.
- Vinayak, H. V., T. Fraser, and T. Oliver. 2014. Understanding ASEAN: Seven Things You Need to know[R]. Singapore: McKinsey's office.
- Vo Duc, P., A. Bhuiyan Muhammed, and D. Vo Ngoc. 2020. “Climate Change Impact on Urban Flooding in Quynhon City, Vietnam[C].” In CIGOS 2020, Innovation for Sustainable Infrastructure. Lecture Notes in Civil Engineering, edited by C. Ha-Minh, D. Dao, F. Benboudjema, S. Derrible, D. Huynh, and A. Tang, Vol. 54, 1025-1030. Singapore: Springer.
- Wang, S., and J. Liu. 2012. “Multi-attribute Dynamic Evaluation of Urban Flood Disaster vulnerability[J].” Advances in Water Science 23 (3): 334–340.
- Wang, T.-C., and H.-D. Lee. 2009. “Developing a Fuzzy TOPSIS Approach Based on Subjective Weights and Objective weights[J].” Expert Systems with Applications 36 (5): 8980–8985. doi:10.1016/j.eswa.2008.11.035.
- Xu, H., C. Ma, J. Lian, K. Xu, and E. Chaima. 2018. “Urban Flooding Risk Assessment Based on an Integrated K-means Cluster Algorithm and Improved Entropy Weight Method in the Region of Haikou, China[J].” Journal of Hydrology 563: 975–986. doi:10.1016/j.jhydrol.2018.06.060.
- Xu, J., and C. Dang. 2019. “A Novel Fractional Moments-based Maximum Entropy Method for High-dimensional Reliability analysis[J].” Applied Mathematical Modelling 75: 749–768. doi:10.1016/j.apm.2019.06.037.
- Yalcin, N., and U. Unlu. 2018. “A Multi-criteria Performance Analysis of Initial Public Offering (IPO) Firms Using Critic and Vikor methods[J].” Technological and Economic Development of Economy 24 (2): 534–560. doi:10.3846/20294913.2016.1213201.
- Yang, W., K. Xu, J. Lian, C. Ma, and L. Bin. 2018. “Integrated Flood Vulnerability Assessment Approach Based on TOPSIS and Shannon Entropy methods[J].” Ecological Indicators 89: 269–280. doi:10.1016/j.ecolind.2018.02.015.
- Yu, X., X. Yu, C. Li, and Z. Ji. 2020. “Information Diffusion-based Risk Assessment of Natural Disasters along the Silk Road Economic Belt in China[J].” Journal of Cleaner Production 244: 118744. doi:10.1016/j.jclepro.2019.118744.
- Yus, B., A. Jeroen, B. JanJaap, M. M. Aris, and W. Philip. 2015. “Flood Risk Assessment for Delta Mega-cities: A Case Study of Jakarta[J].” Natural Hazards 75 (1): 389–413. doi:10.1007/s11069-014-1327-9.
- Zhang, J., and N. Li. 2007. Quantitative Methods and Applications of Risk Assessment and Management on Main Meteorological disasters[M]. Beijing: Beijing Normal University Press.
- Zhang, Q., Z. Zhang, X. Jin, W. Zeng, S. Lou, X. Jiang, and Z. Zhang. 2019. “Entropy-based Method for Evaluating Spatial Distribution of Form Errors for Precision assembly[J].” Precision Engineering-Journal of the International Societies for Precision Engineering and Nanotechnology 60: 374–382. doi:10.1016/j.precisioneng.2019.07.020.
- Zhou, Y., N. Li, W. Wu, H. Liu, L. Wang, G. Liu, and J. Wu. 2014. “Socioeconomic Development and the Impact of Natural Disasters: Some Empirical Evidences from China[J].” Natural Hazards 74 (2): 541–554. doi:10.1007/s11069-014-1198-0.
- Zolfani, S. H., M. Pourhossein, M. Yazdani, and E. K. Zavadskas. 2018. “Evaluating Construction Projects of Hotels Based on Environmental Sustainability with MCDM framework[J].” Alexandria Engineering Journal 57 (1): 357–365. doi:10.1016/j.aej.2016.11.002.
- Zou, Z., J. Sun, and G. Ren. 2005. “Study and Application on the Entropy Method for Determination of Weight of Evaluating Indicators in Fuzzy Synthetic Evaluation for Water Quality assessment[J].” Acta Scientiae Circumstantize 25 (4): 552–556.