
 ?Mathematical formulae have been encoded as MathML and are displayed in this HTML version using MathJax in order to improve their display. Uncheck the box to turn MathJax off. This feature requires Javascript. Click on a formula to zoom.
ABSTRACT
Rural settlements serve as an important part of the rural landscape, and environmental conditions influence their spatial distribution. We hypothesize that there are variations in the spatial patterns of settlements across different farming–pastoral ecotones that exist in accordance with different human activities and environmental conditions. We used remote sensing imagery, digital elevation model, and GIS technology to analyze and compare the spatial patterns of settlements and factors influencing these patterns across pastoral, agricultural, and ecotone areas in Inner Mongolia, China. A Voronoi model, adjacency analysis, landscape metrics, and quantitative analysis were conducted. The results indicated that (1) the settlements in the three areas tended to have a random spatial distribution, and although there were no significant differences between the settlement types, agricultural settlements tended to be clustered and pastoral settlements tended to be evenly distributed; (2) the pastoral area had only a few large and sparsely fragmented patches; (3) the factors influencing settlement distribution mainly differed with respect to the NDVI, distance to roads and rivers, and elevation across three areas, but the slope degree was similar. These results indicated there are no significant differences between the spatial patterns of settlements along the agricultural to pastoral gradient, although environmental conditions differ. Consequently, we can optimize the spatial pattern of settlements and achieve sustainable development within farming–pastoral ecotones.
Introduction
Human settlements can be defined as places where populations are concentrated and where people live and earn a livelihood (Ma, Guo, and Zhang Citation2012; Yu et al. Citation2015). The surrounding environmental conditions of a human settlement are extremely important and determine the directional development of the settlement and its associated economy (Ma, Guo, and Zhang Citation2012; Yu et al. Citation2015; Yang, Zhao, and Zhao Citation2018). Therefore, it can be considered that the spatial distribution characteristics of human settlements within a region reflect the regional environmental conditions and have a direct relationship with their socio-economic development and historical background (Ellis and Ramankutty Citation2008; Reinmann et al. Citation2016), and this occurs mostly in relation to the interaction between humans and the natural environment (Xu, Pu, and Zhang Citation2014). Several studies focusing on settlements have been conducted globally which mostly focused on the historical evolution of settlements (Zhou et al. Citation2013), informal settlements (Zhang et al. Citation2014), the dynamics (Long et al. Citation2009) and processes relating to settlement expansion (Xu, Pu, and Zhang Citation2014), and the resulting ecological effects (Reinmann et al. Citation2016). However, few studies have investigated the spatial patterns of human settlements across various land use types. Variations in land use in relation to the most suitable local ecological conditions result in differences between the spatial distribution patterns of the various land use types and ultimately optimized spatial patterns (Chen and Ye Citation2014). Human settlements in rural areas are functional indicators of available natural resources, natural geography, and the ecological carrying capacity of an area, and it is known that most cities form a cluster type spatial settlement pattern (Clark et al. Citation2009).
By making a comparison between farmland and pastoral regions, the spatial distribution of human settlements can be identified, and such information acts as a useful reference for the planning and management of settlements. A farming–pastoral ecotone occurs at the interface between farmland and pasture, and it includes both types of land use. This ecotone is believed to be one of the most ecologically sensitive regions currently responding to global changes and human disturbances (Peng et al. Citation2016), and this makes ecotone an ideal place to study the spatial distribution of settlements. We hypothesize that the spatial patterns of settlements will vary across farming–pastoral ecotones because human activities and environmental conditions differ in different regions. To test this hypothesis, we conducted a comparative analysis of the characteristics of the spatial distribution of human settlements in the farming–pastoral ecotone in Inner Mongolia, China.
Study area and methods
Study area
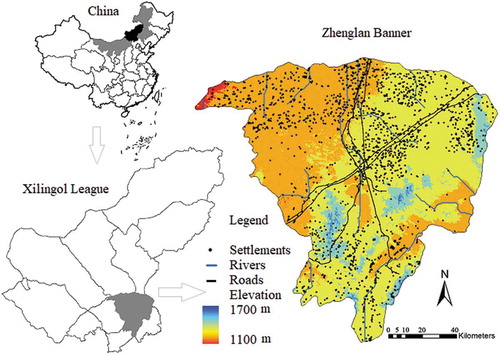
This study was conducted in the farmland–pastoral ecotone of Zhenglan Banner 41°46′–43°69′N, 114°55′–116°38′E), Xilingol League, Inner Mongolia, in northern China (). The prevailing temperate semi-arid climate has an annual mean temperature of 1.7°C and diurnal minimum and maximum monthly temperatures of −18.3°C and 18.7°C, respectively. The land temperature data (annual average temperature of 2015) used in this study are at a 1000 m resolution and were acquired from the Data Center for Resources and Environmental Sciences, Chinese Academy of Sciences) (http://www.resdc.cn). Zhenglan Banner receives 250–350 mm of precipitation annually, 80–90% of which falls between May and September. Zhenglan Banner consists of eight towns and has a population of 87,000 people. The main income of local people comes from agricultural products and livestock resources.
Data sources
Well-classified landscape data for Inner Mongolia in 2015 were provided by the Data Center for Resources and Environmental Sciences, Chinese Academy of Sciences (http://www.resdc.cn). Nine land use categories are included in this dataset at 30 m resolution: forest, shrubland, grassland, dry cropland, wet cropland, water, bare lands, urbanized areas, and desert. The human settlement data were extracted from Google Earth software in 2015; these data were then verified and classified using an officially published Zhenglan Banner Map.
Figure 1. Location of the study area: vicinity maps show the locations of (a) Xilingol League within China and (b) Zhenglan Banner within Xilingol, and (c) shows the spatial distribution of settlements within Zhenglan Banner.
Voronoi method
The Voronoi method is a quantitative and objective method used to characterize fixation density, and it is also a useful tool for analyzing spatial distribution patterns. A Voronoi diagram divides an area into cells that are associated with particular points within that area, where a cell is defined as the area comprising points that are closer to one particular point than to any other (Okabe et al. Citation2000). In this study, the points represented settlement locations. The distribution of the distances between locations and polygon edges were then correlated with the spatial distribution of settlements, and settlements were determined as being either clustered, random, or even. We calculated Cv for the Voronoi diagram, where Cv equals the standard deviation of the distances divided by the mean distance. As suggested by Duyckaerts and Godefroy (Citation2000), when Cv < 0.33, the spatial pattern has an even distribution, when 0.33< Cv < 0.64 the distribution is random, and when Cv > 0.64 the distribution is clustered.
Nearest neighbor analysis
A nearest neighbor analysis was conducted to confirm the spatial distribution pattern of human settlements in the farming–pastoral ecotone. The nearest neighbor index (NNI) uses the distance to the nearest neighbor as a measure of spatial structures. The mean of the distances to the nearest neighbor was set into a theoretically expected mean distance using EquationEq. (1)(1)
(1) as follows:
where d(NN) is the observed mean nearest neighbor distance and d(ran) is calculated using EquationEq. (2)(2)
(2) :
where n is the number of settlements, and A is the sample plot area. NNI ranges from 0 to 2.1491, where NNI values around 1 indicate a random distribution, NNI < 1 can be interpreted as clustered, and NNI > 1 indicates an even pattern (Clark and Evans Citation1954).
In addition, the significance of departure from randomness was tested (Clark and Evans Citation1954), and the differences between NNI values for settlement centers were tested using a one-sided z test. As was same for all settlements, we tested for differences between the observed nearest neighbor distances (Longuetaud et al. Citation2008), and calculations were made using the ArcSript “Nearest Neighbor Analysis” (Sawada Citation2002) in ArcGIS 10.2,
Only when z > 1.96 or z <−1.96 does the spatial pattern reach statistical significance at P < 0.05 (Yu et al. Citation2016).
Differences between landscape metrics
We used landscape metrics to indicate the spatial pattern of human settlements along the farming–pastoral gradient and quantified landscape pattern indices using a suite of landscape metrics in FRAGSTATS software (McGarigal et al. Citation2002). We computed class-level metric indices including the following: the number of patches (NP), mean patch size (MPS), and largest patch index (LPI) to indicate spatial scale; patch density (PD) and patch contig index (CONTIG) to indicate the spatial distribution; and the patch shape index (SHAPE) and patch fractal dimension (FRACT) to indicate shape complexity. The meaning, calculated formula, and the ecological usage of each metric and index can be referenced through the help file in FRAGSTATS software and related studies (McGarigal et al. Citation2002).
Influencing factors
To explore the factors that influence the location of human settlements, we collected data relating to roads, rivers, elevation, slope, and vegetative conditions in the study area. The road and river data were extracted from a classified land use map of Zhenglan Banner (discussed in Section 2.2 above) and verified by a Zhenglan Banner administrative map (1:50000) produced by Sino Map Press. The elevation and slope maps were extracted from the SRTM30 DEM (http://asterweb.jpl.nasa.gov/gdem.asp). Vegetation conditions were determined using the normalized difference vegetation index (NDVI), which was calculated as (near infrared (NIR) – RED)/(NIR + RED) from Landsat thematic mapper (TM) imagery of the study area acquired in July, 2015 (downloaded from the United States Geological Survey website (www.usgs.gov)). To identify the influence and effects of roads and rivers on settlements, buffers with widths of 500, 1000, 2000, 3000, 4000, and 5000 m from roads and rivers were produced, and the distances from settlements to roads and rivers were recorded by ArcGIS 10.2.
Results
Voronoi diagram
The Voronoi diagram () shows the spatial distribution patterns of settlements from the southern farmland region to the northern pastoral region. The measurements of showed that settlements were distributed randomly within farmland (
= 0.5633), ecotone (
, and pastoral regions (
). Although farmland settlements were prone to be distributed in clusters, a statistical significance was not reached because
was less than 0.6.
Figure 2. A Voronoi diagram showing the distribution of human settlements in Zhenglan Banner. Light black part indicates pastoral, moderate black part indicates farmland area, and deep black part indicates farming-pastoral ecotone, respectively.
Nearest neighbor analysis
The results of the nearest neighbor analysis showed that NNI of all three regions was larger than 1 (), which demonstrates a regular distribution pattern. The results demonstrate that settlements within farmland tend to have a more regular pattern, whereas pastoral regions tend to be distributed randomly. All distribution patterns were statistically significant.
Table 1. NNI and its significance of settlements along a farming–pastoral ecotone.
Landscape metrics
A comparison between the landscape patterns of different land uses along the farming–pastoral ecotone is shown in . Out of the total 169 settlements within the study area, 97 settlements were situated along the farming–pastoral ecotone (59.72% of all settlements in the county). At the patch level, the average patch size in the pastoral region was 34.49 hm2, which is larger than that in either the farming or the farming–pastoral ecotone. With respect to the LPIs, those of the pastoral region were the largest, followed by those of the ecotone, and then the farmland region. The PD of the farmland region was the largest (4.46 hm−2), but the farmland region had the smallest CONTIG. The patch shape was more complex in the farmland region than in the pastoral region, where patches had a relatively simple shape with more interconnections between each other.
Table 2. Patch level-landscape metrics along the farming–pastoral gradient in Zhenglan Banner.
Influencing factors
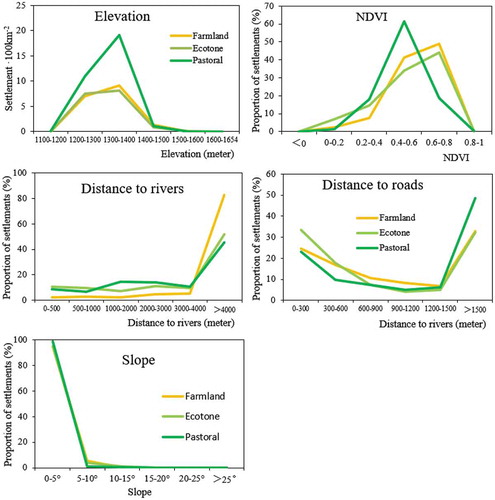
Many environmental factors can influence the spatial pattern of human settlements. We analyzed the relationship between the location of settlements and their elevation and slope, the NDVI, and the distance to rivers, lakes, and roads (). The results indicated that most settlements were located at an elevation of 1300–1400 m and that 75%, 55%, and 66% of farmland settlements, pastoral settlements, and ecotone settlements, with the density of 9.2, 8.1 and 19.5, respectively, were distributed at this elevation. The NDVI of 63% of settlements in pastoral regions was between 0.4 and 0.6; this value is generally lower than those of farmland and ecotone regions, which demonstrates that pastoral regions have a low vegetation coverage. Rivers are the most important drinking water sources for human settlements, and settlements are usually distributed near first-level rivers. However, the distance to rivers varied across the farming–pastoral ecotone in our case study. Most farmland settlements (85%) were located more than 4000 m from rivers, whereas only 55% of the pastoral settlements were located beyond this distance. Interestingly, more pastoral settlements (52%) were located at sites far from roads (>1500 m) rather than near to roads (22% of settlements were located ~300 m from roads), whereas the distribution was opposite for ecotone and farmland settlements. However, with respect to slope, almost all settlements (>97%) within the farmland, pastoral, and ecotone regions were located at sites where the slope gradient was less than 5%.
Figure 3. Effects of (a) elevation, (b) normalize difference vegetation index (NDVI), (c) rivers, (d) roads, and (e) slope on the spatial distribution of human settlements in the farming–pastoral ecotone of Zhenglan Banner, China.
Discussion
Multiple environmental factors influence the spatial patterns of human settlements, and many human populations live in extreme environments, such as within deserts and on mountains (Tang et al. Citation2018). With settlement expansion and global climate change, more people are being exposed to ecological risks from landslides, soil erosion, vegetation degradation, rainstorms, floods, and droughts. In addition, a greater frequency of disease and pests, environmental pollution, and toxic substances is predicted to occur around human settlements, which will seriously threaten human health and the economy (Peng et al. Citation2015; Reinmann et al. Citation2016). Landslides, soil erosion, and heavy desertification conditions occur in locations with high levels of ecological risk, and such processes cause extensive damage and ultimately the loss of human life and properties. In the study area investigated here, most of the settlements were located far from rivers and lakes at sites where the slope gradient was lower than 10°, which lowers the ecological and environmental risk associated with floods, mountain landslides, and soil erosion.
Most people living in the farming–pastoral ecotone of Inner Mongolia earn their livelihood by raising livestock and agricultural production. The vegetation type in the pastoral region of this area is mainly temperate grassland with moderate plant community cover and biomass and it is very sensitive to livestock grazing. However, grazing pressure is reduced under this environmental condition by the random distribution of livestock. Therefore, the random distribution of settlements across the pastoral landscape assists in restoring vegetation by preventing heavy grazing pressure, which would occur if the settlements were concentrated together rather than being randomly dispersed. With respect to the farming region in this ecotone, farmlands are divided into many small patches, as each small patch belongs to a different owner. The main crops here include potato, maize, and sunflower, which require intensive farming activities (such as sowing, farming, irrigating, and harvesting). The random distribution of settlements that have almost a cluster distribution reduces the intensity of such agricultural labor, as settlements are mostly located near surrounding farmland patches, as indicated by the Nearest Neighbor Analysis. This short distance from the settlements to farmland saves labor on the flat plain areas.
Previous studies have shown that roads effectively influence the spatial pattern of human settlements. Approximately 15–20% of the landscape in the United States is affected by roads (Forman Citation2000), 16% in The Netherlands (Reijnen, Foppen, and Veenbaas Citation1997), and 18.37% in China (Li et al. Citation2004). With economic and social development, the lengths and numbers of roads will increase over time (Coffin Citation2007; Yu et al. Citation2015). With this increase, populations will be concentrated nearer road networks, and a spatial cluster pattern will develop. These cluster patterns of settlements along roads will weaken the ability of regional ecosystems to resist external risks, and ecological risk will be increased (Liu et al. Citation2008; Karlson and Mörtberg Citation2015). These potential risks are confirmed by the results presented in this study of the relationship between settlements and NDVI. The NDVI can be used as a robust indicator of vegetation degradation (Peng et al. Citation2016); a lower NDVI indicates sparse vegetation coverage, which means that the ecosystem is more fragile, it can be more easily destructed, and desertification process is more active in the study area (Peng, Wang, and Fan Citation2017). In this study, the NDVI of areas surrounding 63% of settlements in the pastoral region (where livestock grazing is the main activity) was found to be 0.4–0.6; this value is lower than that of the farmland and ecotone regions and demonstrates a low vegetation coverage. In Zhenglan Banner, the intensity of desertification is one of the main ecological factors determining the spatial pattern of settlements, and it can be estimated by the NDVI and land cover (Goirán, Aranibar, and Gomez Citation2012). The present study also demonstrates that pastoral settlements are mainly located in areas that have desert characteristics. It is considered that researchers, landscape planners, and policymakers should carefully consider the spatial patterns of settlements along roads and desert lands to avoid potential ecological risks from soil erosion, desertification, and ultimately poverty.
In contrast with our expectation, the spatial distribution of settlements across the three areas was very similar, although settlements in farmland areas tended to be clustered together and those in pastoral areas tended to be evenly distributed. This demonstrates that the spatial patterns of settlements within the three areas can be regulated and optimized by human activities affected by policies and regulations. From this perspective, the spatial pattern of settlements in such areas could be designed so that they are distributed throughout pastoral or farming zones. Under such patterns, roads and rivers could be easily accessed. A trace and necessary small pavement roads can be carefully designed as narrow and small ones, evenly distributed around the settlements. This spatial pattern would help settlements to benefit from the shortest distances and low labor costs, and also avoid the risks associated with promoting soil erosion, vegetation degradation, desertification, and floods. Risk from diseases and pests, environmental pollution, and toxic substances would also be reduced if settlements were spatially distributed in this way.
This study provides a systematic framework for theoretical and empirical research on the spatial pattern of human settlements along the farming–pastoral ecotone. Different from the conventional comprehensive evaluation of the spatial distribution of settlements in farmland and pastoral regions separately, we choose the farming–pastoral ecotone, which consist of both farming and pastoral settlements, as the locations where spatial patterns were compared. Afterward, we explored the spatial association between the distribution of settlements and environmental factors as elevation, slope, NDVI, and distance to rivers and roads.
Conclusions
The spatial pattern of settlements in agricultural and pastoral zones and their ecotones does not demonstrate significant difference. However, agricultural zones were observed to have a more clustered distribution and pastoral zones were more evenly distributed. Consequently, we can optimize the settlement pattern to improve sustainability with respect to environmental conservation, resource utilization, and societal development. Spatial restructuring and land consolidation in farming–pastoral areas and maintaining a balance between increases and decreases through land-use policies in the semi-arid ecotone areas would be indispensable for optimizing the production and ecology of agriculture land and associated livelihoods together with addressing the effects of livestock grazing and industrial and mining land consolidation. This study can be used to guide settlement planning in semi-arid and arid areas, promote intensive land use, and reduce the conflict between the development of settlements and the availability of water, land, and vegetation resources. Sustainable development and revitalization of the farming–pastoral ecotones could thus be achieved in China.
Disclosure statement
The authors declare no conflicts of interest.
Additional information
Funding
References
- Chen, M. X., and C. Ye. 2014. “Differences in Pattern and Driving Forces between Urban and Rural Settlements in the Coastal Region of Ningbo, China.” Sustainability 6: 1848–8. doi:10.3390/su6041848.
- Clark, J. K., R. McChesney, D. K. Munroe, and E. G. Irwin. 2009. “Spatial Characteristics of Exurban Settlement Pattern in the United States.” Landscape and Urban Planning 90: 178–188. doi:10.1016/j.landurbplan.2008.11.002.
- Clark, P., and F. Evans. 1954. “Distance to Nearest Neighbor as a Measure of Spatial Relationships in Populations.” Ecology 35: 445–453. doi:10.2307/1931034.
- Coffin, A. W. 2007. “From Roadkill to Road Ecology: A Review of the Ecological Effects of Roads.” Journal of Transport Geography 15 (5): 396–406. doi:10.1016/j.jtrangeo.2006.11.006.
- Duyckaerts, C., and G. Godefroy. 2000. “Voronoi Tessellation to Study the Numerical Density and the Spatial Distribution of Neurons.” Journal of Chemical Neuroanatomy 20 (2): 83-92. doi:10.1016/S0891-0618(00)00064-8.
- Ellis, E. C., and N. Ramankutty. 2008. “Putting People in the Map: Anthropogenic Biomes of the World.” Frontier in Ecology and Environment 6: 439–447. doi:10.1890/070062.
- Forman, R. T. T. 2000. “Estimate of the Area Affected Ecologically by the Road System in the United States.” Conservation Biology 14: 31–35. doi:10.1046/j.1523-1739.2000.99299.x.
- Goirán, S. B., J. N. Aranibar, and M. L. Gomez. 2012. “Heterogeneous Spatial Distribution of Traditional Livestock Settlements and Their Effects on Vegetation Cover in Arid Groundwater Coupled Ecosystems in the Monte Desert (Argentina).” Journal of Arid Environments 87 (4): 188–197. doi:10.1016/j.jaridenv.2012.07.011.
- Karlson, M., and U. Mörtberg. 2015. “A Spatial Ecological Assessment of Fragmentation and Disturbance Effects of the Swedish Road Network.” Landscape and Urban Planning 134: 53–65. doi:10.1016/j.landurbplan.2014.10.009.
- Li, S. C., Y. Q. Xu, Q. F. Zhou, and L. Wang. 2004. “Statistical Analysis on the Relationship between Road Network and Ecosystem Fragmentation in China.” Progress in Geography 5: 78–85.
- Liu, S. L., B. S. Cui, S. K. Dong, Z. F. Yang, M. Yang, and K. Holt. 2008. “Evaluating the Influence of Road Networks on Landscape and Regional Ecological Risk—a Case Study in Lancang River Valley of Southwest China.” Ecological Engineering 34 (2): 91–99. DOI:10.1016/j.ecoleng.2008.07.006.
- Long, H. L., Y. S. Liu, X. Q. Wu, and G. H. Dong. 2009. “Spatio-temporal Dynamic Patterns of Farmland and Rural Settlements in Su-Xi-Chang Region: Implications for Building a New Countryside in Coastal China.” Land Use Policy 26: 322–333. doi:10.1016/j.landusepol.2008.04.001.
- Longuetaud, F., T. Seifert, J. Leban, and H. Pretzsch. 2008. “Analysis of Long-term Dynamics of Crowns of Sessile Oaks at the Stand Level by Means of Spatial Statistics.” Forest Ecology and Management 255: 2007–2019. doi:10.1016/j.foreco.2008.01.003.
- Ma, L. B., X. D. Guo, and Q. Y. Zhang. 2012. “Spatio-temporal Distribution and Optimization of Rural Settlements in Gangu County of Loess Hilly Area.” Transactions of the Chinese Society of Agricultural Engineering 28 (13): 217–225.
- McGarigal, K., S. A. Cushman, M. C. Neel, and E. Ene. 2002. “FRAGSTATS: Spatial Pattern Analysis Program for Categorical Maps. Computer Software Program Produced by the Authors at the University of Massachusetts Amherst.” http://www.umass.edu/landeco/index.html
- Okabe, A., B. Boots, K. Sugihara, and S. N. Chiu. 2000. Spatial Tessellations: Concepts and Applications of Voronoi Diagrams. West Sussex: Wiley.
- Peng, Y., K. Mi, F. Qing, X. Liu, L. Liu, and Q. Chen. 2015. “Ecological Risk Assessment for Key Industrial Development Zones in the Areas Surrounding the Bo Sea in China.” Human & Ecological Risk Assessment 22 (2): 475–488. doi:10.1080/10807039.2015.1080592.
- Peng, Y., K. Mi, F. Qing, and D. Y. Xue. 2016. “Identification of the Main Factors Determining Landscape Metrics in Semi-arid Agro-pastoral Ecotone.” Journal of Arid Environments 124: 249–256. doi:10.1016/j.jaridenv.2015.08.009.
- Peng, Y., Q. H. Wang, and M. Fan. 2017. “Identification of the Key Ecological Factors Influencing Vegetation Degradation in Semi-arid Agro-pastoral Ecotone considering Spatial Scales.” Acta Oecologica 85: 62–68. doi:10.1016/j.actao.2017.09.011.
- Reijnen, R., R. Foppen, and G. Veenbaas. 1997. “Disturbance by Traffic of Breeding Birds: Evaluation of the Effect and Considerations in Planning and Managing Road Corridors.” Biodiversity and Conservation 6 (4): 567–581. doi:10.1023/A:1018385312751.
- Reinmann, A. B., L. R. Hutyra, A. Trlica, and P. Olofsson. 2016. “Assessing the Global Warming Potential of Human Settlement Expansion in a Mesic Temperate Landscape from 2005 to 2050.” Science of the Total Environment 545-546: 512–524. doi:10.1016/j.scitotenv.2015.12.033.
- Sawada, M. 2002. “Nearest Neighbor Analysis (VBA Macro for ArcGIS), Computer Software.” Accessed 21 February 2011. http://arcscripts.esri.com/details.asp?dbid=12227
- Tang, L., L. Wang, Q. Li, and J. Zhao. 2018. “A Framework Designation for the Assessment of Urban Ecological Risks.” International Journal of Sustainable Development & World Ecology 25 (5): 387–395. doi:10.1080/13504509.2018.1434570.
- Xu, Y., L. Pu, and L. Zhang. 2014. “Spatial Pattern and the Process of Settlement Expansion in Jiangsu Province from 1980 to 2010, Eastern China.” Sustainability 6 (11): 8180–8194. doi:10.3390/su6118180.
- Yang, W., J. Zhao, and K. Zhao. 2018. “Analysis of Regional Difference and Spatial Influencing Factors of Human Settlement Ecological Environment in China.” Sustainability 10 (5): 1520. doi:10.3390/su10051520.
- Yu, H., Y. Luo, S. Liu, and Y. Wang. 2015. “The Influences of Topographic Relief on Spatial Distribution of Mountain Settlements in Three Gorges Area.” Environment Earth Science 74: 4335–4344. DOI:10.1007/s12665-015-4443-2.
- Yu, Z. W., L. Xiao, Q. Guo, and Z. C. He. 2016. “Mountain County Rural Settlement Landscape Pattern Change and Spatial Characteristics in Rapid Mountain Urbanization Process in Fujian Province.” Acta Ecologica Sinica 10: 3021–3031.
- Zhang, Z. H., R. Xiao, A. Shortridge, and J. P. Wu. 2014. “Spatial Point Pattern Analysis of Human Settlements and Geographical Associations in Eastern Coastal China—a Case Study.” International Journal of Environmental Research and Public Health 11: 2818–2833. doi:10.3390/ijerph110302818.
- Zhou, G. H., Y. H. He, C. L. Tang, T. Yu, G. Z. Xiao, and T. Zhong. 2013. “Dynamic Mechanism and Present Situation of Rural Settlement Evolution in China.” Journal of Geographical Sciences 23: 513–524. doi:10.1007/s11442-013-1025-7.