
 ?Mathematical formulae have been encoded as MathML and are displayed in this HTML version using MathJax in order to improve their display. Uncheck the box to turn MathJax off. This feature requires Javascript. Click on a formula to zoom.
ABSTRACT
Flow regime is a key driver of invasive aquatic organisms, and the invasiveness of mangrove species may be simultaneously attributed to plant traits and flowing hydrological conditions at the estuary scale. We focused on hydrological and topographic conditions for a non-native mangrove species, Sonneratia apetala, in Zhangjiang Estuary of Fujian, China. A hydrological model and a micro-topographic model were used to predict its dispersal and early establishment, and field surveys and simulated experiments were integrated to estimate its future dispersal patterns. The mesohaline mudflat with a salinity of 8 ~ 10 PSU at the mangrove seaward edge was the most likely colonization area for S. apetala under current conditions. The south-western region of the estuary with native mangroves was the most likely area for its colonization according to the unstructured-grid finite-volume community ocean model (FVCOM) in September, when the largest tidal currents within a year and the maximum fruit maturity period occur. Approximately 42% of the mudflats throughout the whole estuary may be available for seedling establishment under the future sea-level rise RCP 4.5 scenarios compared with 44% for current establishment; however, the RCP 8.5 scenarios would significantly decrease seedling establishment by 2100 due to serious tidal inundation according to the micro-topographical model.
Introduction
Flowing water can make important contributions to biogeochemical cycles in coastal or marine ecosystems (Palmer and Ruhi Citation2019). Globally, the flow regime in such ecosystems is a key driver of species invasions, especially for invasive aquatic organisms. However, in coastal ecosystems, mangroves have been studied for their invasiveness more as an upland plant than an aquatic plant. For example, forest structure, environmental adaptation, niche competition and plant-animal relations have been the most considered for the invasiveness of exotic mangroves (Chen Citation2019). Almost all mangrove propagules, such as hypocotyls or seeds, can be transported to new habitats as special floating organisms (Clarke et al. 1993). The expansion patterns of mangroves depend greatly on the scales of regional or local tidal currents (Van der Stocken et al. Citation2019). In Hawaii, the invading mangrove species in new habitats, i.e. Rhizophora mangle, was driven by water flows (Allen Citation1998; Fourqurean et al. Citation2010), although, the invasive mechanisms in local flowing hydrological conditions for the eight invading mangrove species worldwide are poorly understood (Chen Citation2019). Propagule dispersal and establishment are two key stages for non-native plant colonization in new habitats (Reichard and Hamilton Citation1997). Hydrological drivers and topographical conditions therefore jointly affect mangrove propagule dispersal patterns (Van der Stocken et al. Citation2019). For those successful settling pioneers in bare mudflats, Balke, Herman, and Bouma (Citation2014) demonstrated that seedling establishment occurred via physical force for diaspore dispersal and a disturbance-free (inundation-free) period for seedling settle-down, which are called “Windows of Opportunity (WoO).” This concept has been used to predict some saltmarsh and mangrove cases (Balke, Herman, and Bouma Citation2014; Hu et al. Citation2015). Thus, the invasiveness of mangroves can simultaneously be attributed to plant traits and flowing hydrodynamic conditions.
On the coasts of southern China, Sonneratia apetala, an exotic mangrove species that is naturally dominant on the coasts of the Indian Ocean, was introduced in 1985 and has been widely used in mangrove afforestation efforts since the 1990 s (Chen et al. Citation2008). This species has successfully occupied new habitats and is tolerant to environmental stresses; however, its invasive potential has drawn substantial attention (Ren et al. Citation2009; Peng et al. Citation2018). Although seed/seedling dispersal capacity and early growth determine the successful dominance of invasive plant species as demonstrated by different simulated settings (e.g. Greenberg, Smith, and Levey Citation2001; Chen et al. Citation2013; Peng et al. Citation2018), the lack of evidence for the dispersal potential and environmental tolerance of S. apetala at the regional-scale has hampered the availability of reliable information for forestry managers. In addition, the future patterns of local intertidal habitats invaded by S. apetala under future sea-level rise (SLR) scenarios are unknown.
Environmental gradients, such as tidal inundation (i.e. flooding frequency and duration) and salinity along with SLR, are important stresses on vegetation distribution and productivity and inter-species competition among mangroves (Krauss, Doyle, and Howard Citation2009). Among these environmental factors, tidal inundation and salinity are the key factors influencing early growth and eco-physiological responses at the local intra-estuary scale (Ball Citation1998; Mckee and Vervaeke Citation2017). Tidal inundation governs mangrove species distribution landward to the sea edge, where mangrove vegetation naturally exhibits zonation with an elevation gradient (Watson Citation1928). Species-specific stress tolerance to tidal inundation along elevation levels has been widely reported and leads to species zonation and guide assessments of the vulnerability and resilience of mangrove forests under future SLR scenarios (Lovelock et al. Citation2015; Mckee and Vervaeke Citation2017). SLR can also present new opportunities for exotic species due to their better performance under SLR than that of native plants (Harley et al. Citation2006; Chen et al. Citation2013). Meanwhile, as a key stressor to mangroves, salinity affects varying stages of the development from seed germination to seedling growth to the water use of mature plants (Ball and Pidsley Citation1995). Natural populations of tropical mangrove species universally experience a range of salinity regimes that have resulted in mangrove distribution patterns along natural salinity gradients (Ball and Pidsley Citation1995; Ball Citation2002). Typically, the distribution patterns in mangrove estuaries have high species diversity at low and medium salinities and low species diversity at high-salinity estuary mouths (Barik et al. Citation2018). Given the estuary scale of factors such as micro-topography and hydroperiod, species distribution patterns must adjusted accordingly (Stringer et al. Citation2010; Mikolaev et al. Citation2016). Thus, the future SLR will likely have far-reaching impacts on mangroves and even change the invasive patterns of non-native mangrove species (Woodroffe, Lovelock, and Rogers Citation2015). Prediction models combining seedling responses, micro-topographic monitoring, seed dispersal patterns and tidal current models would accurately outline the patterns of local invaded habitats. The prediction of the S. apetala dispersal patterns at the regional estuary scale should simultaneously consider seedling responses to such environmental factors, including seed dispersal, tidal current models and micro-topographic conditions under future SLR scenarios.
The Zhangjiang Nature Reserve, located in Fujian Province, China, is a typical estuarine mangrove with a salinity gradient of 0 ~ 29 PSU from upstream to the estuary mouth (Zhang et al. Citation2012). Approximately 0.3 ha of S. apetala seedlings were first planted near the estuary mouth of the nature reserve in 2006, and dispersed individuals were found in the whole estuary in the early 2010 s (Peng et al. Citation2018). The accurate prediction of the potential dispersal ranges and future invasive patterns of S. apetala in estuaries could provide reliable information to managers for appropriate responses to these ongoing changes. In this study, we carried out repeated-measure field surveys of S. apetala seedlings/trees in 2014 and 2018 throughout the whole estuary. After the 2014 survey, all S. apetala individuals were cleared by the reserve managers, while new individuals dispersed and grew after that time. Additionally, sets of simulated experiments were conducted to determine the thresholds of the early growth of S. apetala seedlings to salinity and elevation (tidal inundation). By combining the results from the field monitoring and simulated experiments, we projected topographic models and tidal current models to estimate the future dispersal patterns of S. apetala according to two SLR scenarios. The objectives of this study are to, 1) determine the drivers governing S. apetala dispersal at the whole-estuary scale, and 2) predict future dispersal patterns under SLR scenarios at the local estuary scale. The key principle of this study is to integrate complementary information from field surveys and theoretical modeling to upscale information and provide reliable information on invasive plant management to decision-makers.
Materials and methods
Study site
The study site is located in Zhangjiang Estuary (23°53′ – 23°56′N, 117°24′ – 117°30′E), which is adjacent to Dongshan Bay in the northwest of Fujian Province, China (). This area is characterized by a subtropical marine monsoon climate with an annual rainfall of 1715 mm and a high frequency of summer typhoons. The average critical winter temperature is 12.1 ± 0.77 °C (in January), and the average critical summer temperature is 32.5 ± 0.18 °C (in July). The open water tide of this area is an irregular semi-diurnal tide with an average tidal range of 2.32 m. There are naturally occurring mangroves covering approximately 2360 ha within the estuary, and they are dominated by the mangrove species Kandelia obovata, Aegiceras corniculatum and Avicennia marina. Approximately 2 ha of the non-native S. apetala trees was planted near the estuary mouth (the northeast of the nature reserve) in 2006 (). Very few dispersed individuals were found in the whole estuary in the early 2010 s (personal observation). In 2014, S. apetala was found dispersed on the seaward edge and mudflats of mangroves in this area.
Figure 1. Map of Zhangjiang Estuary showing the study area in Fujian Province, China.
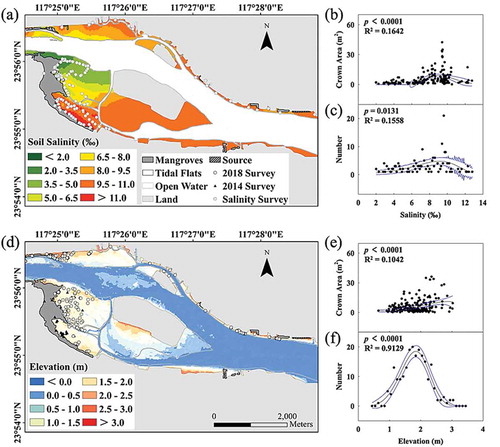
Figure 2. Dispersal patterns of S. apetala individuals in the 2014 survey and 2018 survey with the (a) surface soil salinity and (d) sediment elevation of Zhangjiang Estuary. The relation between the distribution of soil salinity and (b) crown area and (c) the dispersal number and the relation between the elevation and (e) crown area and (f) the dispersal number. The 95% confidence interval (the blue lines) according to the Weibull distribution analysis is indicated.
Field survey
The sediment surface elevation of the whole Zhangjiang Estuary was surveyed in early 2018 by using unmanned aerial vehicle (UAV, SPERADING WINGS S1000, DJI Technology Inc., Shenzhen, GD, China)-LiDAR (TruSense S200, Laser Technology Inc., Centennial, CO, USA) for the tidal flats and an echo sounder (Hi-Target Surveying Inc. Guangzhou, GD, China) for the underwater part due to the complex terrain of the survey area (Text S1). We synthesized the elevation data (geographic coordinate system, WGS_1984) with multiple methods, which were the base of the hydrological model and the prediction of diffusion passivity.
Using a real-time kinematic global positioning system (GNSS G970 RTK-GPS, UniStrong Science & Technology, Inc., Beijing, China), we surveyed the dispersed S. apetala individuals throughout the whole Zhangjiang Estuary in December 2014. Three reference points (based on absolute elevation data) were established in the survey area. The receiver had 220 channels and up to a 410 MHz working rate. The accuracy of the position obtained varied within 15 mm with correction signals. The location of each seedling was determined by the handled control unit and obtained by placing the lower tip of the pole at the soil surface of every seedling/sapling/tree. The geographic coordinate system of the actual location of each individual was WGS_1984.
In the 2014 survey, we collected the growth indexes of the stem basal diameter, height and crown area of each spread individual. We judged the ages based on the morphological indexes, crown area, tree ring when they were cut, and combined these data with observation records. After the survey, the Sonneratia trees or seedlings were removed.
In 2018, some young trees, saplings and seedings were found in similar environments as in 2014, and the height, diameter at breast height (DBH), crown area () and the located elevation of each S. apetala individual were also recorded in situ.
Table 1. Growth status of S. apetala in Zhangjiang Estuary in 2014 and 2018.
In July 2018, by using the same survey systems as the 2014 survey, we also obtained the dispersal tree information using a UAV that covered the whole estuary and we considered the area of continuously tracking surveys in sunny and windless weather. An autonomously flying quadcopter DJI Phantom 4 (UAV: DJI Phantom 4, DJI Technology Inc., Shenzhen, GD, China) equipped with a camera with a 20-megapixel complementary metal-oxide-semiconductor (CMOS) sensor was used to acquire high-quality three-waveband (RGB) images. The images were assembled to form a single two-dimensional (2-D) orthorectified image (orthomosaic) geo-referenced to the WGS84 geographic coordinate systems using PhotoScan software (Agisoft LLC, St. Petersburg, LR, Russia) (Zhu et al. Citation2019). The flight height was ~ 200 meters aboveground with an equivalent spatial resolution of ~ 0.08 meters. These S. apetala individuals were detected by aerial photograph with visual interpretation methods (Fig. S1), and the ultra-fine spatial resolution of the UAV image rendered each tree crown recognizable. Thus, we measured the crown area of every individual from the processed UAV images by ArcGIS (ESRI Inc., Redlands, CA, USA) in the study area. Using the relationships between the age and crown area/basal diameter built in the former studies, we determined the age of individuals found in 2018. However, the UAV survey could not judge seedlings within one year in age. We calculated other growth indexes (height and DBH) () according to the relationship between these variables and the crown area in both the 2014 and 2018 surveys (Fig. S2).
Surface sediment sampling points were collected throughout the whole estuary by cutting rings in the early summer of 2018, which is the period during which the S. apetala propagules started to germinate intensively ()), and these points were based on the surveys that used the GIS grid map of the dispersal area of S. apetala. The sample region was mostly distributed within mangrove fringes, interior salt marsh and mudflat with a high frequency of S. apetala individuals. The samples were placed into Ziplock bags and stored at 4 °C in the laboratory before analysis. In the laboratory, the surface soil samples were air dried and ground using a mortar and pestle. The soluble salt content of each sample was determined by the electrical conductivity (EC) of a soil water extracted with a portable conductivity meter (DDS-307, Yoke Instrument Inc., Shanghai, China). The laboratory determination of a saturated soil paste (ECe) is time consuming relative to that of EC measurements made with 1:5 extracts of soil to water (Slavich and Petterson Citation1990).
Simulated experiment: response to tidal salinity
The fruit of S. apetala from Zhangjiang Estuary was steeped, rinsed and put into Petri dishes with filter paper. The seeds were subjected to five seawater salinity levels of 0, 10, 20, 30, and 40 practical salinity units (PSU) compounded by aquarium sea salt (Instant Ocean, Spectrum Brands Company, Cincinnati, OH, USA). Seedlings of the three replicates were cultured in a greenhouse at Xiamen University (24°36′30′′N, 118°18′46′′E) in the summer of 2018. Sixty seeds were put onto filter paper in each culture dish after adding 10 mL of mixed liquor with a pipette and then placed into an artificial incubator (the culture conditions were 25°C, 80% humidity, and illumination between 8:00 am ~ 8:00 pm each day). The number of germinating seeds were recorded every day for 15 days until no seeds germinated further.
For the early growth measurements at different salinity levels, the seedlings were subjected to five levels of salinity, namely, 0, 10, 20, 30, and 40 PSU, with three replicates from May to August, 2017 in the greenhouse at Xiamen University (24°36′30′′N, 118°18′46′′E). Healthy seedlings from Zhangjiang Estuary with similar growth with two pairs of mature leaves at a 20 cm height were selected and grown in pots (10 cm in diameter and 15 cm in depth) and washed with river sand as substrate. Artificial seawater at five salinity levels was prepared by mixing running water with aquarium sea salt (Instant Ocean, Spectrum Brands Company, Cincinnati, OH, USA) without purification and was then used for cultivation. Tap water was added daily to compensate completely for the lack of evaporation, and the seawater was renewed weekly. The seedling survival numbers of each treatment were counted every 10 days. After 80 days of cultivation, all seedlings were harvested and rinsed in freshwater to remove sporadic sand. Seedlings were divided into aboveground and belowground parts, dried at 60 °C for 72 h and then weighed for aboveground biomass (AGB) and belowground biomass (BGB).
Simulated experiment: response to tidal inundation
A tidal water-level platform in Zhangjiang Estuary (23°55′0.17′′N, 117°25′45.70′′E) was developed based on the marsh organ design following Morris, Sundberg, and Hopkinson (Citation2013), and four elevation levels were used for mangrove seedling cultivation (Fig. S3). On each marsh organ, four elevation levels were used from top to bottom as four tidal inundation treatments of M (+40 cm, related to the mangrove seaward edge, the same below), S (+0 cm), representative concentration pathway (RCP) 4.5 (−40 cm) and RCP 8.5 (−80 cm). Each two adjacent levels were set 40 cm apart. According to the surface elevation survey in Zhangjiang Estuary, the average elevations of both the natural distribution and the mangrove seaward edge were set as the M treatment and S treatment, respectively. These two acceleration scenarios of the marsh organ were adopted for the evaluation of SLR from the RCP scenarios and the hydrology of the coastal areas of China (IPCC Citation2014; Qu et al. Citation2019), which were 0.48 ~ 0.61 m under moderate acceleration (RCP 4.5) and 0.84 ~ 0.99 m under high acceleration (RCP 8.5) by 2100 in the International Panel on Climate Change (IPCC) Fifth Assessment Report (AR5). Thus, the two sea-level rise treatments were −40 cm and −80 cm as projected by RCP 4.5 and RCP 8.5, respectively (Fig. S3). Three marsh organs were used as three replicates with at least 0.5 m between each one. Plastic pots (16 L volume, 32 cm height and 30 cm depth) were filled with mudflat sediment and placed on the platform of each elevation treatment. In May 2015, a S. apetala seedling that was 30 cm tall and had been cultured in a nearby nursery was planted in each pot. Water-level gauges were installed to record the water pressure difference and detect the real-time water level (Text S2, Table S1). This experiment lasted for one year. All seedlings were harvested and rinsed in freshwater to remove sediment every half year for biomass measurements. Seedlings were divided into aboveground and belowground parts and were dried at 60 °C for 72 h and then weighed to determine the AGB and BGB. Data from all seedlings (both dead and alive) in each experiment were used to calculate the growth indexes.
Hydrological model for seed dispersal
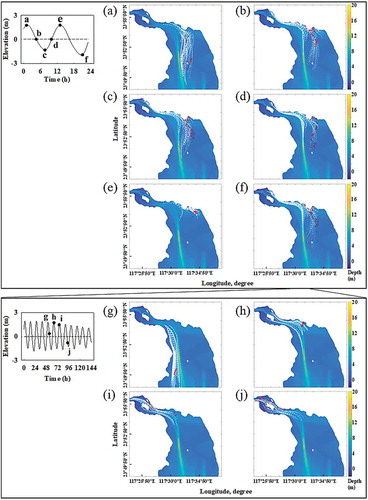
The tidal current model of Dongshan Bay (geographically including Zhangjiang Estuary and Dongshan Bay) was used to monitor the dispersal patterns of the S. apetala fruits. The fruits of S. apetala are round in shape and approximately 2 cm in diameter, and they can float for at least two weeks in seawater (Hong et al. Citation2020). The Dongshan Bay tidal current model was established based on the primitive equation, unstructured-grid finite-volume community ocean model (FVCOM) as shown in Text S3 (Chen, Beardsley, and Cowles Citation2006). The fruit dispersal patterns of S. apetala from the source in the estuary mouth were simulated by FVCOM based on the elevations in Zhangjiang Estuary within one tidal cycle that started on 10 September 2018 (GMT + 08), which was consistent with the maximum fruiting season of S. apetala in this region. The tidal current in September is the largest within one year; thus, the dispersal distance at this time would be the longest among those of a year.
Micro-topographic model to predict seedling establishment potential
The study simulated the potential dispersal area of S. apetala according to the above germination, early growth characteristics and salinity and tidal inundation simulations. Marine topographic data of the study area were developed by applying the ordinary kriging spatial interpolation function in ArcGIS 10.4.
By importing the elevation and salinity data into ArcGIS 10.4, the inverse distance weight (IDW) was used to interpolate those spatial data, which is based on a concept of distance weighting. Generally, this method can be used to estimate unknown spatial data from the known data of sites that are adjacent to the unknown site according to the assumption of the weighted average (Chen and Liu Citation2012). The interpolating formulas are given as EquationEqs. 1(1)
(1) and Equation2
(2)
(2) .
where S(x) can be described by the interpolated value, which is unknown; Zi is the value at a known point I; n is the amount of known points used in the interpolation; di is the separation distance from each known point i to the prediction point; wi is the weighted value of each known point i (Buchanan and Triantafilis Citation2009; Emadi and Baghernejad Citation2014); and u denotes the weighting power and is also a control parameter (Buchanan and Triantafilis Citation2009; Chen and Liu Citation2012).
A model was developed based on the results of these simulated experiments to predict the dispersal possibility of S. apetala in Zhangjiang Estuary subject to two SLR acceleration scenarios: moderate acceleration (0.48 m by 2100 in RCP 4.5) and high acceleration (0.84 m by 2100 in RCP 8.5) (IPCC Citation2014). The projections with salinity and elevation were performed to 2100. The total elevation deficit to 2100 was calculated by summing the accumulated elevation deficits and considered to be the magnitude of the SLR.
Statistical analysis
With growth data from field surveys, a parametric one-way analysis of variance (ANOVA) was performed to compare the differences in soil salinity and elevation levels. Regression models were performed to evaluate the relationships between the environmental parameters (elevation and salinity of surface sediment) and the growth index (the number and crown area of dispersed trees) using SigmaPlot version 12.5 (Systat Software Inc., San Jose, CA, USA). The best fitting model was generated. To provide distribution regularity related to the seedling crown area and seedling number along the different elevations and soil salinity gradients, models that describe these trends were sought. In comparison to other distribution forms, i.e. gamma and Gaussian, a 4-parameter Weibull distribution (Smith and Hoeppner Citation1990; Lai Citation2014) provided the most flexibility. In the simulated experiments, the effects of salinity or elevation on the survival and the growth of both dead and live seedlings were evaluated using a parametric one-way ANOVA, with salinity or elevation treatments as the fixed factors and pots as a random factor. If the difference was significant at p ≤ 0.05, then a post hoc test was employed to determine the treatments responsible for the difference. All analyzes were carried out using SPSS 24.0 software (IBM Co., Armonk, NY, USA).
Results
Distribution patterns with micro-topographic and salinity backgrounds
During the 2014 survey, most of the S. apetala individuals were dominant around the tidal creek or mudflat at an average of 2 ~ 4 years old (). After the S. apetala individuals were cleaned after the 2014 survey, some new individuals were found in the 2018 survey, which covered the interior mudflat adjacent to mangroves. The recorded S. apetala individuals varied with distance to the source (the mother trees), with the longest dispersal distance of approximately 9 km from the upstream ()).
Soil salinity distributions are shown as color contours and varied between 1.5 and 13 PSU in the estuary. The soil salinity of the upstream fringe mudflat was relatively low (~ 2 PSU), which marginally increased from upstream to the estuary mouth ()). The individuals were found at the mesohaline mudflat with salinities of 8 ~ 10 PSU, and they showed significantly larger crown areas (,)).
The substrate elevation ranges of the tidal flats within the whole estuary range was −0.2 ~ 3.0 m (comparing to the mean sea level, MSL) in tidal flats ()). The surface elevation of the whole estuary was positively related to the growth ()), while the dispersal tree number followed a normal distribution along the elevation in Zhangjiang Estuary ()). Approximately 90% of the dispersed individuals colonized on 44% of the mudflats above the MSL (), Table S2).
Seedling growth response to salinity and SLR
Differential effects of salinity on both germination and early growth were found (). The seedlings germinated in water salinities ranging from 0 ~ 30 PSU, with the highest proportion developing within a range of 0 ~ 20 PSU and showing only 20% mortality, and germination was extremely poor at 40 PSU ()). There was no significant effect of salinity on the AGB of the S. apetala seedlings, while the BGB at 10 PSU was approximately threefold higher than that at 30 and 40 PSU (p < 0.05) ()), and the root/shoot ratio at 0 ~ 20 PSU was significantly higher than that at 40 PSU (p < 0.05) ()). When salinity exceeded 30 PSU, seedlings experienced 100% mortality. Both the germination and early growth of S. apetala were optimum in the relatively low salinity treatments (0 ~ 20 PSU), in which the highest survival rate and best seedlings growth state were found ().
Figure 3.. Growth status of seedlings in salinity treatments in a greenhouse. (a) Germination percentage of S. apetala individuals, (b) aboveground biomass (AGB) and belowground biomass (BGB) of S. apetala seedlings, (c) survival percentage of the 80-day culture and (d) the root/shoot ratio of S. apetala individuals. Error bars indicate the standard error (SE) of the average (n = 3). Dead indicates seedlings that were dead after 10 days of growth. NS indicates no significant difference. Different letters represent significant differences among the five salinity treatments according to a one-way ANOVA with the LSD test at p ≤ 0.05.
The inundation duration increased from 2.8 h to 12.0 h per day, with the inundation depth increasing from 31.5 cm to 82.1 cm with a declining elevation (Fig. S1). All S. apetala seedlings survived in all SLR treatments. Both AGB and BGB varied strongly as a function of the inundation variables ()). The the AGB under the S and RCP 4.5 treatments was significantly higher than those of the other two treatments. Meanwhile, the BGB of the RCP 4.5 treatment was remarkably higher than that of the other treatments (p < 0.05) ()), and the root/shoot ratio of the RCP 4.5 treatment also reached the highest value ()).
Figure 4. Growth status of seedlings under the elevation treatments in the marsh organs. (a) Aboveground biomass (AGB) and belowground biomass (BGB) of S. apetala seedlings at harvest (after a one-year culture) and (b) the root/shoot ratio of S. apetala seedlings. The error bar indicates the standard error (SE) of the average (n = 4). The different letters indicate significant differences among the four elevation treatments according to one-way ANOVA with the LSD test at p ≤ 0.05. M indicates the treatment for the current elevation of the natural distribution, S indicates the current elevation of the mangrove seaward edge, RCP 4.5 indicates the future elevation under the RCP 4.5 scenarios, and RCP 8.5 indicates the future elevation under the RCP 8.5 scenarios.
Model predictions for S. apetala dispersal and establishment
The fruit dispersal patterns of S. apetala from the source at the estuary mouth were simulated by the FVCOM model. The northwestern region of Zhangjiang Estuary appeared to be the most likely region for fruit dispersal when fruits were released into the source region at the time of ebb tide ()). After several tidal cycles, many fruits occurred in the mudflats in the southwestern region of the estuary ()), which was consistent with the survey results of year 2014 and 2018 ().
Figure 5. Results of the path of dispersing S. apetala propagules released in different periods (a – f) within several tidal cycles by the FVCOM model and continued subsection results (g – j) based on the suitable result of (f). The red symbols and the white lines are the seeds of S. apetala and the trajectory of floating seeds, respectively.
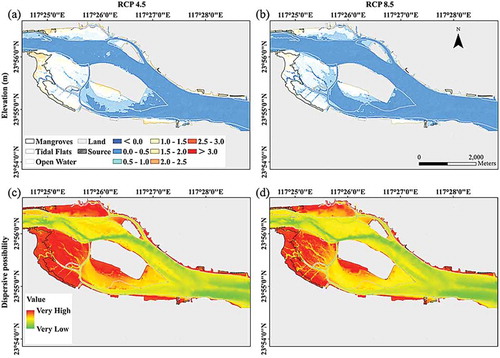
According to the current surface sediment elevation in the estuary, the potential population establishment of S. apetala in Zhangjiang Estuary under the RCP 4.5 and 8.5 scenarios in 2100 is presented in . The model provided a semi-empirical indication of the conditions under which S. apetala would be likely to colonize throughout Zhangjiang Estuary, especially in the tidal mudflats or under the canopy of the mangrove forests. We did not consider the pattern of salinity in the model because the distribution of salinity throughout the entire estuary was always within the salinity threshold of S. apetala germination and early growth. Compared to the current surface sediment elevation ()), the future area with the elevation above the MSL would slightly decline under the RCP 4.5 scenarios, which might decrease the establishment potential area of S. apetala seedlings by 2% throughout the estuary (44% currently vs. 42% under the RCP 4.5 scenarios) (,), Table S2). In contrast, under the RCP 8.5 scenarios, the potential establishment would significantly decrease to 30% of the mudflat area by 2100 in the whole estuary (,), Table S2).
Figure 6. Prediction of sediment elevation in 2100 under the mean sea-level rise of (a) the IPCC RCP 4.5 and (b) RCP 8.5 scenarios and the potential S. apetala seedling dispersal under (c) the RCP 4.5 and (d) RCP 8.5 scenarios in Zhangjiang Estuary.
Discussion
In the context of global changes, species migration and range expansion are among the most consequential effects in mangroves facing warming and SLR (Saintilan et al. Citation2014; Coldren and Proffitt Citation2017). Hydrological conditions, such as tidal inundation and salinity, are the critical drivers that shape mangrove community structure at regional or local scales (Lugo and Snedaker Citation1974; Knight et al. Citation2008). Tidal currents can also disturb the community structure by expanding the floating propagules (Van der Stocken et al. Citation2019). The cause of non-native mangrove invasion is primarily caused by tidal currents at the regional estuary scale (Allen, Krauss, and Hauff Citation2003). Thus, the invasion of non-native S. apetala is greatly benefitted by the hydroperiods and tidal currents, especially at local estuary scales. In this study, by combining evidence on species distribution from field surveys and seedling responses from simulated experiments, we projected the geographical expansion patterns of S. apetala according to estuary hydrological models across the entire geographical region. SLR scenarios were further used to predict future dispersal patterns under SLR conditions, which greatly expanded our knowledge on invasiveness assessments.
Hydrological elements as a driving force of propagule dispersal
The structure and function of a mangrove community are closely driven by hydrological elements due to the specific habitats of mangroves at the boundary of land and sea (Alongi and Brinkman Citation2011). Hydrology is a geophysical driver of plant population dynamics and community structure in aquatic plant communities (Di Nitto et al. Citation2013). Mangrove species are well adapted to tidal conditions and able to establish in shallow-water areas through their propagules (Alongi and Brinkman Citation2011). Thus, tidal currents are the driving force of the non-native S. apetala propagule dispersal in Zhangjiang Estuary. The floating characteristic of propagules also limits propagule dispersal distance (Wang, Li, and Wang Citation2019). Species-specific propagule dispersal characteristics enable different floating periods and dispersal distances of propagules (Van der Stocken et al. Citation2019). Previous studies determined that the smaller propagules of Laguncularia were able to move a longer distance in tidal or oceanic currents compared to the distance traveled by the larger propagules of Avicennia and Rhizophora (Sousa et al. Citation2007). The low density of S. apetala fruit and its small seeds with lignified episperm led to their long-term floating ability and long-distance dispersal (Chen Citation2019).
The FVCOM model was run in September in the current study, which represented the period with a strong hydrodynamic force in Zhangjiang Estuary for the year. The tide of the whole estuary was gradually lower after the period of highest tide throughout half of September (Fig. S5), which created a WoO for S. apetala dispersal. This month is also the full fruiting time of the non-native S. apetala trees in this region. The results from the FVCOM model on propagule dispersal confirmed the importance of tidal currents and propagule floating characteristics. Many fruits and seeds were directed toward the mudflat and creek edges after a few tidal cycles (), which further indicated the high potential for the non-native S. apetala to invade the whole estuary after one week of projecting. Thus, some effective actions should be implemented to manage biological invasions in this estuary, especially in the autumn.
In addition, these predicted results were consistent with a supply-side theory of community structure, the “tidal sorting hypothesis (TSH)” in Rabinowitz (Citation1978). The dispersing propagules could be carried by tidal currents to high-elevation zones, but their dispersal was strong toward the edges of estuaries (Sousa et al. Citation2007; Di Nitto et al. Citation2013). Nevertheless, the propagule dispersal typically occurred in some areas with a small tidal range or high seasonal rainfall (Sousa et al. Citation2007), which was also attributed to the directional movement of the tidal currents (Levine and Murrell Citation2003).
Environmental and topographic elements as selection forces for population establishment
In addition to the hydrodynamics (i.e. waves and currents) and biogeomorphic conditions (i.e. sediment dynamics in erosion or accretion) as a bottleneck for seedling establishment (Balke et al. Citation2011; Balke, Herman, and Bouma Citation2014), the tolerance to stresses in estuarine habitats is also driving successful establishment of halophytes (Krauss, Doyle, and Howard Citation2009). Previous studies indicated that a minimum required five subsequent inundation-free days in tidal wetlands to anchor for the seedlings of Rhizophora species (Balke et al. Citation2011; Balke, Herman, and Bouma Citation2014). Nevertheless, seeds of pioneer species of Sonneratia species took two or three days to germinate, which was shorter relative to that of Rhizophora species (Chen Citation2019). Combined with the environmental and topographic elements of WoO in September and the biological traits of Sonneratia apetala (the fruiting season and high germination), Zhangjiang Estuary provided successful invading conditions.
In this study, seed germination was significantly inhibited by increasing salinity, where the highest germination percentages were found under the 0 and 10 PSU treatments. The mechanism of inhibited germination under high salinity was related to insufficient water absorption or toxic effects (Mazher, El-Quesni, and Farahat Citation2007). Some studies have indicated that seedling salt tolerance relies on the growth and developmental stages of some halophytes, which were more sensitive in the seedling stage than in other stages (Manikandan, Neelakandan, and Rani Citation2009). These results were similar to those for other non-viviparous mangrove species in which high salinity depressed both germination and hypocotyl growth (Peng et al. Citation2016). A large portion of the biomass was allocated to the roots of S. apetala seedlings in low and intermediate salinity regimes ()). The autotrophic processes were also inhibited by high salinity; therefore, plants had to expand root growth and increase the area of absorption to obtain more nutrients. Moreover, the increasing root/shoot ratio decreased transpiration, maintained the osmotic pressure balance, and then further promoted mobility of the ions (Feller Citation1995).
In the marsh organ experiment, S. apetala seedlings grew poorly at the lowest elevation treatment with the longest tidal flooding of the RCP 8.5 scenarios with over 10 h of flooding every day. However, the best seedling growth with the largest basal stem diameter was found in the RCP 4.5 treatment. A previous study showed that some mangrove pioneer species in the Avicennia and Sonneratia genera colonized better in the low-elevation fringe zone than in the higher-elevation tidal zones (Friess et al. Citation2012; Sasmito et al. Citation2016). Moderate inundation stimulated stem elongation allowed leaves to escape tidal immersion and maintain photosynthesis in the Sonneratia genus (Chen et al. Citation2013). Thus, the moderate SLR treatment of the RCP 4.5 scenarios was suitable for S. apetala seedlings grown in the current study, which suggested that the mudflat at the mangrove sea edge would be the most likely colonized area for new S. apetala individuals. Therefore, the increasing tidal inundation period and water salinity due to moderate sea-level rise will enhance the establishment of the non-native S. apetala.
Mangrove zonation along the intertidal zones under SLR was the result of plant tolerance to the synergistic effects of tidal inundation and salinity (Lugo and Snedaker Citation1974). Forest establishment based on seedling colonization under changing sea levels also significantly depended on the synergistic effects of tidal inundation and salinity (Chen and Wang Citation2017). In Zhangjiang Estuary, the salinity ranges (surface soil salinity of 2 ~ 12 PSU and porewater salinity of 0 ~ 26 PSU) of the S. apetala individuals were within the salinity thresholds of our simulated experiments. Consistent with this scenario, the micro-topographic model predicted marked seaward migration and niche expansion under the RCP 4.5 scenarios and a low invasive potential under the RCP 8.5 scenarios (). Under the RCP 4.5 scenarios, the potential population establishment region of S. apetala will be mainly located throughout the mudflats. With good inter-species competition with native mangrove species (Chen Citation2019), the non-native S. apetala would consequently enlarge the invasive area in Zhangjiang Estuary. However, these changes could cause the inhibition of early seedling growth in the rapid SLR scenario RCP 8.5, and the depressed plant growth- and biomass accumulation based on the marsh organ results would sharply reduce the invasive potential of this species in Zhangjiang Estuary. Thus, shifts in geographic ranges are the most immediate with environmental changes (Thuiller, Richardson, and Midgley Citation2007).
Upscaling from the estuarine scale to the latitudinal landscape of mangrove invasion
Propagule dispersal and seedling establishment are two key stages for a successful invasive plant (Pergl et al. Citation2011). Due to the specific environmental factors in mangrove ecosystems, these two stages of mangrove ecosystems experience more influencing factors than those of terrestrial plant species. Given the importance of local-scale micro-topographic and hydrological conditions in predicting plant invasions, our study highlighted the usage of estuary models by projecting these two key stages for mangrove invasion. The micro-topographic elements based on the estuarine scale integrated sediment surface elevation, salinity gradient and plant responses and provided precise predictions of invasive patterns in future SLR scenarios. Our predictions were consistent with our previous knowledge of fine-scale in situ measurements and simulated experiments (Ren et al. Citation2009; Chen et al. Citation2013; Peng et al. Citation2018) and provided a future visual pattern of invasiveness. The outputs of the models also address the knowledge gaps between scientific results and forest management. Assuming a management regime that removes this species, the location (mangrove mudflat with exact elevational ranges) and time (before fruit mature time and large tidal currents) for this action were easily determined, even under various SLR scenarios. When considering mangrove responses to SLR, local-scale predictions along the zone from the seaward edge to the landward edge are sensitive to inundation conditions (Krauss et al. Citation2014). Furthermore, remarkable inter-species competition between the non-native S. apetala and native mangroves species were shown, where the S. apetala might obtain dominant position in the same estuary of this study without management (Peng et al. Citation2018).
An increasing number of models have focused on poleward migration at a large latitudinal scale in the context of climate change. Congruent forecasts of climatic impacts driven by warming, precipitation or extreme weather events (e.g. Osland et al. Citation2017) are often viewed as more likely to result in range expansion than local-scale predictions. For biological invasions, it is extremely likely that if keystone species experience population declines under climate change, then the susceptibility of introduced populations will increase and disrupt the ecosystem function processes (Zavaleta and Hulvey Citation2004; Thuiller, Richardson, and Midgley Citation2007). Increasing invasive species with high performance may be depressed (Sheppard, Burns, and Stanley Citation2014) or promoted (Colwell et al. Citation2008) under climate change. Upscaling local-scale modeling to a latitudinal landscape might represent a step forward in forecasting the invasiveness of non-native mangroves and improving the approaches to control biological invasions. Non-native species monitoring along all the estuary as well as hydrological and climatic models should be implemented.
Supplemental Material
Download MS Word (7.8 MB)Acknowledgements
The authors thank Congjiao Peng, Hewei Zhao, Chenjuan Zheng, Pubin Hong, Jiamin Zong, Dan Peng, Qichong Zhu, Jiwei Qian, Lian Xu and Ruzhi Wu for their assistants in the field survey and in greenhouse experiments.
Disclosure statement
No potential conflict of interest was reported by the authors.
Supplementary material
Supplemental data for this article can be accessed here.
Additional information
Funding
References
- Allen, J. A. 1998. “Mangroves as Alien Species: The Case of Hawaii.” Global Ecology and Biogeography Letters 7 (1): 61–14. doi:10.2307/2997698.
- Allen, J. A., K. W. Krauss, and R. D. Hauff. 2003. “Factors Limiting the Intertidal Distribution of the Mangrove Species Xylocarpus Granatum..” Oecologia 135 (1): 110–121. doi:10.1007/s00442-002-1167-2.
- Alongi, D. M., and R. Brinkman. 2011. “Hydrology and Biogeochemistry of Mangrove Forests.” Forest Hydrology and Biogeochemistry 216: 203–219. doi:10.1007/978-94-007-1363-5_10.
- Balke, T., T. J. Bouma, E. M. Horstman, E. L. Webb, P. L. A. Erftemeijer, and P. M. J. Herman. 2011. “Windows of Opportunity: Thresholds to Mangrove Seedling Establishment on Tidal Flats.” Marine Ecology Progress Series 440: 1–9. doi:10.3354/meps09364.
- Balke, T., P. M. J. Herman, and T. J. Bouma. 2014. “Critical Transitions in Disturbance-driven Ecosystems: Identifying Windows of Opportunity for Recovery.” Journal of Ecology 102: 700–708. doi:10.1111/1365-2745.12241.
- Ball, M. 1998. “Mangrove Species Richness in Relation to Salinity and Waterlogging: A Case Study along the Adelaide River Floodplain, Northern Australia.” Global Ecology and Biogeography Letters 7 (1): 73–82. doi:10.2307/2997699.
- Ball, M. 2002. “Interactive Effects of Salinity and Irradiance on Growth: Implications for Mangrove Forest Structure along Salinity Gradients.” Trees-Struct and Function 16 (2–3): 126–139. doi:10.1007/s00468-002-0169-3.
- Ball, M. C., and S. M. Pidsley. 1995. “Growth Responses to Salinity in Relation to Distribution of Two Mangrove Species, Sonneratia Alba and S. Lanceolata, in Northern Australia.” Functional Ecology 9 (1): 77–85. doi:10.2307/2390093.
- Barik, J., A. Mukhopadhyay, T. Ghosh, S. K. Mukhopadhyay, S. M. Chowdhury, and S. Hazra. 2018. “Mangrove Species Distribution and Water Salinity: An Indicator Species Approach to Sundarban.” Journal of Coastal Conservation 22 (2): 361–368. doi:10.1007/s11852-017-0584-7.
- Buchanan, S. M., and J. Triantafilis. 2009. “Mapping Water Table Depth Using Geophysical and Environmental Variables.” Ground Water 47 (1): 80–96. doi:10.1111/j.1745-6584.2008.00490.x.
- Chen, C., R. C. Beardsley, and G. Cowles. 2006. “An Unstructured Grid, Finite-volume Coastal Ocean Model (FVCOM) System.” Oceanography 19 (1): 78–89. doi:10.5670/oceanog.2006.92.
- Chen, F. W., and C. W. Liu. 2012. “Estimation of the Spatial Rainfall Distribution Using Inverse Distance Weighting (IDW) in the Middle of Taiwan.” Paddy and Water Environment 10: 209–222. doi:10.1007/s10333-012-0319-1.
- Chen, L. 2019. “Invasive Plants in Coastal Wetlands: Patterns and Mechanisms.” In Wetlands: Ecosystem Services, Restoration and Wise Use, edited by S. An and J. T. A. Verhoeven, 97–128. New York: Springer Cham. doi:10.1007/978-3-030-14861-4_5.
- Chen, L., N. F. Y. Tam, J. Huang, X. Zeng, X. Meng, C. Zhong, Y. Wong, and G. Lin. 2008. “Comparison of Ecophysiological Characteristics between Introduced and Indigenous Mangrove Species in China.” Estuarine Coastal and Shelf Science 79: 644–652. doi:10.1016/j.ecss.2008.06.003.
- Chen, L., N. F. Y. Tam, W. Wang, Y. Zhang, and G. Lin. 2013. “Significant Niche Overlap between Native and Exotic Sonneratia Mangrove Species along a Continuum of Varying Inundation Periods.” Estuarine Coastal and Shelf Science 117: 22–28. doi:10.1016/j.ecss.2012.09.009.
- Chen, L., and W. Wang. 2017. “Ecophysiological Responses of Viviparous Mangrove Rhizophora Stylosa Seedlings to Simulated Sea-level Rise.” Journal of Coastal Research 336: 1333–1341. doi:10.2112/JCOASTRES-D-16-00131.1.
- Coldren, G. A., and C. E. Proffitt. 2017. “Mangrove Seedling Freeze Tolerance Depends on Salt Marsh Presence, Species, Salinity, and Age.” Hydrobiologia 803 (1): 159–171. doi:10.1007/s10750-017-3175-6.
- Colwell, R., G. Brehm, S. C. Cardelu, A. C. Gilman, and J. T. Longino. 2008. “Global Warming, Elevational Range Shifts, and Lowland Biotic Attrition in the Wet Tropics.” Science 322 (5899): 258–261. doi:10.1126/science.1162547.
- Di Nitto, D., P. L. A. Erftemeijer, J. K. L. van Beek, F. Dahdouh-Guebas, L. Higazi, K. Quisthoudt, L. P. Jayatissa, and N. Koedam. 2013. “Modelling Drivers of Mangrove Propagule Dispersal and Restoration of Abandoned Shrimp Farms.” Biogeosciences 10 (7): 5095–5113. doi:10.5194/bg-10-5095-2013.
- Emadi, M., and M. Baghernejad. 2014. “Comparison of Spatial Interpolation Techniques for Mapping Soil pH and Salinity in Agricultural Coastal Areas, Northern Iran.” Archives of Agronomy and Soil Science 60 (9): 1315–1327. doi:10.1080/03650340.2014.880837.
- Feller, I. C. 1995. “Effects of Nutrient Enrichment on Growth and Herbivory of Dwarf Red Mangrove (Rhizophora Mangle).” Ecological Monographs 65 (4): 477–505. doi:10.2307/2963499.
- Fourqurean, J. W., T. J. Smith, J. Possley, T. M. Collins, D. Lee, and S. Namoff. 2010. “Are Mangroves in the Tropical Atlantic Ripe for Invasion? Exotic Mangrove Trees in the Forests of South Florida.” Biological Invasions 12 (8): 2509–2522. doi:10.1007/s10530-009-9660-8.
- Friess, D. A., K. W. Krauss, E. M. Horstman, T. Balke, T. J. Bouma, D. Galli, and E. L. Webb. 2012. “Are All Intertidal Wetlands Naturally Created Equal? Bottlenecks, Thresholds and Knowledge Gaps to Mangrove and Saltmarsh Ecosystems.” Biological Reviews 87 (2): 346–366. doi:10.1111/j.1469-185X.2011.00198.x.
- Greenberg, C. H., L. M. Smith, and D. J. Levey. 2001. “Fruit Fate, Seed Germination and Growth of an Invasive Vine - an Experimental Test of ‘Sit and Wait’ Strategy.” Biological Invasions 3 (4): 363–372. doi:10.1023/A:1015857721486.
- Harley, C. D. G., A. R. Hughes, K. M. Hultgren, B. G. Miner, C. J. B. Sorte, C. S. Thornber, L. F. Rodriguez, L. Tomanek, and S. L. Williams. 2006. “The Impacts of Climate Change in Coastal Marine Systems.” Ecology Letters 9 (2): 228–241. doi:10.1111/j.1461-0248.2005.00871.x.
- Hong, P., Y. Wen, Y. Xiong, L. Diao, X. Gu, H. Feng, and L. Chen. 2020. “Latitudinal Gradients and Climatic Controls on Reproduction and Dispersal of the Non-native Mangrove Sonneratia Apetala in China”. Estuarine, Coastal and Shelf Science. in press. doi:10.1016/j.ecss.2020.106749.
- Hu, Z., J. van Belzen, D. van der Wai, T. Balke, Z. Wangm, M. Stive, and T. J. Bouma. 2015. “Windows of Opportunity for Salt Marsh Vegetation Establishment on Bare Tidal Flats: The Importance of Temporal and Spatial Variability in Hydrodynamic Forcing.” Journal of Geophysical Research: Biogeosciences 120 (7): 1450–1469. doi:10.1002/2014JG002870.
- IPCC. 2014. “Topic 2: Future Climate Changes, Risk and Impacts”. In Climate Change 2014: Synthesis Report. Geneva, R. K. Pachauri, othersedited by, 151. The Fifth Assessment Report of the Intergovernmental Panel on Climate Change. New York: Cambridge University Press. IPCC: doi:10.1111/j.1728-4457.2001.00203.x
- Knight, J. M., P. E. R. Dale, R. J. K. Dunn, G. J. Broadbent, and C. J. Lemckert. 2008. “Patterns of Tidal Flooding within a Mangrove Forest: Coombabah Lake, Southeast Queensland, Australia.” Estuarine Coastal and Shelf Science 76 (3): 580–593. doi:10.1016/j.ecss.2007.07.044.
- Krauss, K. W., T. W. Doyle, and R. J. Howard. 2009. “Is There Evidence of Adaptation to Tidal Flooding in Saplings of Baldcypress Subjected to Different Salinity Regimes?” Environmental and Experimental Botany 67 (1): 118–126. doi:10.1016/j.envexpbot.2009.05.005.
- Krauss, K. W., K. L. Mckee, C. E. Lovelock, D. R. Cahoon, N. Saintilan, R. Reef, and L. Chen. 2014. “How Mangrove Forests Adjust to Rising Sea Level.” New Phytologist 202 (1): 19–34. doi:10.1111/nph.12605.
- Lai, C. D. 2014. “Generalized Weibull Distributions.” Germany: Springer-Verlag Berlin Heidelberg. doi:10.1007/978-3-642-39106-4_2.
- Levine, J. M., and D. J. Murrell. 2003. “The Community-level Consequences of Seed Dispersal Patterns. Annual Review of Ecology.” Evolution, and Systematics 34 (1): 549–574. doi:10.1146/annurev.ecolsys.34.011802.132400.
- Lovelock, C. E., D. R. Cahoon, D. A. Friess, G. R. Guntenspergen, K. W. Krauss, R. Reed, K. Rogers, et al. 2015. “The Vulnerability of Indo-pacific Mangrove Forests to Sea-level Rise.” Nature 526: 559–563. doi:10.1038/nature15538.
- Lugo, A. E., and S. C. Snedaker. 1974. “The Ecology of Mangroves.” Annual Review of Ecology and Systematics 5 (1): 39–64. doi:10.1146/annurev.es.05.110174.000351.
- Manikandan, T., T. Neelakandan, and G. U. Rani. 2009. “Antibacterial Activity of Salicornia Brachiata, a Halophyte.” Journal of Phytology 1: 441–443.
- Mazher, A. M. A., E. M. F. El-Quesni, and M. M. Farahat. 2007. “Responses of Ornamental Plants and Woody Trees to Salinity.” World Journal of Agricultural Sciences 3: 386–395.
- Mckee, K. L., and W. C. Vervaeke. 2017. “Will Fluctuations in Salt Marsh–mangrove Dominance Alter Vulnerability of a Subtropical Wetland to Sea‐level Rise.” Global Change Biology 24 (3): 1224–1238. doi:10.1111/gcb.13945.
- Mikolaev, Y. O., E. S. Bernal, J. B. Baños, M. O. Escobar, and J. G. Hernandez. 2016. “Saline Year-gradients in the Lagoon “La Salina,” Tonameca, Oaxaca, Mexico: Effects on Growth of Mangrove Biotope.” Water Air and Soil Pollution 227 (11): 426–442. doi:10.1007/s11270-016-3133-3.
- Morris, J. T., K. Sundberg, and C. S. Hopkinson. 2013. “Salt Marsh Primary Production and Its Responses to Relative Sea Level and Nutrients in Estuaries at Plum Island, Massachusetts, and North Inlet, South Carolina, USA.” Oceanography 26 (3): 78–84. doi:10.5670/oceanog.2013.48.
- Osland, M. J., L. C. Feher, K. T. Griffith, K. C. Cavanagh, N. M. Enwright, R. H. Day, C. L. Stagg, et al. 2017. “Climatic Controls on the Global Distribution, Abundance, and Species Richness of Mangrove Forests.” Ecological Monographs 87 (2): 341–359. doi:10.1002/ecm.1248.
- Palmer, M., and A. Ruhi. 2019. “Linkages between Flow Regime, Biota, and Ecosystem Processes: Implications for River Restoration.” Sicence 6459 (365): 1264–1277. doi:10.1126/science.aaw2087.
- Peng, D., L. Z. Chen, S. C. Pennings, and Y. H. Zhang. 2018. “Using a Marsh Organ to Predict Future Plant Communities in a Chinese Estuary Invaded by an Exotic Grass and Mangrove.” Limnology and Oceanography 63 (6): 2595–2605. doi:10.1002/lno.10962.
- Peng, Y. S., J. M. Diao, M. X. Zheng, D. S. Guan, R. D. Zhang, G. Z. Chen, and S. Y. Lee. 2016. “Early Growth Adaptability of Four Mangrove Species under the Canopy of an Introduced Mangrove Plantation: Implications for Restoration.” Forest Ecology and Management 373: 179–188. doi:10.1016/j.foreco.2016.04.044.
- Pergl, J., J. Mullerova, I. Perglova, T. Herben, and P. Pysek. 2011. “The Role of Long‐distance Seed Dispersal in the Local Population Dynamics of an Invasive Plant Species.” Diversity and Distributions 17 (4): 725–738. doi:10.1111/j.1472-4642.2011.00771.x.
- Qu, Y., S. Jevrejeva, L. P. Jackson, and J. C. Moore. 2019. “Coastal Sea Level Rise around the China Seas.” Global and Planetary Change 172: 454–463. doi:10.1016/j.gloplacha.2018.11.005.
- Rabinowitz, D. 1978. “Early Growth of Mangrove Seedlings in Panama and a Hypothesis Concerning the Relationship of Dispersal and Zonation.” Journal of Biogeography 5 (2): 113–133. doi:10.2307/3038167.
- Reichard, S. H., and C. W. Hamilton. 1997. “Predicting Invasions of Woody Plants Introduced into North America.” Conservation Biology 11 (1): 193–203. doi:10.1046/j.1523-1739.1997.95473.x.
- Ren, H., H. F. Lu, W. J. Shen, C. Huang, Q. F. Guo, Z. A. Li, and S. G. Jian. 2009. “Sonneratia Apetala Buch.Ham in the Mangrove Ecosystems of China: An Invasive Species or Restoration Species.” Ecological Engineering 35 (8): 1243–1248. doi:10.1016/j.ecoleng.2009.05.008.
- Saintilan, N., N. C. Wilson, K. Rogers, A. Rajkaran, and K. W. Krauss. 2014. “Mangrove Expansion and Salt Marsh Decline at Mangrove Poleward Limits.” Global Change Biology 20 (1): 147–157. doi:10.1111/gcb.12341.
- Sasmito, S. D., D. Murdiyarso, D. A. Friess, and S. Kurnianto. 2016. “Can Mangroves Keep Pace with Contemporary Sea Level Rise? A Global Data Review.” Wetlands Ecology and Management 24 (2): 263–278. doi:10.1007/s11273-015-9466-7.
- Sheppard, C. S., B. R. Burns, and M. C. Stanley. 2014. “Predicting Plant Invasions under Climate Change: Are Species Distribution Models Validated by Field Trials?” Global Change Biology 20 (9): 2800–2814. doi:10.1111/gcb.12531.
- Slavich, P. G., and G. H. Petterson. 1990. “Estimating Average Rootzone Salinity from Electromagnetic Induction (EM-38) Measurements.” Australian Journal of Soil Research 28 (3): 453–463. doi:10.1071/SR9900453.
- Smith, F., and D. W. Hoeppner. 1990. “Use of the 4-parameter Weibull Function for Fitting Fatigue and Compliance Calibration Data.” Engineering Fracture Mechanics 36 (1): 173–178. doi:10.1016/0013-7944(90)90107-R.
- Sousa, W. P., P. G. Kennedy, B. J. Mitchell, and B. M. Ordonez. 2007. “Supply-side Ecology in Mangroves: Do Propagule Dispersal and Seedling Establishment Explain Forest Structure?” Ecological Monographs 77 (1): 53–76. doi:10.1890/05-1935.
- Stringer, C. E., M. C. Rains, S. Kruse, and D. Whigham. 2010. “Controls on Water Levels and Salinity in a Barrier Island Mangrove, Indian River Lagoon, Florida.” Wetlands 30 (4): 725–734. doi:10.1007/s13157-010-0072-4.
- Thuiller, W., D. W. Richardson, and G. F. Midgley. 2007. “Will Climate Change Promote Alien Plant Invasions?” In Biological Invasions, edited by W. Nentwig, 197–211. Berlin: Springer. doi:10.1007/978-3-540-36920-2_12.
- Van der Stocken, T., A. K. S. Wee, D. J. R. De Ryck, B. Vanschoenwinkel, D. A. Friess, F. Dahdouh-Guebas, M. Simard, N. Koedam, and E. L. Webb. 2019. “A General Framework for Propagule Dispersal in Mangroves.” Biological Reviews 94: 1547–1575. doi:10.1111/brv.12514.
- Wang, W. Q., X. F. Li, and M. Wang. 2019. “Propagule Dispersal Determines Mangrove Zonation at Intertidal and Estuarine Scales.” Forests 10 (3): 245. doi:10.3390/f10030245.
- Watson, J. G. 1928. “Mangrove Forests of the Malay Peninsula.” Malay Forest Records 6: 1–275.
- Woodroffe, C. D., C. E. Lovelock, and K. Rogers. 2015. “Mangrove Shorelines.” In Coastal Environments and Global Change, edited by G. Masselink and K. Gehrels, 251–267. USA: John Wiley and Sons. doi:10.1002/9781119117261.ch11.
- Zavaleta, E. S., and K. B. Hulvey. 2004. “Realistic Species Losses Disproportionately Reduce Grassland Resistance to Biological Invaders.” Science 306: 1175–1177. doi:10.1126/science.1102643.
- Zhang, Y., G. Huang, W. Wang, L. Chen, and G. Lin. 2012. “Interactions between Mangroves and Exotic Spartina in an Anthropogenically Disturbed Estuary in Southern China.” Ecology 93 (3): 588–597. doi:10.1890/11-1302.1.
- Zhu, X., Y. Hou, Q. Weng, and L. Chen. 2019. “Integrating UAV Optical Imagery and LiDAR Data for Assessing the Spatial Relationship between Mangrove and Inundation across a Subtropical Estuarine Wetland.” ISPRS Journal of Photogrammetry and Remote Sensing 149: 146–156. doi:10.1016/j.isprsjprs.2019.01.021.