
ABSTRACT
This paper develops a risk table to facilitate incorporation of additional information into the fisheries stock assessment and management process. The risk table is designed to evaluate unanticipated ecosystem and environmental impacts on marine resources that may require a rapid management response. The risk table is a standardized framework to document concerns about the assessment model, population dynamics, and the ecosystem/environment that are not explicitly addressed within the stock assessment model. A scoring procedure is used to evaluate the severity of the concern. These concerns can then be evaluated in support for or against a reduction from the maximum Acceptable Biological Catch while providing reviewers and stakeholders transparent documentation of the concerns. The risk table was applied successfully to several stocks on a trial basis during the 2018 groundfish assessment cycle for the North Pacific Fishery Management Council, and will be used for all full groundfish assessments in 2019. Rapid changes in climate are likely for Alaska marine ecosystems in coming decades, and these changes are not entirely predicable. Therefore, we avocate that the risk table approach should be included in the suite of management tools used to address the effects of climate change on Alaska marine resources.
Introduction
Alaska supports the largest groundfish fisheries in the United States (Fissel et al. Citation2019) and represents 75% of the US Exclusive Economic Zone. Overall, marine waters of Alaska are well studied, and an ecosystem approach to management of federal fisheries is well established (Hollowed et al. Citation2011). However in recent years, Alaska has experienced changes in marine ecosystems that represent unprecedented conditions. For example, in the Gulf of Alaska an extreme marine heatwave continued from 2014 to 2016 (Bond et al. Citation2015), and in the northern Bering Sea, there was an unprecedented near-complete lack of winter sea ice during the winters 2017/18 and 2018/19. These changes impacted groundfish population dynamics through increased mortality (e.g., Gulf of Alaska (GOA) Pacific cod Gadus microcephalus; Citation2020), a shift in the distribution of Pacific cod to deeper water (Yang et al. Citation2019), and northward range expansions (e.g., eastern Bering Sea (EBS) walleye pollock Gadus chalcogrammus and Pacific cod; Thorson Citation2019, Stevenson and Lauth Citation2019). These extreme events have created challenges for scientists, managers, industry, and residents both in the annual process of stock assessment and harvest specification, and in the long-term strategic aspects of fisheries management (Citation2020). In this paper, we describe a new method employed by the North Pacific Fishery Management Council (NPFMC) in 2018 to facilitate the communication of ecosystem information, as well as uncertainty related to stock assessment models, in a transparent and consistent manner to inform management by enhancing understanding of the ecosystem context for decision-making.
The NPFMC is an advisory body that makes fisheries management recommendations for federal fisheries in Alaska under a process established by the Magnuson–Stevens Fishery Conservation and Management Act. Each year the NPFMC makes catch recommendations based on stock assessments that are produced by fisheries scientists at the National Oceanic and Atmospheric Administration (NOAA Fisheries) and the Alaska Department of Fish and Game. In every December, stock assessments are used to establish two types of catch reference points for the upcoming year and the following year: the overfishing limit (OFL) and the acceptable biological catch (ABC) (NPFMC Citation2018a, NPFMC Citation2018b). The OFL is a level of catch that should not be exceeded, while the ABC is a lower catch level that accounts for scientific uncertainty in the overfishing level. The buffer between the OFL and ABC is determined by a tier system in which each groundfish stock or stock complex is assigned to a tier level that specifies the harvest control rules used to establish the OFL and ABC (DiCosimo, Methot, and Ormseth Citation2010; North Pacific Fishery Management Council (NPFMC) Citation2018a, Citation2018b). The tiers range from one to six, depending on the availability of stock information and the ability to reliably estimate management quantities such as maximum sustainable yield (MSY) and stock-recruit relationships. Information and data-rich stock assessments are in tier 1 in which reliable estimates of MSY and MSY stock size are available, while lower tiers are used for stocks in which estimates of these quantities are not available and proxies are used instead. Most stocks with age-structured assessments are in tier 3, where the OFL and ABC are calculated using proxies for the MSY fishing mortality rate based on spawning biomass per recruit. For tier 4 stocks, OFLs and ABCs are obtained by multiplying survey biomass by proxies for the MSY fishing mortality rate based on spawning biomass per recruit, while for tier 5 stocks, OFLs and ABCs are obtained by multiplying survey biomass by an estimate of natural mortality. Tier 6 stocks are based on average catch over a specified time period. Tiers 2 is predicated on the availability of a specific set of information that in practice does not occur and consequently is not used.
In parallel with stock assessments, NOAA Fisheries scientists prepare ecosystem status reports that analyze status and trends of indicators to provide assessments of ecosystem conditions to the NPFMC (Zador et al. Citation2017). Separate reports are prepared for each large marine ecosystem (Sherman Citation1991; PAME Citation2013), i.e., Eastern Bering Sea, Aleutian Islands, and Gulf of Alaska. The ecosystem indicators range from metrics of climate to biology to human dimensions and are considered prior to reviews of individual stock assessments during annual assessment cycles.
An explicit part of the NPFMC stock assessment process is an evaluation of whether it is appropriate to reduce the ABC from the maximum permissible ABC that results from application of the harvest control rules in the tier system. As described in both the Bering Sea/Aleutian Islands (BSAI) and GOA groundfish Fishery Management Plans (North Pacific Fishery Management Council (NPFMC) Citation2018a and North Pacific Fishery Management Council (NPFMC) Citation2018b), groundfish stock assessments should “determine whether conditions exist that warrant setting ABC at a value lower than the maximum permissible value (such conditions may include – but are not limited to – data uncertainty, recruitment variability, and declining population trend) and, if so
document those conditions,
recommend an ABC lower than the maximum permissible value, and
explain why the recommended value is appropriate.”
The above steps are undertaken first by the assessment authors of the individual stock assessments. The ABC recommendations then pass through two levels of scientific review to establish the final recommended ABCs: 1) the Groundfish Plan Teams (Plan Teams) and 2) the Scientific and Statistical Committee (SSC) of the NPFMC. The NPFMC then sets final catch levels as Total Allowable Catch (TACs) with the constraint that the TAC for a stock may not exceed the final ABC recommended by the SSC for that stock.
The NPFMC tier system uses the buffer between the OFL and ABC to implement precautionary management and provide a preferred degree of conservatism, given the uncertainty that is present in stock assessments. Consequently, the rationale for a reduction from the maximum permissible ABC should be that there is either additional uncertainty in the assessment and/or additional risks (probability of something bad happening) to the stock that are not adequately taken into account by the default precautionary settings. For example, in 2006 a reduced ABC for EBS walleye pollock was justified in part due to an increase in biomass of juvenile pollock predators and an apparent lack of pollock prey (Zador et al. Citation2017). The SSC’s intent is that setting the ABC below the maximum permissible should be applied sparingly and that the tier system should be regarded as the primary basis for establishing the ABC. It is also important to note that the sloping harvest control rule for the ABC will substantially reduce the harvest rate when the stock is at a low abundance (). This reduction in harvest rate is intended to address the concerns related to low stock abundance.
Figure 1. Harvest control rule for NPFMC Tier 3 stocks where F35% is considered a proxy for FMSY showing the buffer between the ABC and OFL, and how fishing mortality is ramped downwards as stock size declines.
The process of considering whether to reduce the ABC below the maximum permissible is a long-standing aspect of scientific advice that is provided to the NPFMC. However, the magnitude of the reduction and the criteria used to justify the reduction have not been standardized across groundfish species. The NPFMC SSC, therefore, encouraged the development of a more objective and rigorous process for considering ABC reductions that included a review of both stock assessment and ecosystem factors. In February 2018, the NPFMC SSC requested that a workshop be held to address the topic of adjustments made from the maximum permissible ABC, and asked for the identification of clear and transparent rules for defining the specific criteria to be used when adjusting the ABC. This paper describes a proposed procedure that attempts to address these issues. However, first we identified three general approaches that might be used as a rationale for making adjustments to the ABC:
Make reductions on a case-by-case basis as deemed appropriate with rationale provided concurrently (status quo).
Establish a framework with guidelines and criteria. Reductions are based on applying the framework.
Use of an analytical approach that produces a reduction in the ABC. A simple example is the P* method (Shertzer, Prager, and Williams Citation2010), in which an increase in assessment uncertainty results in a larger buffer being applied. Other analytical approaches may include models with environmental covariates, multispecies models, or ecosystem models. A management strategy evaluation could be done to provide analysis of tradeoffs between adopting different management actions to deal with uncertainty or risk.
The case-by-case approach provides maximum flexibility but is also subject to being applied inconsistently across stocks (see below). Use of a framework promotes consistency and transparency, but does not evaluate tradeoffs between potential actions. Although the analytical approach has several desirable qualities, the necessary modeling to implement such an approach is complex and time-consuming, and would be difficult to complete within the truncated time frame necessary for fisheries management decision-making. Furthermore, the analytical approach would require rigorous testing before it could be implemented, so an interim qualitative approach based on expert knowledge was deemed an improvement over the status quo. Even if an analytical approach were to be adopted, it seems unlikely that it would be able to deal with every situation, given that unexpected events are often the impetus for additional precaution.
To provide an overview of historical practice of recommending ABCs less than the maximum permissible, Thompson (Citation2018) reviewed the annual stock assessments from 2003 to 2017 and identified all instances when the Plan Teams recommended setting the ABC below the maximum permissible. During the 15 years, the Plan Teams recommended setting ABC below the maximum permissible in a total of 76 instances. Reasons varied but generally grouped around concerns regarding the stock assessment (e.g., uncertain survey estimates or parameter estimates), population dynamics (e.g., poor recruitment or declining biomass), or ecosystem considerations (e.g., predation pressure or bird die-offs, though reductions due to ecosystem considerations were relatively uncommon). In some cases, economic factors were cited, such as variability in yield or the amount of effort required to catch the ABC. The buffers ranged from less than 10% to greater than 90%, but were most often between 10% and 30%, with a mode at a buffer of 15%.
One shortcoming of the historical analysis is that documentation existed only when there was a recommended reduction. In some cases, an evaluation was made of various concerns, but a reduction was not recommended because the conditions were regarded as not sufficiently extreme to warrant a reduction. In other cases, no evaluation was made. One advantage to applying a framework consistently for all stocks is that it would establish a stock-specific record of concerns and issues with the assessment, population dynamics, and the ecosystem. There would be supporting documentation in situations where the maximum permissible ABC was considered scientifically appropriate. There are many stocks in the North Pacific with reliable stock assessments, are at healthy levels of abundance, and have no severe environmental/ecosystem concerns, and documentation of these cases is important for a balanced perspective.
While acknowledging long history in Alaska of incorporating ecosystem and other concerns to adjust single-species stock assessment-based catch recommendations, in this paper our objective was to improve this process by designing a framework that would be applied consistently for each stock, and would document the criteria evaluated in support for or against a reduction in maximum ABC. The risk table described here establishes standardized framework to document assessment model, population dynamics, and ecosystem concerns that are not treated analytically within stock assessments. The table also provides reviewers and stakeholders with transparent documentation of the current state of knowledge of those concerns.
Methods
There are three types of interrelated considerations that could be used to support a recommendation whether or not to reduce the ABC below the maximum permissible ABC:
Assessment-related considerations, such as:
Data-inputs: biased ages, skipped surveys, lack of fishery-independent trend data.
Model fits: poor fits to fishery or survey data, inability to simultaneously fit multiple data inputs.
Model performance: poor model convergence, multiple minima in the likelihood surface, parameters hitting bounds.
Estimation uncertainty: poorly estimated but influential year classes.
Retrospective bias in biomass estimates.
Population dynamics considerations, such as: decreasing biomass trend, poor recent recruitment, inability of the stock to rebuild, abrupt increase or decrease in stock abundance, other unusual changes in stock age-structure or recruitment patterns.
Environmental/ecosystem considerations, such as: adverse trends in environmental/ecosystem indicators, ecosystem model results, decreases in ecosystem productivity, decreases in prey abundance or availability, increases in predator abundance or productivity.
Assessment-related considerations are those associated with an increase in the uncertainty of the stock assessment model. In contrast, population dynamics and environmental/ecosystem considerations relate to an increase in risk beyond what is already accounted for in a stock assessment. For example, this increased risk could be a result of a sudden decline in abundance, or a series of recruitment failures in a previously unobserved pattern. Other scenarios that increase the risk to the stock will be unanticipated, such as when the 2014–2016 marine heatwave in the Gulf of Alaska caused impacts to the Pacific cod stock.
Population dynamics considerations arise from the results produced by a stock assessment, which are estimated values and not direct observations. Consequently, extreme patterns in the population dynamics could be genuine phenomena or simply error in the assessment. For example, a very low (or high) recruitment could be real, or the result of an under (or over) estimate by the stock assessment model. Other interactions and linkages between the three categories are likely, so evaluating for each category should be cognizant of this possibility.
Environmental/ecosystem considerations will usually be based on indicators that track environmental or ecosystem properties that are regarded as important to the stock because of a plausible ecological connection. The indicators could be species-specific or ecosystem-wide indicators. Indicators could include direct forcing variables that have been linked to the population dynamics of the stock, or indirect indicators that inform a population process. An example of the former is the effect of temperature on recruitment, while an example of the latter is the fledgling success of a bird species that preys on the stock or similar prey of the stock.
We constructed a framework that distinguishes these three types of considerations (assessment, population dynamics, and environmental/ecosystem). Within each type of consideration, we described a range of concern from level 1 (no concern) to 4 (the highest level of concern) (). We proposed that as a standard part of the annual stock assessment process, assessment authors and ecosystem scientists initially assign risk levels by qualitatively evaluating each of the three types of considerations against known information that is not modeled analytically in the stock assessment model. We proposed selecting the highest risk level of the three types of considerations as the overall risk level for each stock or stock complex. This approach is most precautionary and accounts for the possibility that scores for the different types of consideration are related. The initial risk levels were assigned by the assessment authors and included in the draft stock assessments. They were then reviewed and adjusted through the same annual review process as the stock assessment. The amount of any recommended reduction needed to be clearly stated along with the risk table, with an explanation of how this value was selected.
Table 1. Risk classification table for assessment, population dynamics, and environmental/ecosystem considerations.
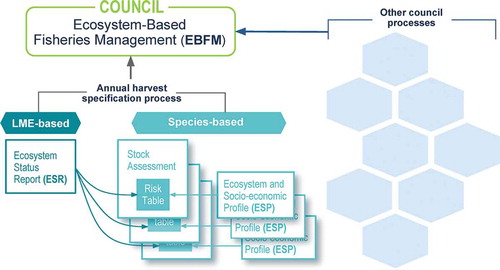
Information flow into risk table came from two main sources: the ecosystem status report, and the species-specific ecosystem and socioeconomic profiles (ESP, Shotwell Citation2018) that were available for some North Pacific stocks. The ecosystem status reports contain a broad range of ecosystem indicators that reflect ecosystem-level processes. The ESPs contain ecosystem indicators that are explicitly linked to the stock through mechanistic relationships. This information was combined to inform risk tables as part of the harvest specification process (), with the caveat that indicators in the ecosystem status reports have to be interpreted with respect to the particular stock. Identifying the relevant indicators in the ecosystem status reports to inform the risk table was a unique collaborative process between assessment authors and ecosystem scientists that were specifically assigned to assist in the preparation of the risk table.
Figure 2. Flow of ecosystem information in NPFMC annual harvest specification process. Risk tables are produced for each stock assessment using information from both the ecosystem-level ecosystem status report (ESR) and from the stock-specific ecosystem and socio-economic profiles (ESP).
When the risk table was initially proposed to the Plan Teams and SSC, we suggested there could be guidelines on percentage reduction in the ABC based on the risk level, with idea that a higher risk would result in a larger percentage reduction. Several options were presented, including a fixed percentage buffer that would increase (at either a faster or slower rate) as the overall risk level increased. These options were intended as examples to facilitate discussion but were also designed to roughly bracket the range of ABC reductions that were used in the past. These suggestions were not accepted by the Plan Teams and the SSC, preferring instead to maintain status-quo methods for setting buffers, and requesting additional analyses to support procedures for determining the amount of ABC reductions. The SSC strongly endorsed the use of risk tables in stock assessments, but recommended that for now they are used as support for making a reduction rather than being prescriptive regarding the amount of a potential ABC reduction, and also recommended that an increase in the risk score should not automatically result in an ABC reduction. The proposed framework does allow for progress to be made toward more standardized approaches in the future should the SSC modify its recommendations.
Results
During the 2018 assessment cycle, five risk tables were completed as test cases by assessment authors and ecosystem scientists and reviewed by NPFMC scientific review committees: GOA Pacific cod, GOA walleye pollock, BSAI Atka mackerel Pleurogrammus monopterygius, sablefish Anoplopoma fimbria, and EBS walleye pollock. Additionally, during the first level of scientific review of the EBS Pacific cod stock assessment, the Plan Team used the framework to complete a risk table for this stock. All of these stocks are assessed with age-structured assessment models, and are in tier 3 of the NPFMC tier system, with the exception of EBS walleye pollock, which is in tier 1.
Of the five stock assessments that initially included a risk table, four recommended a reduction from the maximum ABC (GOA Pacific cod, GOA walleye pollock, sablefish, and EBS walleye pollock). The risk table for BSAI Atka mackerel did not identify any elevated concerns for the assessment, population dynamics, or environmental/ecosystem categories resulting in an overall level 1 concern. Therefore, no reduction from the maximum permissible ABC of 68,500 t was recommended. The risk table that was completed by the Plan Team for EBS Pacific cod also recommended a reduction in ABC, in contrast to the stock assessment recommendation of the maximum permissible ABC. Below we summarize the scoring for those stocks and the resulting ABC recommendations.
GOA Pacific cod
A level 2 concern was identified for the assessment due to concerns about sensitivity to model assumptions and uncertainty in reference points. A level 4 concern was identified for population dynamics due to 3 years of poor recruitment, and increased natural morality of adults during the 2014–2016 marine heatwave. The female spawning biomass was estimated to be at its lowest point during the 41 years covered by the stock assessment. However, the Plan Team reduced this to level 2 given that the stock assessment already accounted for the low biomass. The environmental/ecosystem category was scored as level 2 concern because of the onset of a new marine heatwave in 2018 and poor prospects for age-0 survival. The author recommended a 13.6% reduction in the ABC to maintain the stock above the B20% in 2019 with greater than 50% probability based on model projections that consider assessment uncertainty and future recruitment variability. The B20% reference point is defined as the spawning stock biomass at 20% of the unexploited level, and is an important reference point in the protection measures for endangered Steller sea lions, for which Pacific cod is important prey. The Plan Team and SSC concurred, with the final ABC set at 17,000 t, 13.6% below maximum permissible ABC of 19,670 t determined by the stock assessment model.
GOA walleye pollock
This stock was scored at substantially increased concerns, level 2, for all three categories (). Assessment concerns included contradictory survey data and poor model fits. Population dynamics concerns included a lack of recruitment to the stock for 4 years and a collapsed age structure consisting of a single very strong year class. Environmental/ecosystem concerns included the onset of a marine heatwave in the GOA and weak El Niño conditions. The overall level 2 concern resulted in the assessment author recommending a 15% reduction from maximum ABC determined by the stock assessment model, which was the mode of buffers that have been applied in the past, based on the historical analysis reported above. The Plan Team selected a similar reduction (14.3%) using an average between the previous year’s ABC and the current ABC. The SSC concurred, setting the final ABC at 135,850 t, 14.3% below maximum permissible ABC of 158,520 t.
Table 2. Risk table evaluation for Gulf of Alaska pollock in the 2018 stock assessment.
Sablefish
A level 2 concern was identified for the stock assessment due to contrasting survey trends and poor fits to survey indices. A level 4 concern was identified for population dynamics. The sablefish assessment produced a recruitment estimate for the 2014 year class that is the largest ever, and is over seven times the average, but at the same time there has been a notable reduction in older-aged sablefish. Furthermore, an exceedingly large year class may have different growth and maturation characteristics than average, which could affect how quickly it enters the spawning biomass component of the stock. A level 2 concern was identified for the environmental/ecosystem assessment because the condition of maturing fish was low, indicating a suboptimal forage base. The overall score for sablefish was therefore a level 4 concern, and the author consequently recommended a 47% reduction from maximum ABC determined by the stock assessment model, similar to the previous year. The Plan Team and SSC concurred, with the final ABC set at 15,070 t, 47% below maximum permissible ABC of 28,170 t.
EBS walleye pollock
Increased concerns were identified only for the population dynamics and environmental/ecosystem categories. Population dynamics concerns included the below-average near-term recruitment and low age diversity of the spawning population. Environmental/ecosystem concerns included the unprecedented warm conditions and a reduced zooplankton prey base. The assessment author recommended a 30% reduction from the maximum permissible ABC determined by the stock assessment model based on a Tier 3 calculation (although EBS walleye pollock is considered a Tier 1 stock). An ABC based on Tier 3 calculation has been used for EBS walleye pollock for a number of years, so the recommendation in 2018 was in line with previous recommendations. The Plan Team and SSC agreed concurred, with the final ABC set at 2,163,000 t, 30% below maximum permissible ABC of 3,096,000 t.
EBS Pacific cod
The risk table was completed by the Plan Team rather than the assessment author. The Plan Team selected a range of level 2–3 concern for each category rather than assigning a single level of concern. Assessment concerns included retrospective bias in the stock assessment and sensitivity to model assumptions. Population dynamics concerns included recent low recruitment, including the lowest ever observed, and an unprecedented spatial distribution of the stock. Environmental conditions were also regarded as relatively extreme, and included the lack of sea ice, the absence of a cold pool, and unprecedented extent and duration of seabird die-offs indicating a lack of prey resources. Based on the overall level 2–3 concern, the Plan Team recommended a 20% reduction in the ABC below the maximum permissible ABC determined by the stock assessment model. The SSC regarded the low recent recruitment of Pacific cod as the primary concern, but concluded that this source of risk had been captured by the assessment model, and therefore did not accept the 20% proposed reduction by the Plan Team. Thus, the final ABC was set to the maximum permissible ABC of 181,000 t, as originally recommended in the stock assessment.
Much of the increased ecosystem-related concerns for these stocks are related to impacts of the 2014–2016 marine heatwave in the North Pacific. Gadids stocks seem to have been strongly affected by this extreme environmental anomaly, with Pacific cod clearly being more adversely impacted than walleye pollock, particularly in the GOA (Citation2020). Conversely, sablefish may have benefited from the marine heatwave (Hanselman et al. Citation2018).
After discussion of the potential benefits of a wider application of the risk table, the SSC requested that all stock assessment authors complete the risk table for the 2019 assessment cycle. The SSC considered the risk table to be an efficient way to organize concerns, and reiterated that it should be used to reach a decision rather than to justify a decision that had already been made. The SSC also requested that an additional column be added to the risk table to evaluate fishery performance and fishing behavior concerns, considering quantitative fishery metrics, local knowledge, and traditional knowledge for a broader set of observations. The SSC has previously cautioned against the use of economics considerations in recommending an ABC. Economics considerations are taken into account in the NPFMC system when setting the TAC, which must be set lower than or equal to the ABC. Therefore, fishery indicators should be restricted to those that provide information about stock, such as abundance trends and changes in phenology and spatial distribution. They should not be indicators of socioeconomic performance.
The NPFMC’s Advisory Panel (AP), composed of industry representatives and other stakeholders, discussed the risk table and ultimately endorsed the SSC’s recommendation. One concern of the AP was that application of the risk table would lead to more situations where a reduction from maximum ABC is recommended (however this does not appear to have happened). The AP emphasized that the existing tier system is designed to implement precautionary fisheries management and that the reductions from the maximum ABC should be infrequent. However, the AP also recognized the benefit of the risk table in promoting greater transparency in ABC recommendations by providing a clearly articulated and transparent list of concerns. The NPFMC likewise recommended that all stock assessment authors complete the risk table for the 2019 assessment cycle.
Discussion
The risk tables that were introduced in 2018 were designed to organize information used to support a recommendation about whether ABC should or should not be reduced from the maximum value from the stock assessment model. This type of information – encompassing concerns about the assessment model, stock population dynamics that may not be well addressed in the model, and environmental/ecosystem conditions – has a long history of being considered in the NPFMC assessment process, whether or not a reduced ABC is recommended. However, the organization of considerations and documentation thereof has been ad-hoc in the past. Thus, a primary motivation of developing the risk table introduced here is to create a standardized framework to document these concerns. A standardized framework has the added value of improving communication and increasing transparency among all stakeholders in a resource management process. Another benefit is that the risk tables establish a record of issues that were considered in developing scientific recommendations, as well whether the maximum permissible ABC was considered appropriate, or whether a reduction was recommended. This record, as it accumulates, will enable analyses of historical decision-making to improve future recommendations.
The risk table methodology developed in this paper is related to other types of qualitative risk assessments that have been developed to support fisheries management (Holsman et al. Citation2017). Vulnerability assessments were originally developed to evaluate the vulnerability of stocks to overfishing (Hobday et al. Citation2007) and have been applied extensively to evaluate overfishing risks for data-poor stocks (Hobday et al. Citation2011; Patrick et al. Citation2010, Ormseth and Spencer Citation2011). More recently this type of risk assessment has been adapted to evaluate vulnerability to climate change (Gaichas, Link, and Hare Citation2014; Hare et al. Citation2016; Spencer et al. CitationIn Press). These approaches are intended to generate an overall score that summarizes the risk to the stock, and evaluate static characteristics of stock (i.e., they are not dynamic). In contrast, the risk table methodology in this study is explicitly linked to a particular stock assessment and prevailing environmental conditions in a given year and is intended to inform a decision about the ABC. It should be expected that the risk level could change each time the stock is assessed as stock status and environmental conditions change.
The NPFMC Fishery Management Plans (FMP) for the groundfish of the Eastern Bering Sea and the Gulf of Alaska already allow flexibility in establishing an ABC that deviates from default control rules in the FMP. The risk table provides a qualitative framework for review of structural and parameter uncertainty within the assessment and consideration of environmental or ecosystem processes that could directly or indirectly influence the stock. Several other Councils, for example the Mid-Atlantic Council and the Pacific Council, use the P* procedure in which the SSC is responsible for characterizing the uncertainty in an assessment, and the Council specifies a P* that represents the Council’s risk policy (Shertzer, Prager, and Williams Citation2010). Together these generate the buffer between the OFL and ABC. The uncertainty considered by the SSCs for these Councils is broader in scope than the statistical uncertainty from the assessment model, giving the SSCs some flexibility to classify stock assessments with greater or less uncertainty. However, as applied by the Pacific Council, the focus is on assessment uncertainty, so this approach does not easily allow environmental information to be taken into account when establishing the ABC. This is not an inherent limitation of the approach, since the uncertainty parameter specified by the SSC could be used to take into account ecological concerns as well.
NOAA’s ecosystem-based fishery management roadmap (Link et al. Citation2016), and next-generation stock assessment improvement plan (Lynch, Methot, and Link Citation2018) both encourage stock assessment analysts and managers to incorporate ecosystem information into assessments. However, progress has been relatively slow (Marshall et al. Citation2018). In part, progress is made difficult by an evolving understanding of mechanistic relationships between ecosystem factors and stock assessment parameters. In addition, multiple factors may have synergistic, antagonist, or additive impacts on stock dynamics, and the responses may be nonlinear (Samhouri et al. Citation2017). If relationships between environmental indicators and stock parameters are not truly stationary, bias could be introduced into the stock assessment (Puerta et al. Citation2019). Also, adding additional features to an assessment model adds complexity, and parsimony is generally regarded as desirable in stock assessment. Therefore, qualitative approaches, such as the risk table developed here, can serve as an incremental improvement toward EBFM while more quantitative methods are developed and tested.
The risk table represents the best scientific understanding of environmental/ecosystem forcing, and the process of updating the table each assessment cycle allows any new understanding of mechanistic relationships to be considered. As our scientific understanding of relationships between indicators and stock dynamics improves, indicators may transition to being explicitly included in the assessment model if it is determined that contribute significantly to the assessment (Lynch, Methot, and Link Citation2018). If an indicator is included in the stock assessment, it should not be used as a basis for reducing from maximum ABC through the risk table process.
The initial application of risk tables was for data-rich stocks, i.e., stock in Tiers 1–3 in the NPFMC Tier system. These are stocks with age-structured analytical assessments for which there will be considerable information to populate the risk tables, particularly for assessment-related and population dynamics considerations. Application of the risk table to data-poor stocks will be more challenging because of the lack of information, but is still, we contend, a useful and relevant exercise. For example, for Tier 5 assessments, many of which are based on fits to survey trends, it would still be possible to evaluate the fit to survey trend (assessment-related consideration), and to determine whether the estimated trend is indicating a rapid change in stock status (population-dynamics consideration). For data-poor stocks little would be known about relationships between environment and stock dynamics. However, it may be possible to infer likely impacts on data-poor stocks of large-scale environmental indicators with broad ecosystem impacts, such as marine heatwaves. Finally, it should be noted that NPFMC fisheries management is designed to be more precautionary for data-poor stocks, so there may be less need to make adjustments to the ABC.
The assessment and population dynamics considerations in the risk table are a direct outcome of the process of conducting a stock assessment, but information for environmental/ecosystem considerations needs to be brought in from other sources. Although assessments in the North Pacific do include an ecosystem considerations section, these sections typically only include a description of the role of the stock in the ecosystem and some discussion of environmental and ecosystem drivers, and are not designed to track environmental/ecosystem indicators. Therefore, they are of limited utility in completing the risk table. Recently there has been progress to replace the ecosystem consideration section of stock assessments with ESPs (Shotwell Citation2018). These are standardized products that include ecosystem and socioeconomic indicators similar to those contained in the ecosystem status reports, but include only those indicators that are considered meaningful for the particular stock. A major difference between these stock-specific indicators and those in the ecosystem status report is that the indicators are based on a scientific understanding of relationship between indicator and stock, and thus can be evaluated as being beneficial or detrimental to the stock, albeit under assumptions of stationarity.
We argue that powerful rationale for using the risk table is that it provides greater transparency in the process of developing quota recommendations. Although reducing the ABC below the maximum permissible has been done relatively infrequently in the past, the rationales were always specific to the stock, so there was no way to compare one instance where a reduction was applied to another. A scoring procedure that requires assessment concerns, population dynamics concerns, and environmental/ecosystem concerns be evaluated concurrently greatly improves the objectivity of the criteria being applied, and ensures that the factors considered are as comprehensive as possible. Transparency has the additional benefit of allowing stakeholders to see whether the process is being applied consistently across stocks, and makes scientific advisors more accountable for their scientific recommendations (Hobday et al. Citation2019). Another unanticipated benefit of developing risk tables is that the process of building the tables fostered collaboration between assessment authors and ecosystem scientists. Assessment authors may not know what ecosystem information is available that could be relevant to their stock, and the risk tables create an avenue for ecosystem scientists to focus on assessments, and to contribute information that helps put assessment results in a broader context.
A potential drawback of the risk table approach as proposed here is that the link to a harvest recommendation is one-sided (only reductions from maximum ABC, not increases). A temporary increase in the ABC may be appropriate in some situations, subject perhaps to restriction that the OFL cannot be exceeded. For example, environmental conditions could be exceptionally good for a stock, or the assessment is judged to be extremely accurate. However, in order for a more symmetrical process to be considered for linking risk table scores to harvest recommendations, NPFMC FMPs would need to be modified.
At present, there is no explicit link between a score from the risk table and a quantitative ABC modification. Because a case-by-case approach was used to obtain a percent reduction, often based on historical precedent rather than a single method applied consistently, there was little consistency across stocks between the concern level and the percent reduction in the ABC. However, the 2018 assessment cycle was the first application of risk table approach, and continued application may gradually lead to more consistency among assessments, particularly as experience accumulates on scoring procedures and analytical approaches.
In their discussion of ways to make progress, SSC thought it preferable to base the ABC reduction on a calculation that showed how the proposed ABC reduction reduced the risk to the stock, and proposed using simulation testing to evaluate the performance of different ABC reductions under various scenarios, such as a long period of recruitment failure, or a stock dominated by a single very strong year class. While we agree that these simulations are likely to be helpful in evaluating the tradeoffs between harvest levels and undesirable events, it is unclear how generalizable these experiments would be.
Another approach to evaluating tradeoffs would be to prepare decision tables by running projections using different ABC reduction scenarios, and then evaluating projected stock status under different states of nature that represent the concerns identified in the risk table. For example, projections under periods of low and average recruitment might be done if a decline in recruitment was the concern. This would allow managers to evaluate tradeoffs between being too risk-adverse and losing fishing opportunities over the short-term versus long-term catch reductions that would occur if the Council did not buffer appropriately and the environment were to negatively impact the stock. However, we suspect that there will still be a need for general guidelines on ABC reductions, both as an interim approach and as a backstop to deal with unanticipated and novel situations.
Conclusion
The North Pacific is projected to experience relatively severe climate changes in the coming decades (Gattuso et al. Citation2015; Mathis et al. Citation2015; Deutsch et al. Citation2015). Important research is underway to anticipate those changes, evaluate the impacts on marine ecosystems and fisheries resources, and to develop management strategies that are robust to the projected changes (Hollowed et al. Citation2019). Nevertheless, marine ecosystems are not completely predictable in their behavior, and there are likely to be unanticipated impacts due to climate changes that require a rapid management response. We believe that the risk table described in this paper can be an important management tool to facilitate incorporation of varied information into the management process and should be included in suite of management tools needed to address the effects of climate change on marine resources. The generalized format of the tables is applicable to different management systems, increasing transparency in decision-making, and providing a record of knowledge to enhance single-species management systems.
Acknowledgments
We appreciate the efforts of the working group, particularly Grant Thompson, as well as the efforts of Elizabeth Siddon and Kalei Shotwell to inform the ecosystem section of the test case risk tables. We also appreciate Jim Ianelli, Sandra Lowe, Dana Hanselman, and Steve Barbeaux’s willingness to include test case risk tables in their 2018 stock assessments. We also appreciate and acknowledge the time and attention of the NPFMC Plan Teams, SSC, Advisory Panel, and Council, who reviewed the test case risk tables. Anne Hollowed and Elizabeth Siddon provided useful comments on the draft. The manuscript was improved by comments from three anonymous reviewers.
Disclosure statement
No potential conflict of interest was reported by the authors.
References
- Barbeaux, S. J., K. K. Holsman, and S. G. Zador. 2020. “Marine Heatwave Stress Test of Ecosystem-Based Fisheries Management in the Gulf of Alaska Pacific Cod Fishery.“ Frontiers in Marine Science 7: 703. doi:10.3389/fmars.2020.00703
- Bond, N. A., M. F. Cronin, H. Freeland, and N. Mantua. 2015. “Causes and Impacts of the 2014 Warm Anomaly in the NE Pacific. Geophys.” Geophysical Research Letters 42 (9): 3414–11. doi:10.1002/2015GL063306.
- Deutsch, C., A. Ferrel, B. Seibel, H.-O. Pörtner, and R. B. Huey. 2015. “Climate Change Tightens a Metabolic Constraint on Marine Habitats.” Science 348 (6239): 1132–1135. doi:10.1126/science.aaa1605.
- DiCosimo, J., R. D. Methot, and O. A. Ormseth. 2010. “Use of Annual Catch Limits to Avoid Stock Depletion in the Bering Sea and Aleutian Islands Management Area (Northeast Pacific).” ICES Journal of Marine Science 67 (9): 1861–1865. doi:10.1093/icesjms/fsq060.
- Fissel, B., M. Dalton, B. Garber-Yonts, A. Haynie, S. Kasperski, J. Lee, D. Lew, et al. 2019. Stock assessment and fishery evaluation report for the groundfish fisheries of the Gulf of Alaska and Bering Sea/Aleutian Islands area: Economic status of the groundfish fisheries off Alaska, 2017. Anchorage, AK: North Pacific Fishery Management Council.
- Gaichas, S. K., J. S. Link, and J. A. Hare. 2014. “A Risk-based Approach to Evaluating Northeast US Fish Community Vulnerability to Climate Change.” ICES Journal of Marine Science 71 (8): 2323–2342. doi:10.1093/icesjms/fsu048.
- Gattuso, J.-P., A. Magnan, R. Bille, W. Cheung, E. Howes, F. Joos, D. Allemand, et al. 2015. “Contrasting Futures for Ocean and Society Form Different Anthropogenic CO2 Emissions Scenarios.” Science 349 (6243): aac4722:1–10. doi:10.1126/science.aac4722.
- Hanselman, D. H., C. J. Rodgveller, K. H. Fenske, S. K. Shotwell, K. B. Echave, P. W. Malecha, and C. R. Lunsford. 2018. “Assessment of the Sablefish Stock in Alaska. In Stock Assessment and Fishery Evaluation Report for the Groundfish Resources of the GOA and BS/AI.” Anchorage, AK: North Pacific Fishery Management Council.
- Hare, J. A., W. E. Morrison, M. W. Nelson, M. M. Stachura, E. J. Teeters, R. B. Griffis, M. A. Alexander, et al. 2016. “A Vulnerability Assessment of Fish and Invertebrates to Climate Change on the Northeast U.S. Continental Shelf.” Plos One 11 (2): e0146756. doi:10.1371/journal.pone.0146756.
- Hobday, A. J., A. Smith, H. Webb, R. Daley, S. Wayte, C. Bulman, J. Dowdney, et al. 2007. “Ecological Risk Assessment for the Effects of Fishing: Methodology.” Report R04/1072 for the Australian Fisheries Management Authority, 174. Canberra, Australia: Australian Fisheries Managment Authority.
- Hobday, A. J., A. D. M. Smith, I. C. Stobutzki, C. Bulman, R. Daley, J. M. Dambacher, R. A. Deng, et al. 2011. “Ecological Risk Assessment for the Effects of Fishing.”.Fisheries Research 108 (2–3): 372–384. doi:10.1016/j.fishres.2011.01.013.
- Hobday, A. J., J. R. Hartog, J. P. Manderson, K. E. Mills, M. J. Oliver, A. J. Pershing, and S. Siedlecki. 2019. “Ethical Considerations and Unanticipated Consequences Associated with Ecological Forecasting for Marine Resources.“ ICES J. Marine Science 76 (5): 1244–1256. doi:10.1093/icesjms/fsy210.
- Hollowed, A. B., K. K. Holsman, A. C. Haynie, A. J. Hermann, A. E. Punt, K. Aydin, J. N. Ianelli, et al. 2019. “Integrated Modeling to Evaluate Climate Change Impacts on Coupled Social-ecological Systems in Alaska.” Frontiers in Marine Science 6: 775. doi:10.3389/fmars.2019.00775.
- Hollowed, A. B., K. Y. Aydin, T. E. Essington, J. N. Ianelli, B. A. Megrey, A. E. Punt, and A. D. M. Smith. 2011. “Experience with Quantitative Ecosystem Assessment Tools in the Northeast Pacific.” Fish and Fisheries 12 (2): 189–208. doi:10.1111/j.1467-2979.2011.00413.x.
- Holsman, K., J. Samhouri, G. Cook, E. Hazen, E. Olsen, M. Dillard, S. Kasperski, et al. 2017. “An Ecosystem-based Approach to Marine Risk Assessment.” Ecosystem Health and Sustainability 3 (1): e01256. doi:10.1002/ehs2.1256.
- Link, J., H. Sagar, K. Larsen, K. Osgood, and M. Ford eds.. 2016. K. Abrams, W. Arnold, K. Aydin, Y. deReynier, J. Bohnsack, R. Brainard, M. Brown, T. Curtis, M. Fogarty, S. Gaichas, R. Gamble, T. Garfield, B. Gerkee, R. Griffis, A. Gutierrez, J. Hare, C. Harvey, A. Hollowed, K. Holsman, J. Ianelli, I. Kaplan, T. Lederhouse, P. Levin, K. Long, D. Lipton, S. Lucey, P. Lynch, R. Methot, I. Ortiz, J. Polovina, R. Shuford, M. Sigler, H. Townsend, G. Watters, and S. Zador. NOAA Fisheries Ecosystem-based Fisheries Management Road Map. Fisheries Management Ecosystem-Based Fisheries Management Policy. National Marine Fisheries Service Procedure 01-120-01. Wash. D. C.: U.S Dep. Commer.
- Lynch, P. D., R. D. Methot, and J. S. Link (eds.). 2018. “Implementing a Next Generation Stock Assessment Enterprise. An Update to the NOAA Fisheries Stock Assessment Improvement Plan.” NMFS-F/SPO-183, 127. Memo: U.S. Dep. Commer., NOAA Tech. doi: 10.7755/TMSPO.183.
- Marshall, K. N., L. E. Koehn, P. S. Levin, T. E. Essington, and O. P. Jensen. 2018. “Inclusion of Ecosystem Information in US Fish Stock Assessments Suggests Progress toward Ecosystem-based Fisheries Management.” ICES Journal of Marine Science 76 (1): 1–9. doi:10.1093/icesjms/fsy152.
- Mathis, J. T., S. R. Cooley, B. Lucey, S. Colt, J. Ekstrom, T. Hurst, C. Hauri, W. Evans, J. N. Cross, and R. A. Feely. 2015. “Ocean Acidification Risk Assessment for Alaska’s Fishery Sector.” Progress in Oceanography 136: 71–91. doi:10.1016/j.pocean.2014.07.001.
- North Pacific Fishery Management Council (NPFMC). 2018a. Fisheries management plan for groundfish of the Gulf of Alaska. Anchorage, AK: North Pacific Fishery Management Council.
- North Pacific Fishery Management Council (NPFMC). 2018b. Fisheries management plan for groundfish of the Bering Sea and Aleutian Islands Management Area. Anchorage, AK: North Pacific Fishery Management Council.
- Ormseth, O. A. and P. D. Spencer. 2011. “An Assessment of Vulnerability in Alaska Groundfish.“ Fisheries Research 112: 127-133. doi:10.1016/j.fishres.2011.02.010
- Patrick, W. S., P. Spencer, J. Link, J. Cope, J. Field, D. Kobayashi, P. Lawson, et al. 2010. “Using Productivity and Susceptibility Indices to Assess the Vulnerability of United States Fish Stocks to Overfishing.” Fishery Bulletin U.S 108: 305–322.
- Protection of the Arctic Marine Environment Working Group (PAME). 2013. Marine Ecosystems (Lmes) of the Arctic Area - Revision LME Map 15th of May 2013. Langnes, Norway: Arctic Council, Fram Centre, Postboks.
- Puerta, P., L. Ciannelli, R. R. Rykaczewski, M. Opiekun, and M. A. Litzow. 2019. “Do Gulf of Alaska Fish and Crustacean Populations Show Synchronous Non-stationary Responses to Climate?” Progress in Oceanography 175: 161–170. doi:10.1016/j.pocean.2019.04.002.
- Samhouri, J. F., K. S. Andrews, G. Fay, E. L. Hazen, C. J. Harvey, S. M. Hennessey, K. Holsman, et al. 2017. “Defining Ecosystem-based Thresholds for Human Activities and Environmental Drivers in the California Current.” Ecosphere 8 (6): e01860. doi:10.1002/ecs2.1860.
- Sherman, K. 1991. “The Large Marine Ecosystem Concept: Research and Management Strategy for Living Marine Resources.” Ecological Applications 1 (4): 350–360. doi:10.2307/1941896.
- Shertzer, K. W., M. H. Prager, and E. H. Williams. 2010. “Probabilistic Approaches to Setting Acceptable Biological Catch and Annual Catch Targets for Multiple Years: Reconciling Methodology with National Standards Guidelines.” Marine and Coastal Fisheries 2 (1): 451–458. doi:10.1577/C10-014.1.
- Shotwell, S. 2018. “Update on the Ecosystem and Socio-economic Profile (ESP).” Report for the Joint Plan Teams in September 2018. Anchorage, AK: North Pacific Fishery Management Council. htttp://npfmc.legistar.com/gateway.aspx?M=F&ID=b0b106ab-73e5-437d-a311-12eecd009268.pdf
- Spencer, P. D., A. B. Hollowed, M. Sigler, A. Herman, and M. Nelson. In Press. “Trait-based Climate Vulnerability Assessments in Data-rich Systems: An Application to Eastern Bering Sea Fish and Invertebrate Stocks.” Global Change Biology 25 (11): 3954–3971. doi:10.1111/gcb.14763.
- Stevenson, D. E., and R. R. Lauth. 2019. “Bottom Trawl Surveys in the Northern Bering Sea Indicate Recent Shifts in the Distribution of Marine Species.“ Polar Biology 42 (2): 407–421.
- Thompson, G. 2018. “Analysis of past BSAI and GOA Groundfish Plan Team Recommendations to Set ABC below the Maximum Permissible Level.” Report for the Joint Plan Teams in September 2018. Anchorage, AK: North Pacific Fishery Management Council. http://npfmc.legistar.com/gateway.aspx?M=F&ID=4fc75683-e97e-4b20-9cca-5ed542d03526.pdf
- Thorson, J. T. 2019. “Measuring the Impact of Oceanographic Indices on Species Distribution Shifts: The Spatially Varying Effect of Cold‐Pool Extent in the Eastern Bering Sea.“ Limnology and Oceanography 64 (6): 2632–2645. doi:10.1002/lno.v64.6
- Yang, Q., E. D. Cokelet, P. J. Stabeno, L. Li, A. B. Hollowed, W. A. Palsson, N. A. Bond and S. J. Barbeaux. 2019. “How “The Blob” Affected Groundfish Distributions in the Gulf of Alaska?“ Fisheries Oceanography 28: 434-453. https://onlinelibrary.wiley.com/doi/epdf/10.1111/fog.12422
- Zador, S. G., K. K. Holsman, K. Y. Aydin, and S. K. Gaichas. 2017. “Ecosystem Considerations in Alaska: The Value of Qualitative Assessments.” ICES Journal of Marine Science 74 (1): 421–430. doi:10.1093/icesjms/fsw144.